You're staring at your dashboard. Google Ads says it drove 47 conversions this month. Facebook claims 52. LinkedIn insists it delivered 31. Your CRM shows 40 actual customers. The math doesn't add up—and your CMO wants to know which platform deserves next quarter's budget.
Sound familiar?
This is the attribution chaos that keeps marketers up at night. Every platform takes credit for the same sale. Your analytics tell different stories depending on where you look. And you're left making million-dollar budget decisions based on conflicting data and educated guesses.
A digital marketing attribution report cuts through this noise. It's your single source of truth that connects every touchpoint—from that first LinkedIn ad impression to the final demo request—to actual revenue. Not vanity metrics. Not platform-reported conversions that mysteriously add up to 200% of your actual customers. Real money flowing into your business.
This guide walks you through everything you need to know about attribution reports: what makes them work, how to build one that actually drives decisions, and how to use the insights to scale with confidence instead of crossing your fingers every time you adjust your ad spend.
The Anatomy of an Attribution Report That Actually Matters
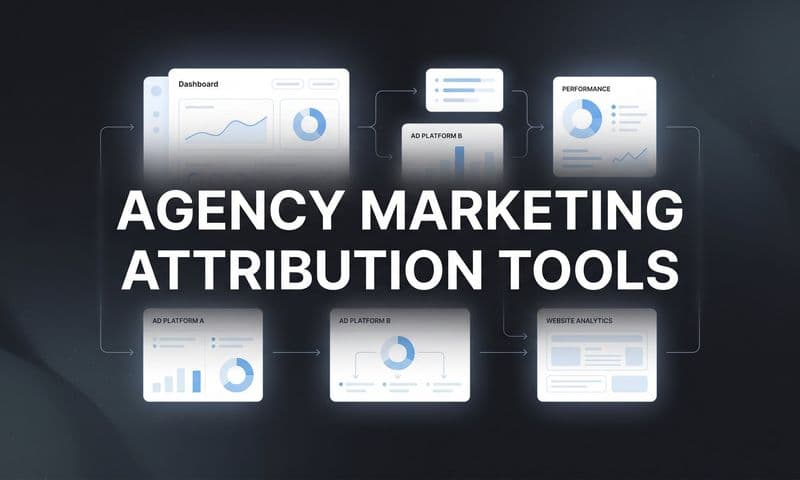
Not all attribution reports are created equal. Most marketers have access to some form of reporting, but there's a massive difference between a dashboard that shows clicks and one that shows which channels actually generate revenue.
A real attribution report starts with touchpoint data—every interaction a prospect has with your brand before converting. That first blog post they read at 2am while researching solutions. The LinkedIn ad they scrolled past but didn't click. The Google search three days later. The retargeting ad on Facebook. The email they opened. The webinar they attended. Every single moment matters because customers rarely convert on first contact.
Here's the thing: tracking touchpoints is table stakes. The magic happens when you connect those touchpoints to conversion events that matter to your business. Not just form fills or email signups, but qualified leads, demo requests, closed deals, and actual revenue. This is where most attribution reports fall apart—they track activity without connecting it to outcomes.
Revenue attribution is what transforms data from interesting to actionable. When you can see that prospects who engage with both your LinkedIn ads and educational content convert at 3x the rate of those who only see one touchpoint, you've got something worth acting on. When you discover that a channel you thought was underperforming actually assists in 60% of your highest-value deals, you stop making cuts that would have killed your pipeline.
Time-decay factors add another layer of sophistication. Not all touchpoints deserve equal credit. That ad impression from six months ago probably matters less than the case study they downloaded last week. Modern attribution reports weight touchpoints based on recency and proximity to conversion, giving you a more nuanced view of what's actually influencing decisions.
But here's what separates amateur reports from professional ones: the ability to track the full customer journey from anonymous visitor to closed customer. This requires connecting your ad platforms to your website analytics to your CRM to your revenue data. Most marketers stop at one or two of these connections and wonder why their attribution feels incomplete.
The difference between vanity metrics and revenue-connected insights is brutal. You can have a channel with sky-high engagement rates and impressive click-through numbers that generates zero revenue. Meanwhile, another channel might look mediocre in isolation but consistently assists in your highest-value conversions. Without revenue connection, you're flying blind.
An attribution report that actually matters shows you the money trail. It answers the question every executive asks: "If we spend an extra dollar here, what revenue can we expect?" Everything else is just interesting data.
Attribution Models Decoded: Choosing the Right Lens for Your Data
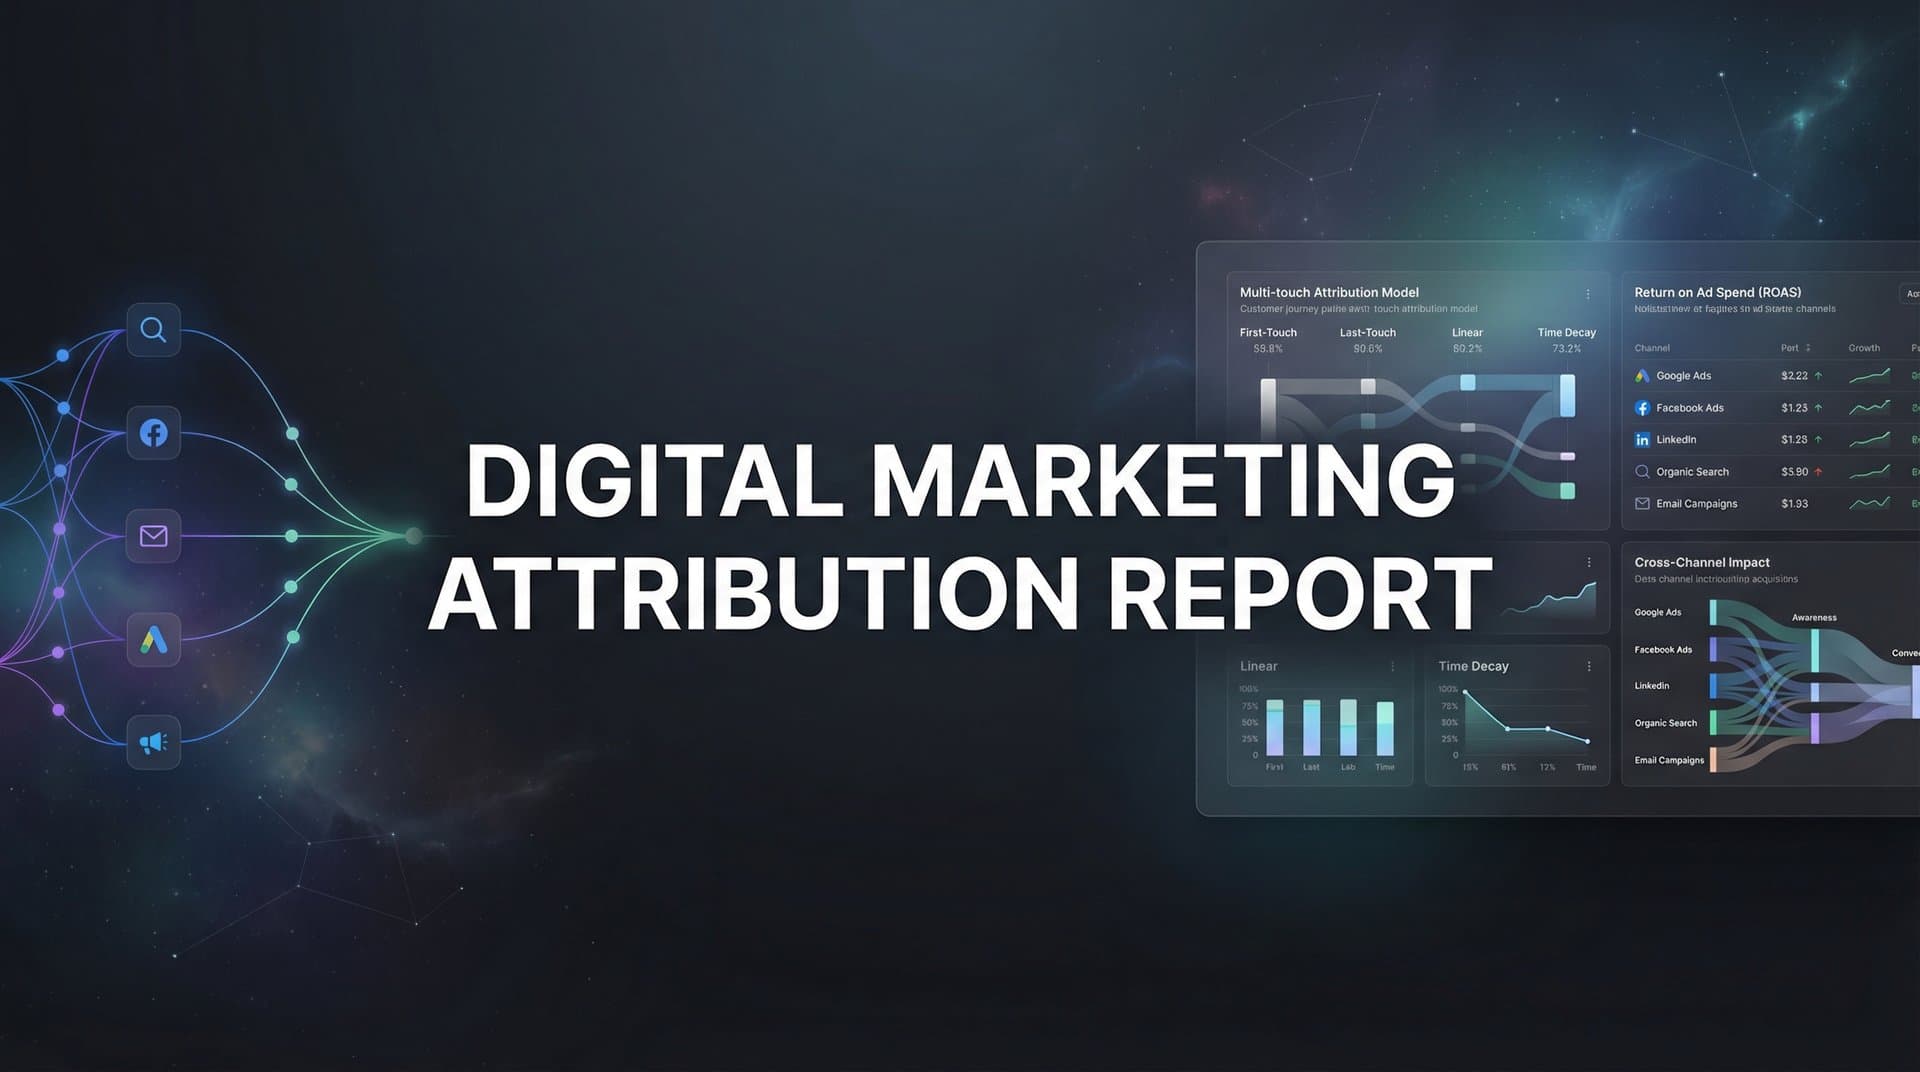
Attribution models are the frameworks that determine how credit gets distributed across touchpoints. Think of them as different lenses for viewing the same customer journey—each one reveals something different about what's working.
First-touch attribution gives all the credit to the channel that introduced someone to your brand. If a prospect first discovered you through a LinkedIn ad, that ad gets 100% credit for the eventual conversion, even if they interacted with five other channels before buying. This model favors top-of-funnel awareness channels and helps you understand what's filling your pipeline.
First-touch makes sense when you're focused on brand awareness and new customer acquisition. It tells you which channels are best at introducing new prospects to your business. But it completely ignores everything that happened after that first interaction—which can be misleading for businesses with longer sales cycles.
Last-touch attribution flips the script entirely. It gives all credit to the final touchpoint before conversion. If someone clicked a Google search ad right before purchasing, that ad gets 100% credit, regardless of the six months of content marketing and retargeting that came before. This model favors bottom-of-funnel conversion channels.
Last-touch is useful for understanding what finally pushes people over the edge to convert. It's popular because it's simple and because it often aligns with how sales teams think about closing deals. But it's dangerous because it can lead you to over-invest in channels that are just harvesting demand created by other marketing efforts.
Linear attribution distributes credit equally across all touchpoints. If someone had five interactions before converting, each touchpoint gets 20% credit. This model is democratic but potentially oversimplified—it assumes that every interaction had equal influence, which is rarely true in practice.
Time-decay attribution gets more sophisticated. It gives more credit to touchpoints closer to the conversion and less to earlier interactions. That blog post from three months ago might get 5% credit, while the demo request from last week gets 40%. This model reflects the reality that recent interactions often have more influence on final decisions.
Position-based attribution (also called U-shaped) assigns 40% credit to the first touchpoint, 40% to the last touchpoint, and distributes the remaining 20% among middle interactions. This model recognizes that both introducing someone to your brand and closing the deal matter more than middle-funnel touches.
So which model should you use? Here's the truth: there's no single "correct" model. Each one tells you something different about your marketing performance. Understanding what is a marketing attribution model and how each type functions is essential for making informed decisions.
For businesses with short sales cycles and transactional products, last-touch might provide sufficient insight. For companies focused on brand building and awareness, first-touch reveals which channels are best at filling the top of your funnel. For complex B2B sales with long cycles and multiple stakeholders, multi-touch models like time-decay or position-based give you a more complete picture.
The real power move? Compare multiple models side by side in the same report. When you see that a channel performs well in first-touch attribution but poorly in last-touch, you know it's great at awareness but weak at conversion. When a channel shows strong performance across all models, you've found a winner worth scaling.
This multi-model view reveals hidden patterns. You might discover that your podcast sponsorships rarely get last-touch credit but appear in 70% of your highest-value customer journeys as an early touchpoint. That insight changes how you value and optimize that channel.
Building Reports That Connect Ads to Actual Revenue
Creating an attribution report that actually drives decisions requires connecting systems that were never designed to talk to each other. Your ad platforms live in their own worlds. Your website analytics tracks behavior but doesn't know about revenue. Your CRM knows about deals but can't see ad impressions. Building the bridges between these systems is where the real work happens.
Start with your ad platforms—Google Ads, Meta, LinkedIn, TikTok, whatever channels you're running. You need to capture not just clicks, but impressions, creative variations, audience targeting, and spend data. This gives you the full picture of what prospects were exposed to, even if they didn't immediately click.
Next comes website tracking. This is where many attribution setups break down. Traditional pixel-based tracking relies on cookies and browser-side JavaScript, which means you're losing data every time someone blocks cookies, uses Safari with Intelligent Tracking Prevention, or switches devices mid-journey.
Server-side tracking solves this problem by capturing events on your server instead of in the browser. When someone fills out a form or makes a purchase, that conversion event gets logged server-side where ad blockers and privacy features can't interfere. This dramatically improves data accuracy and gives you a more complete view of the customer journey.
Here's why this matters in a privacy-first world: iOS updates and browser changes have made traditional tracking less reliable. Many marketers are missing 20-30% of their conversions simply because browser-based pixels can't fire. Server-side tracking bypasses these limitations and gives you data you can actually trust.
Your CRM integration is where attribution connects to revenue. This is the critical link that transforms marketing data into business intelligence. When someone becomes a lead in your CRM, you need to know every touchpoint that led to that moment. When they close as a customer, you need to attribute that revenue back to the marketing channels that influenced the deal.
This requires passing data bidirectionally. Marketing touchpoints flow into your CRM so sales teams can see the full context of each lead. Revenue and deal data flow back to your attribution system so you can see which channels drive actual money, not just activity. The right marketing attribution platforms for revenue tracking make this bidirectional flow seamless.
Conversion events need to reflect real business outcomes. Too many marketers optimize for metrics that don't matter—page views, time on site, email opens. These are fine for monitoring engagement, but they shouldn't be your conversion events. Instead, focus on actions that indicate buying intent: demo requests, free trial signups, qualified lead forms, purchases, contract signatures.
The more specific you can be, the better. Instead of tracking all form submissions equally, differentiate between bottom-funnel demo requests and top-funnel newsletter signups. Instead of counting all trials the same, track which ones convert to paid customers. This specificity lets you optimize for outcomes that actually move your business forward.
Data hygiene matters more than most marketers realize. Duplicate records, inconsistent naming conventions, and missing UTM parameters create attribution gaps that skew your entire analysis. Establish clear standards for how campaigns are named, how forms are tagged, and how leads are processed. Garbage in, garbage out applies brutally to attribution reporting.
The technical setup might sound complex, but modern attribution platforms handle most of this complexity for you. The key is ensuring all your systems are connected and passing clean, consistent data. Once that foundation is in place, building meaningful reports becomes straightforward.
Reading Your Report: From Data Points to Budget Decisions
You've built the report. Now comes the part that actually matters: using it to make smarter decisions. This is where many marketers stumble—they have the data but don't know how to translate it into action.
Start by identifying which channels truly drive conversions versus which ones just assist. A channel that shows up in 80% of customer journeys but rarely gets last-touch credit is valuable, just in a different way than a channel that consistently closes deals. Both matter, but they deserve different optimization strategies and budget allocations.
Look for channels that punch above their weight. You might discover that a relatively small investment in a particular channel—say, a niche podcast sponsorship—appears in the journey of your highest-value customers far more often than its spend would suggest. That's a signal to test scaling that channel.
Conversely, identify channels that look good in isolation but underperform in multi-touch attribution. A channel might report strong conversion numbers in its own dashboard but show weak performance when you see the full customer journey. This often happens with retargeting and branded search—they convert well because they're capturing people who are already convinced, not because they're creating new demand.
Spotting undervalued touchpoints requires looking beyond surface metrics. That educational blog content might not generate many direct conversions, but if it appears early in the journey of 60% of your customers, it's playing a crucial role in building awareness and trust. Cutting that content to reallocate budget to "higher-converting" channels could quietly destroy your pipeline three months from now.
Use your attribution data to identify hidden performers that deserve more investment. These are channels that might not look impressive in last-touch attribution but consistently contribute to successful customer journeys. They're often mid-funnel touchpoints—case studies, comparison content, webinars—that help prospects move from awareness to consideration.
The flip side is equally important: using attribution data to cut wasteful spend without killing hidden performers. This requires nuance. A channel with weak attribution across all models is probably underperforming and deserves scrutiny. But a channel with weak last-touch attribution and strong first-touch or assist metrics might be doing exactly what it should—just not closing deals directly.
Look for patterns in your highest-value customers. What channels do they interact with? How many touchpoints do they typically have before converting? What's the average time from first touch to closed deal? These patterns reveal your ideal customer journey and show you which investments are most likely to generate similar high-value customers.
Compare attributed revenue to platform-reported conversions. This comparison reveals how much credit inflation you're dealing with. If your platforms collectively claim 200 conversions but your attribution report shows 100 actual customers with properly distributed credit, you know that platform dashboards are dramatically overstating their impact.
Pay attention to conversion paths, not just individual channels. You might discover that prospects who engage with both your content marketing and paid social convert at dramatically higher rates than those who only see one or the other. This insight suggests that integrated campaigns across multiple channels might outperform single-channel efforts.
The goal isn't to find the one perfect channel and put all your budget there. It's to understand how channels work together to create customer journeys, then optimize your mix accordingly. Attribution reports show you the ecosystem, not just individual players.
Common Attribution Reporting Pitfalls and How to Avoid Them
Even well-built attribution reports can mislead you if you're not aware of their limitations. Let's talk about the gaps and how to work around them.
The cross-device tracking gap is massive. Someone discovers you on their phone during their commute, researches on their laptop at work, and converts on their tablet at home. Traditional cookie-based tracking sees three different people. Your attribution report shows three incomplete journeys instead of one cohesive path to purchase.
Solutions exist but require sophisticated identity resolution. This means connecting data points across devices using email addresses, login information, and probabilistic matching. When someone logs into your site or provides an email address, you can start connecting their cross-device behavior. Server-side tracking helps here too, as it's more reliable at maintaining user identity across sessions.
Platform-reported conversions often conflict with attribution data, and this confuses marketers constantly. Google Ads might report 50 conversions while your attribution platform shows that Google Ads contributed to 35 conversions with varying levels of credit. Both numbers can be "correct" depending on what they're measuring and what attribution model they're using.
The key is understanding that platform dashboards use last-click attribution by default and often have different conversion windows than your attribution system. They're also measuring within their own ecosystem without seeing the full cross-channel journey. Your attribution report provides the more complete picture, even if the numbers don't match platform dashboards exactly. These discrepancies represent a core digital marketing attribution problem that every marketer must navigate.
Long sales cycles create attribution challenges that simple models don't handle well. When someone takes six months to convert and has 20+ touchpoints along the way, attributing credit becomes complex. Which of those early touchpoints actually mattered? How do you weight interactions that happened months apart?
For long sales cycles, focus on milestone events rather than just the final conversion. Track when someone becomes a qualified lead, when they request a demo, when they enter negotiation. This gives you intermediate conversion points that make attribution more actionable. You can optimize for moving people from stage to stage, not just the final close.
Offline conversions are another common gap. Someone might see your ads, visit your website, then call your sales team or visit a physical location to convert. If you're not capturing and connecting that offline conversion back to the digital touchpoints that preceded it, your attribution is incomplete.
The solution requires integrating offline conversion data. This might mean importing marketing attribution for phone calls tracking data, connecting point-of-sale systems, or manually uploading offline conversions with identifiers that link back to digital touchpoints. It's extra work, but it's essential for businesses with significant offline revenue.
Attribution window settings dramatically affect your results, yet many marketers use defaults without thinking about them. A seven-day attribution window might miss conversions from prospects with longer consideration periods. A 90-day window might give credit to touchpoints that had minimal influence on the final decision.
Choose attribution windows that match your actual sales cycle. If your average time from first touch to conversion is 45 days, a 60-day attribution window makes more sense than a seven-day or 180-day window. Test different windows to see how they affect your results and choose one that reflects your business reality.
Data sampling is a hidden problem in many analytics platforms. When you're dealing with large data volumes, some systems sample your data rather than analyzing every event. This can skew your attribution results, especially for smaller channels or segments. Look for attribution solutions that analyze complete data sets rather than samples.
Putting Attribution Insights Into Action
Attribution reports are worthless if they sit in a dashboard gathering dust. The value comes from turning insights into optimization decisions that improve performance week after week.
Create a regular reporting cadence that drives optimization. Weekly or bi-weekly reviews work well for most teams. Look at which channels are trending up or down, which campaigns are outperforming or underperforming, and where you should reallocate budget. Make this a standing meeting with stakeholders who can actually act on the insights.
During these reviews, focus on changes and trends rather than absolute numbers. Did a channel's contribution to revenue increase this week? Did a particular campaign suddenly start appearing more often in high-value customer journeys? These changes signal opportunities to double down or pull back.
Feed better conversion data back to ad platforms for improved targeting. This is where attribution becomes a competitive advantage. When you send enriched conversion data back to Meta, Google, and other platforms—including which conversions led to actual revenue—their algorithms can optimize for outcomes that matter, not just actions.
This feedback loop is powerful. Instead of optimizing for any form submission, you're teaching the algorithm to find people who submit forms and then become customers. Instead of optimizing for trial signups, you're optimizing for trial signups that convert to paid accounts. The platforms get smarter about who to target, and your performance improves.
Build a culture of attribution-informed decision making across your team. This means moving away from gut-feel decisions and channel bias toward data-driven budget allocation. When someone suggests cutting a channel because it "doesn't seem to be working," you can pull up attribution data that shows its actual contribution to the customer journey.
Share attribution insights with your sales team. When they see the full journey of marketing touchpoints that led to a qualified lead, they can have more informed conversations. They understand what the prospect has already engaged with and can tailor their approach accordingly.
Use attribution data to inform creative strategy, not just budget allocation. If you see that certain messaging or creative themes consistently appear in high-performing customer journeys, double down on those themes. If particular content types show strong assist rates, create more of that content.
Test and iterate based on attribution insights. If your data suggests that prospects who engage with both paid social and content marketing convert at higher rates, test integrated campaigns that coordinate messaging across both channels. Measure whether the coordinated approach outperforms siloed efforts. Leveraging data analytics in digital marketing helps you identify these patterns and validate your hypotheses.
Remember that attribution is a tool for better decisions, not a source of absolute truth. No attribution model perfectly captures every nuance of how marketing influences buying decisions. The goal is to make better decisions this quarter than you made last quarter, not to achieve perfect measurement.
Moving Forward With Confidence
A digital marketing attribution report isn't just a nice-to-have dashboard—it's the foundation for scaling with confidence instead of hope. When you can see which channels actually drive revenue, which touchpoints matter most in the customer journey, and how your marketing investments connect to business outcomes, you stop making budget decisions based on platform dashboards that all claim credit for the same conversions.
The goal isn't perfect attribution. Perfect attribution doesn't exist in a world of cross-device journeys, privacy restrictions, and complex buying processes. The goal is better attribution than you had yesterday—clearer insights, more connected data, and smarter decisions about where to invest your next dollar.
Start with the fundamentals: connect your ad platforms, website tracking, and CRM data into a unified view. Choose attribution models that reflect your business reality. Focus on conversion events that matter to revenue, not just activity metrics. Build a regular cadence of reviewing and acting on attribution insights.
As you get more sophisticated, layer in server-side tracking for better accuracy, implement cross-device identity resolution, and feed enriched conversion data back to ad platforms to improve their targeting. Exploring the best marketing attribution tools can help you find solutions that match your specific needs and growth stage. Each improvement compounds, giving you progressively clearer visibility into what's actually driving results.
The marketers who win in the coming years won't be the ones with the biggest budgets—they'll be the ones who can see most clearly which investments drive real outcomes and scale those investments with confidence. Attribution reporting is how you develop that clarity.
Ready to elevate your marketing game with precision and confidence? Discover how Cometly's AI-driven recommendations can transform your ad strategy—Get your free demo today and start capturing every touchpoint to maximize your conversions.