You're running Meta ads, Google Shopping campaigns, TikTok promotions, and email sequences. Your monthly marketing budget just hit six figures. But when leadership asks which channels are actually driving revenue, you're stuck piecing together incomplete data from five different dashboards, each telling a different story.
Sound familiar?
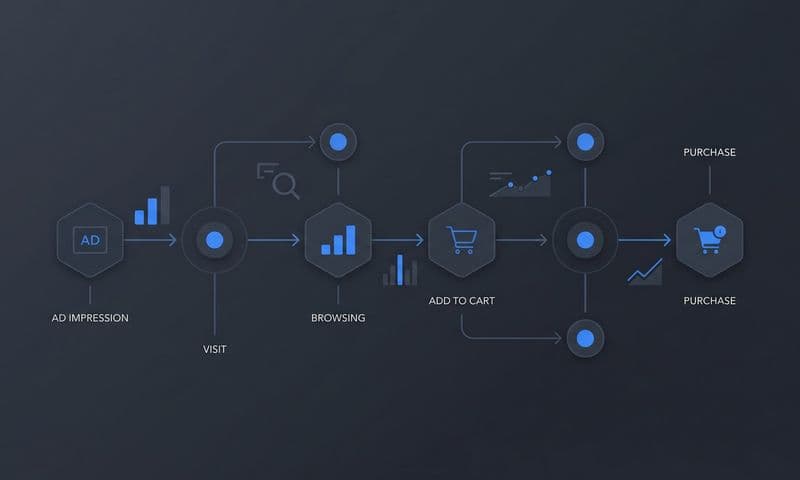
Most ecommerce marketers are flying blind when it comes to understanding the true impact of their marketing investments. You can see clicks and conversions in your attribution dashboard, but what about the TikTok video that introduced someone to your brand three weeks before they bought? Or the podcast sponsorship that built trust before they ever clicked an ad?
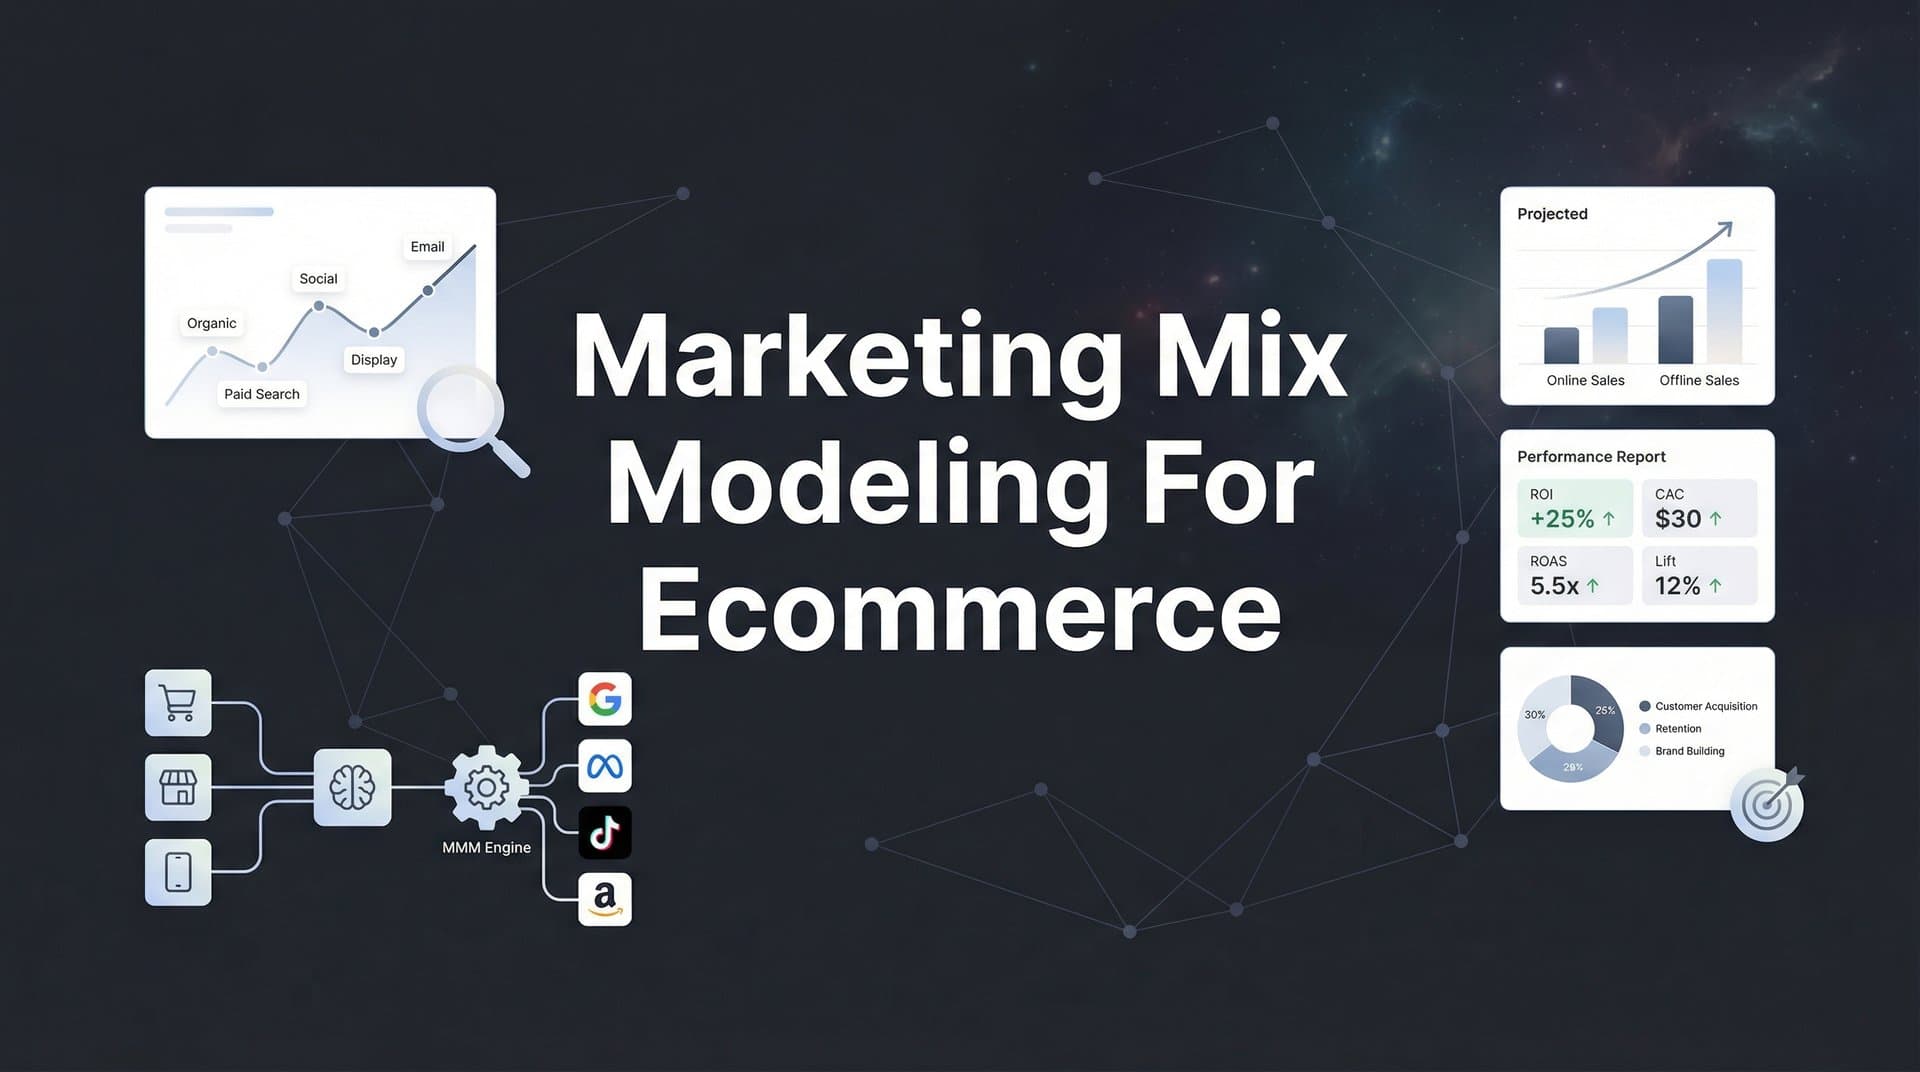
This is where marketing mix modeling enters the picture. Unlike traditional attribution that tries to track individual customer journeys, MMM takes a completely different approach—analyzing aggregate patterns across all your marketing activities to reveal which investments actually move the revenue needle. Think of it as stepping back to see the forest instead of obsessing over individual trees.
For ecommerce brands spending serious money across multiple channels, MMM has become essential. It's especially valuable now that iOS privacy changes and cookie deprecation have made traditional tracking increasingly unreliable. While your pixel might miss half your conversions, MMM doesn't care about cookies or device IDs—it just looks at the relationship between what you spend and what you earn.
The Statistical Engine Behind Channel Performance Analysis
Marketing mix modeling is fundamentally a top-down statistical approach. Instead of trying to follow individual customers through their journey, MMM analyzes aggregate data to understand the relationship between your marketing investments and business outcomes over time.
At its core, MMM uses regression analysis—a statistical method that identifies how changes in one variable (like your Meta ad spend) correlate with changes in another variable (like your revenue). The model examines historical patterns across weeks or months, controlling for external factors, to isolate the specific impact of each marketing channel.
Here's what makes this different from the attribution you're used to: Attribution tries to assign credit to specific touchpoints in a customer's journey. It's bottom-up, tracking individual interactions. MMM doesn't care about individual journeys at all. It looks at the big picture—when you increased Google Ads spend by 20% in March, did revenue increase proportionally? When you paused TikTok for two weeks, what happened to new customer acquisition?
The key inputs that feed your MMM include historical spend data for each marketing channel, typically broken down by week or month. You'll also need corresponding sales or revenue data for the same time periods. But here's where it gets interesting: MMM also factors in external variables that influence your results but aren't marketing-related.
These external factors might include seasonality patterns (everyone knows Q4 drives more ecommerce revenue), promotional periods (your Black Friday sale obviously impacts results), economic indicators (consumer confidence affects spending), and even weather patterns for certain product categories. The model accounts for these variables so it can isolate the true marketing effect.
Modern MMM implementations often incorporate concepts like adstock and saturation curves. Adstock represents the lagged effect of advertising—the idea that a campaign's impact doesn't stop the moment it ends. Someone might see your ad today but purchase next week. The model accounts for this delayed response.
Saturation curves capture the concept of diminishing returns. Spending your first $10,000 on Google Ads might generate strong returns, but your tenth $10,000 increment won't perform as well. The model identifies these saturation points for each channel, showing you where additional investment stops being efficient.
The output of your MMM is a set of channel coefficients—numbers that indicate the relative contribution of each marketing input to your sales. These coefficients tell you, for example, that every $1,000 invested in email marketing historically generates $3,500 in revenue, while $1,000 in display advertising generates $1,200. For a deeper dive into the fundamentals, explore our guide on what is marketing mix modeling and how it works.
What makes MMM particularly powerful for ecommerce is its ability to measure channels that are nearly impossible to track through traditional attribution. That podcast sponsorship? The influencer partnership where people search for your brand name later? The brand awareness campaign that doesn't generate immediate clicks? MMM captures their impact by analyzing the overall business patterns during the periods when these activities were running.
Why Ecommerce Brands Are Turning to MMM Now
The measurement landscape for ecommerce has fundamentally changed, and not in marketers' favor. iOS 14.5 dropped in April 2021, and the impact was immediate—Meta reported that advertisers lost visibility into roughly 15-20% of conversions overnight. Google's planned deprecation of third-party cookies keeps getting delayed, but the writing is on the wall.
Your pixel-based tracking is increasingly unreliable. When someone opts out of tracking on their iPhone, your attribution dashboard simply doesn't see their conversion. You're making budget decisions based on incomplete data, which means you're likely underinvesting in channels that are actually working.
This is precisely why MMM is experiencing a renaissance. The approach doesn't rely on user-level tracking at all. It doesn't need cookies, device IDs, or user consent to track behavior. MMM analyzes aggregate patterns—total spend in, total revenue out—which makes it completely privacy-compliant by design.
Think about it this way: Even if 60% of your iOS users opt out of tracking, your revenue data is still accurate. Your spend data is still accurate. MMM can analyze the relationship between these two datasets without ever needing to know what individual users did.
But the privacy angle is just one reason ecommerce brands are embracing MMM. The approach solves several unique challenges that traditional attribution struggles with.
First, there's the offline impact problem. Many ecommerce brands invest in channels that don't generate direct clicks—podcast sponsorships, traditional media, influencer partnerships where people manually search for the brand later. Traditional attribution either misses these entirely or assigns the conversion to whatever channel happened to be last-click. MMM captures the true impact by analyzing business patterns during periods when these activities were active.
Second, MMM excels at measuring brand awareness contribution. Not every marketing dollar should generate an immediate conversion. Some investments build awareness that pays off over weeks or months. MMM's time-series approach naturally captures these delayed effects through adstock modeling, showing you the long-term value of brand-building activities.
Third, MMM reveals cross-channel effects that attribution misses. When you increase Meta spend, does it make your Google Search campaigns more efficient because people are now searching for your brand? When you run a major influencer campaign, does it lift performance across all channels? MMM identifies these synergies by analyzing how channels interact and influence each other.
The approach is particularly valuable for ecommerce brands that have scaled beyond the early stages. If you're spending $50,000+ per month across multiple channels, you've accumulated enough historical data to build a reliable model. You're also at a scale where small optimization improvements translate to significant revenue gains. Understanding the nuances of marketing analytics for ecommerce brands becomes critical at this stage.
Many brands now use MMM as their strategic planning tool. It answers the big questions: Should we shift budget from Google to Meta? Is our email investment at the right level? Are we oversaturated on paid social? These are strategic decisions that require a complete view of marketing effectiveness—exactly what MMM provides.
Building Your First Marketing Mix Model: Data Requirements and Setup
Let's talk about what you actually need to build a reliable marketing mix model. The data requirements might seem daunting at first, but they're achievable for most established ecommerce brands.
The foundation is historical data—lots of it. Most statisticians recommend a minimum of two to three years of weekly data, though you can sometimes build useful models with 18-24 months if your business has clear patterns and sufficient volume. Why weekly data? It strikes the right balance between granularity and stability. Daily data is too noisy, monthly data loses important details.
You'll need complete spend data for every marketing channel you've invested in during this period. This means pulling historical spend from Meta Ads Manager, Google Ads, your email platform, affiliate networks, influencer payments—everything. The data needs to be organized consistently by week, with each channel as its own column.
Alongside your spend data, you need corresponding revenue or sales data for the same time periods. Most ecommerce brands use total revenue, but you might also model new customer revenue separately, or focus on specific product categories if different marketing channels drive different product lines.
Here's where it gets more sophisticated: You need to include external variables that influence your business but aren't marketing-related. These control variables help the model isolate the true marketing effect by accounting for other factors that drive sales.
Seasonality is your most important external variable. Ecommerce businesses have clear seasonal patterns—Q4 is typically strongest, January often slows down, summer might vary by product category. You can represent seasonality through simple month indicators, or get more sophisticated with holiday flags for specific weeks.
Promotional activity needs its own variables. If you ran a site-wide 25% off sale during a particular week, that obviously impacts revenue independent of your marketing spend. Create binary flags (1 or 0) indicating promotional periods, or include the discount percentage as a continuous variable.
Competitor activity matters too, though it's harder to track. If you operate in a category where you can monitor competitor advertising (using tools like Pathmatics or Sensor Tower), include estimates of their spend levels. Even rough directional data helps the model understand when competitive pressure was high versus low.
Economic indicators can improve model accuracy, especially for higher-priced products. Consumer confidence indices, unemployment rates, or relevant commodity prices might influence your sales independent of marketing. These are readily available from sources like the Federal Reserve Economic Data (FRED) database.
For certain product categories, even weather data can be relevant. Selling outdoor gear? Temperature and precipitation data might explain sales variance better than marketing alone. The National Weather Service provides historical weather data that you can match to your business location or customer base.
Data granularity and consistency are critical. Every channel needs to be tracked the same way throughout the entire historical period. If you changed how you categorize spend halfway through—say, you started breaking out Instagram from Facebook—you'll need to go back and make the historical data consistent. Our marketing mix modeling tutorial walks through these data preparation steps in detail.
One common mistake is having gaps in your data. If you paused a channel completely for several weeks, that's actually valuable information for the model. But if you simply have missing data because you didn't track something properly, that creates problems. The model needs complete, consistent data across all time periods.
The quality of your data directly determines the quality of your model outputs. Garbage in, garbage out isn't just a saying—it's a statistical reality. Before building your model, audit your data carefully. Do the spend numbers match your actual invoices? Does the revenue data align with your accounting records? Are there any obvious anomalies or data entry errors?
Most ecommerce brands work with a data analyst or statistician to actually build their MMM, but understanding these data requirements helps you prepare properly. The setup work is significant, but once you have clean, organized historical data, the modeling process becomes much more straightforward.
Interpreting MMM Results: From Coefficients to Budget Decisions
You've built your model and the outputs are in front of you. Now comes the crucial part: translating statistical findings into actionable budget decisions. This is where many marketers get stuck—the numbers make sense to a data scientist, but what do they mean for your Q2 planning?
Let's start with channel coefficients, which are the heart of your MMM output. Each marketing channel gets a coefficient that represents its contribution to revenue. A coefficient of 2.5 for email marketing means that, on average, every dollar you spend on email historically generated $2.50 in revenue, after controlling for all other factors.
But here's the critical insight most marketers miss: These coefficients represent average historical performance, not marginal returns. The coefficient tells you what happened on average across all your historical spend levels. It doesn't tell you what will happen if you double your investment tomorrow.
This is where diminishing returns curves become essential. Your MMM should output saturation curves for each channel, showing how returns change as you increase investment. These curves typically show strong returns at low spend levels, then gradually flatten as you approach saturation.
Picture a curve that rises steeply at first, then levels off. The steep part represents efficient spending—every additional dollar generates strong returns. The flat part represents saturation—you're reaching the same people repeatedly, or you've exhausted the available audience, so additional dollars generate minimal incremental revenue.
The practical application? Look at where your current spend sits on each channel's curve. If you're operating in the steep part, you have room to scale. If you're in the flat part, additional investment won't be efficient—you should reallocate budget to channels with more headroom.
Marginal ROI is the concept that guides these incremental decisions. It answers the question: If I spend one more dollar in this channel, how much revenue will it generate? This is different from average ROI, which looks at all historical spend combined.
Let's make this concrete. Say your Meta Ads show an average coefficient of 3.0, meaning every dollar historically generated $3 in revenue. Sounds great. But when you look at marginal ROI at your current spend level, it might be just 1.5—meaning the next dollar you invest will only generate $1.50. Meanwhile, your Google Shopping marginal ROI at current spend is 4.0.
The decision becomes clear: You should shift budget from Meta to Google Shopping until the marginal ROIs equalize. You keep reallocating until every channel is operating at roughly the same marginal efficiency. This is how you optimize your total budget allocation.
Your MMM outputs should also show confidence intervals around each coefficient. These intervals indicate the statistical certainty of the model's estimates. A narrow confidence interval means the model is quite certain about a channel's impact. A wide interval suggests more uncertainty, often due to limited historical data or high variability in that channel's performance.
Pay attention to these confidence intervals when making decisions. If a channel shows strong returns but wide confidence intervals, you might want to test changes cautiously rather than making dramatic shifts.
Another valuable output is the base sales estimate—the revenue your business would generate with zero marketing spend. This represents organic traffic, repeat customers, and brand strength. Understanding your base sales helps you see how dependent your business is on paid marketing and informs decisions about brand investment.
When translating MMM insights into budget recommendations, think in terms of scenarios. Most models can simulate different budget allocations to show expected outcomes. You might run scenarios like: What happens if we shift 20% of Meta budget to Google? What if we increase total marketing spend by 30% and allocate it proportionally? What if we cut the lowest-performing channel entirely?
These scenario analyses help you plan with confidence. Instead of guessing, you're making data-driven projections based on historical patterns and statistical relationships. Learning best practices for using data in marketing decisions ensures you're interpreting these outputs correctly.
One final consideration: MMM outputs typically come with a recommended refresh cadence. Most models should be updated quarterly or semi-annually as you accumulate new data. Marketing effectiveness changes over time—creative fatigues, audiences saturate, competitive dynamics shift. Regular model updates ensure your budget decisions stay grounded in current reality, not outdated patterns.
MMM Limitations and How Multi-Touch Attribution Fills the Gaps
Marketing mix modeling is powerful, but it's not a complete measurement solution. Understanding its limitations helps you build a more comprehensive measurement strategy that combines multiple approaches.
The first major limitation is data requirements. MMM needs years of historical data to produce reliable results. If you're a newer ecommerce brand or you've recently launched new marketing channels, you simply don't have enough history to build a robust model. You're stuck making decisions without this strategic tool until you accumulate sufficient data.
Even with adequate historical data, MMM operates on a slow feedback loop. Most models analyze weekly or monthly patterns, which means you're always looking backward at historical performance. If you launch a new creative campaign on Monday, MMM won't tell you how it's performing until you've accumulated weeks of data and refreshed the model.
This is a fundamental mismatch with how modern ecommerce marketing actually works. You're making tactical decisions daily: which ad creative to scale, which audience to test, which product to feature. MMM can't guide these decisions because it operates at a strategic, aggregate level.
Another limitation is measuring tactical changes within channels. MMM might tell you that Meta Ads overall are performing well, but it can't tell you whether your carousel ads outperform video ads, or whether your lookalike audiences beat interest targeting. The model works at the channel level, not the campaign or ad level.
MMM also struggles with rapid changes and testing. If you're constantly experimenting with new channels, new creative approaches, and new audience strategies, the model has difficulty isolating stable patterns. It works best when your marketing mix is relatively consistent over time.
This brings us to why multi-touch attribution is the natural complement to MMM. While MMM provides strategic direction, attribution provides tactical guidance. Attribution tracks individual customer journeys in real-time, showing you exactly which touchpoints contributed to each conversion. Our comprehensive guide on multi-touch attribution vs marketing mix modeling explores these differences in depth.
Think of it this way: MMM tells you that Google Shopping deserves 35% of your budget based on historical patterns. Attribution tells you which specific Google Shopping campaigns are driving conversions today, which products perform best, and which audience segments convert most efficiently.
The combination creates a complete measurement picture. Use MMM for quarterly budget planning and strategic channel allocation. Use attribution for daily optimization decisions within each channel—which campaigns to scale, which creative to test, which audiences to prioritize.
Attribution also validates MMM insights at a granular level. If your MMM suggests Meta Ads are underperforming, you can use attribution data to understand why. Is it specific campaigns? Certain audience segments? Creative fatigue? Attribution provides the diagnostic detail that MMM lacks.
Here's where data quality becomes critical for both approaches: The more complete your touchpoint tracking, the better both your MMM and attribution perform. Capturing every ad click, every email open, every website visit, and every CRM interaction gives both models rich data to work with.
Many sophisticated ecommerce brands now use attribution data as an input to their MMM. Instead of just including total Meta spend, they include performance metrics from their attribution system—like attributed revenue or conversion counts. This creates a feedback loop where each measurement approach enhances the other. Understanding the relationship between marketing mix and attribution modeling helps you build this integrated approach.
The key is recognizing that no single measurement approach is perfect. MMM can't see real-time performance. Attribution struggles with view-through impact and brand awareness. Pixel-based tracking misses opted-out iOS users. But when you combine multiple measurement approaches, you compensate for each method's weaknesses and gain a more complete understanding of marketing effectiveness.
Putting It All Together: A Unified Measurement Approach for Ecommerce
The most sophisticated ecommerce marketers don't choose between measurement approaches—they orchestrate them into a unified strategy. Here's how to build a measurement framework that leverages the strengths of each approach while compensating for their limitations.
Start with a clear division of responsibilities. Use marketing mix modeling for strategic decisions: annual budget planning, channel mix optimization, and long-term investment priorities. These decisions benefit from MMM's aggregate view and its ability to measure hard-to-track channels. Refresh your MMM quarterly or semi-annually as new data accumulates.
Use multi-touch attribution for tactical optimization: daily campaign management, creative testing, audience refinement, and real-time budget pacing. Attribution's granular, immediate feedback makes it ideal for operational decisions. Monitor your attribution dashboard daily and use it to guide your optimization efforts. Implementing a multi-touch marketing attribution platform gives you this real-time visibility.
The foundation of both approaches is comprehensive data capture. Every touchpoint matters—ad clicks, email opens, website visits, CRM events, even offline interactions if possible. The more complete your data, the more reliable both your MMM and attribution become.
This is where modern tracking infrastructure becomes essential. You need systems that capture every customer interaction across all channels and devices. Server-side tracking helps maintain data accuracy despite browser restrictions and privacy controls. Proper implementation ensures you're feeding both your strategic and tactical measurement tools with high-quality data.
Create feedback loops between your measurement approaches. When MMM suggests a channel is underperforming, dive into attribution data to diagnose why. When attribution shows certain campaigns driving strong results, verify that the channel-level performance aligns with MMM expectations. This cross-validation catches measurement issues and deepens your understanding.
Set up regular measurement reviews that incorporate insights from both approaches. Your monthly marketing review might include attribution metrics for recent campaign performance, while your quarterly planning sessions rely more heavily on MMM insights for budget reallocation. Each measurement tool serves its purpose at the appropriate time horizon. Using a marketing dashboard for multiple campaigns helps consolidate these insights in one place.
Don't forget about incrementality testing as a third measurement layer. While MMM and attribution analyze observational data, incrementality tests (like geo experiments or holdout tests) provide causal proof of marketing impact. Run these tests periodically to validate your other measurement approaches and refine your understanding of true marketing effectiveness.
For most ecommerce brands, the practical implementation looks like this: Build your MMM once you have sufficient historical data (2-3 years), then refresh it quarterly. Implement robust attribution tracking from day one to guide daily decisions. Use attribution to optimize within the budget allocations that MMM recommends. Run incrementality tests occasionally to validate both systems.
The investment in comprehensive measurement pays off exponentially as you scale. When you're spending millions annually across multiple channels, even small optimization improvements translate to significant revenue gains. Knowing with confidence where to invest your next dollar is worth far more than the cost of building proper measurement infrastructure. Exploring the right marketing mix modeling software can accelerate your implementation.
Moving Forward with Confidence
Marketing mix modeling represents a fundamental shift in how ecommerce brands understand marketing effectiveness. Instead of obsessing over last-click attribution or trying to track increasingly untrackable individual journeys, MMM steps back to analyze the big picture: what you invest versus what you earn, controlling for everything else that matters.
For ecommerce marketers navigating privacy changes and fragmented customer journeys, MMM provides the strategic clarity that pixel-based tracking can no longer deliver. It answers the questions that keep CMOs up at night: Are we investing in the right channels? Where should we scale? What's our optimal budget allocation?
But MMM isn't a silver bullet. It's one piece of a comprehensive measurement strategy. The brands winning in 2026 are those that combine MMM's strategic insights with attribution's tactical guidance and incrementality testing's causal validation. They've built measurement infrastructure that captures every touchpoint, feeds multiple analytical approaches, and provides confidence at every decision level.
If you're ready to move beyond guesswork and build a measurement strategy that actually works in today's privacy-first world, start with your data foundation. Ensure you're capturing every customer interaction across all channels and touchpoints. This complete data picture is what makes both strategic and tactical measurement possible.
Ready to elevate your marketing game with precision and confidence? Discover how Cometly's AI-driven recommendations can transform your ad strategy—Get your free demo today and start capturing every touchpoint to maximize your conversions. With complete journey tracking and AI-powered insights, you'll have the data foundation you need for both strategic MMM analysis and real-time optimization decisions.
The future of ecommerce measurement isn't choosing between approaches—it's orchestrating them into a unified strategy that provides confidence at every level of decision-making. Start building yours today.