Every marketer running paid campaigns across multiple platforms has faced the same frustrating reality: the numbers never add up. Meta says it drove 200 conversions, Google claims 180, and your CRM only shows 150 total sales. That gap between what ad platforms tell you and what independent measurement tools reveal can make or break your budget decisions.
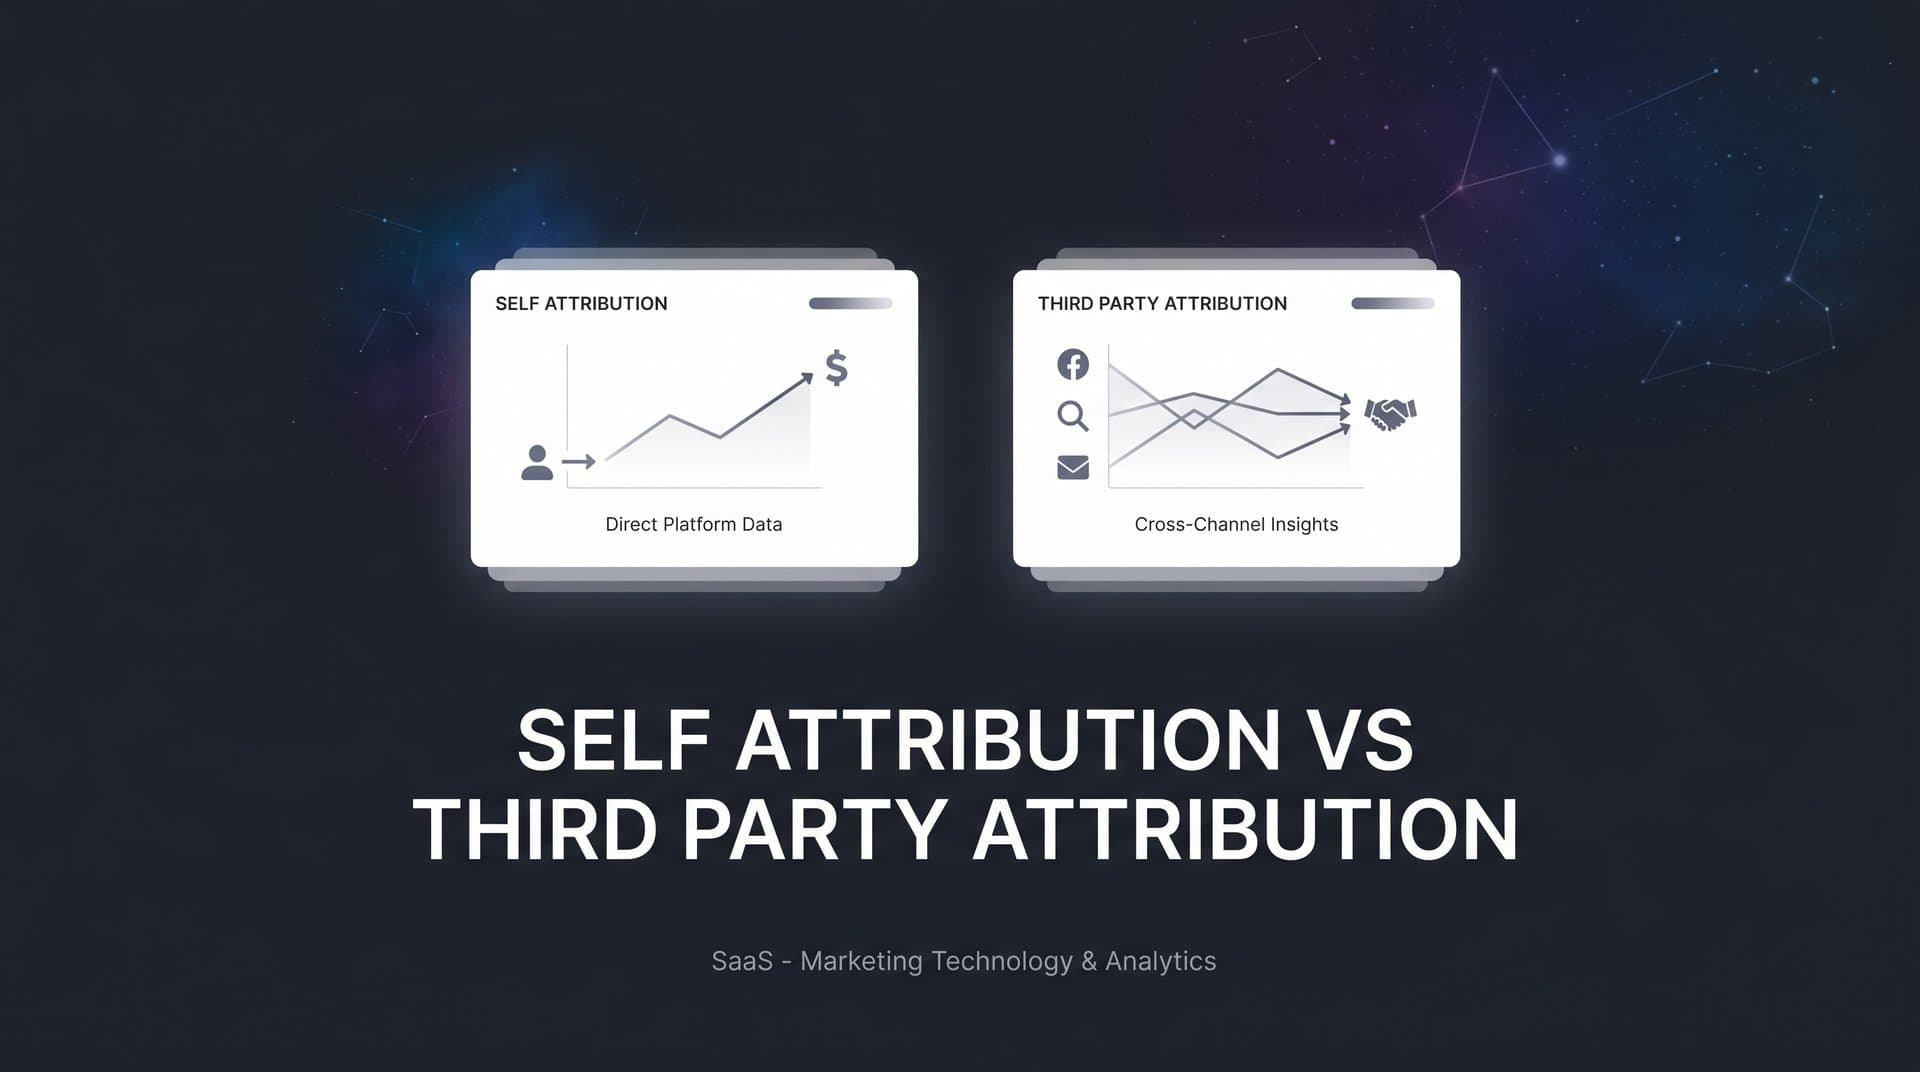
Self attribution, also called platform-reported attribution, is the data each ad platform provides about its own performance. Third party attribution uses an independent system to track the full customer journey across all channels, giving you a unified and unbiased view. Neither approach is inherently wrong, but relying on just one without a clear strategy leads to inflated numbers, wasted spend, and misguided scaling decisions.
The smartest marketing teams use both strategically. They cross-reference data sources to find the truth and make confident budget decisions rather than arguing with dashboards that will never agree with each other.
In this guide, we will walk through seven actionable strategies to help you understand, compare, and leverage both self attribution and third party attribution so you can finally trust your data and scale what actually works.
1. Understand Where Platform-Reported Numbers Inflate (and Why)
The Challenge It Solves
Before you can fix a data problem, you need to understand why it exists. Ad platforms are structurally incentivized to report strong performance. Their attribution methodologies are designed to capture as much credit as possible, which means the numbers they show you are almost always higher than what actually happened. Knowing exactly where the inflation comes from is the first step toward cutting through it.
The Strategy Explained
Each platform has its own default attribution settings that you need to audit. Meta, for example, defaults to a 7-day click and 1-day view attribution window. That means if someone sees your ad but never clicks it, and then purchases within 24 hours through any channel, Meta claims credit. Google Ads defaults to data-driven attribution, which uses its own modeling to distribute credit across touchpoints it can observe within its ecosystem. Understanding attribution windows in advertising is essential to interpreting these numbers correctly.
The deeper structural issue is that platforms operate in silos. If a user clicks a Meta ad on Monday and a Google ad on Wednesday before purchasing on Friday, both platforms claim the full conversion. This double-counting is not a bug or an error. It is a predictable outcome of how self attribution works. Understanding this dynamic stops you from taking platform-reported numbers at face value and sets the foundation for every other strategy in this list.
Implementation Steps
1. Log into each ad platform and review the default attribution window settings in the column customization or measurement settings menus.
2. Document what each platform counts as a conversion: click-through, view-through, or both. Note the window lengths for each.
3. Compare your total platform-reported conversions against your CRM-confirmed sales for the same period to quantify the aggregate discrepancy.
4. Identify which platforms have the widest view-through windows, as these tend to inflate numbers the most for upper-funnel campaigns.
Pro Tips
Consider switching view-through attribution to zero or one day on platforms where you run primarily awareness campaigns. This reduces phantom credit claims and gives you a more honest read on performance. You can always run a controlled comparison to see how the numbers shift before committing to the change permanently.
2. Establish a Single Source of Truth with Independent Tracking
The Challenge It Solves
When every platform has its own version of the truth, there is no truth. Marketing teams waste enormous amounts of time debating which dashboard to believe instead of acting on insights. Without a neutral, independent system that sits outside any single platform, you will always be working with conflicting data and making decisions based on whoever argued most convincingly in the last meeting. This is precisely why attribution data doesn't match across your tools.
The Strategy Explained
Third party attribution solves this by creating a unified tracking layer that is not affiliated with any ad platform. It ingests data from your ad accounts, your website, and your CRM, then deduplicates and reconciles that data into a single, consistent view of the customer journey.
The most reliable version of this setup uses server-side tracking. Traditional pixel-based tracking relies on browser cookies, which are increasingly blocked by browsers, ad blockers, and privacy restrictions that expanded significantly after Apple's App Tracking Transparency update in 2021. Server-side tracking sends conversion data directly from your server rather than the user's browser, bypassing many of these limitations and capturing events that pixel-based tracking would miss entirely. For more on this shift, explore how brands are tracking users without third party cookies.
Cometly's server-side tracking connects your ad platforms, website, and CRM into one deduplicated view, giving you a foundation of clean data that every other attribution decision can be built on.
Implementation Steps
1. Choose a third party attribution platform that supports server-side tracking and integrates with all of your active ad channels and your CRM.
2. Implement server-side event tracking for your key conversion events, starting with purchases or lead submissions.
3. Connect your CRM data so that offline conversions and pipeline events are included in the unified view.
4. Set a consistent attribution window across your independent system so comparisons are apples-to-apples over time.
Pro Tips
Treat your third party attribution system as the referee, not just another data source. When platform numbers and independent numbers disagree, the independent system should be your default for budget decisions. Train your team to use this hierarchy consistently so debates about which number to trust become a thing of the past.
3. Run Side-by-Side Comparisons to Spot Data Gaps
The Challenge It Solves
Even after setting up independent tracking, many teams still make budget decisions based on platform-reported numbers out of habit or convenience. Without a structured comparison process, the discrepancies between self attribution and third party attribution remain invisible in day-to-day operations. You need a repeatable system that makes the gap visible and measurable on a regular basis.
The Strategy Explained
A side-by-side comparison framework puts platform-reported conversions next to independently tracked conversions and CRM-confirmed sales for the same time period. The goal is not to prove one source wrong. It is to understand the relationship between the numbers so you can make informed decisions about how much weight to give each source. For a deeper dive into this challenge, read about solving attribution data discrepancies across your marketing stack.
For example, if Meta consistently reports 40 percent more conversions than your independent system captures, you can apply a calibration factor when evaluating Meta campaigns. If Google's numbers align closely with your third party data, you can trust them with more confidence. This calibration process turns a frustrating data problem into a strategic advantage. Teams that do this regularly develop an intuition for which channels over-report, by how much, and under what conditions.
Cometly's analytics dashboard makes this comparison straightforward by displaying platform-reported and independently attributed data side by side, so you can see discrepancies without building manual spreadsheets.
Implementation Steps
1. Build a weekly or bi-weekly comparison report that pulls platform-reported conversions, third party attributed conversions, and CRM-confirmed sales into the same view.
2. Calculate a discrepancy ratio for each platform: platform-reported divided by CRM-confirmed, expressed as a multiplier.
3. Track these ratios over time to identify trends. A platform's over-reporting ratio may change as you adjust campaigns or attribution windows.
4. Use the discrepancy ratios to adjust how you interpret platform performance metrics when making budget decisions.
Pro Tips
Do not just look at total conversion counts. Break down comparisons by campaign type, audience segment, and channel. Upper-funnel awareness campaigns will typically show larger discrepancies than lower-funnel retargeting campaigns, and knowing this helps you set appropriate expectations for each part of your strategy.
4. Use Multi-Touch Attribution to Credit the Full Journey
The Challenge It Solves
Last-click attribution is the default for most platforms, and it creates a deeply distorted picture of what drives revenue. It gives 100 percent of the credit to the final touchpoint before conversion, completely ignoring every ad, email, or content piece that built awareness and consideration along the way. This leads teams to over-invest in bottom-funnel channels and starve the upper-funnel activity that feeds the pipeline in the first place.
The Strategy Explained
Multi-touch attribution distributes conversion credit across every touchpoint in the customer journey rather than awarding it all to the last interaction. Common models include linear attribution, which gives equal credit to every touchpoint; time-decay attribution, which gives more credit to touchpoints closer to the conversion; and position-based attribution, which emphasizes the first and last touches while distributing the remainder across the middle.
The right model depends on your business and sales cycle, which we will cover in strategy six. But the core benefit of any multi-touch model is that it reveals channels and campaigns that are genuinely influencing conversions without getting the last-click credit. These undervalued channels are often where significant budget reallocation opportunities exist.
Cometly's multi-touch attribution lets you compare models side by side so you can see how credit shifts across your channels and make informed decisions about where to invest.
Implementation Steps
1. Map out your typical customer journey, including all the channels a prospect might encounter from first awareness to final conversion.
2. Select a multi-touch attribution model that aligns with your understanding of how each touchpoint contributes to the buying decision.
3. Run your historical conversion data through the model and compare the credit distribution to what last-click attribution shows.
4. Identify channels that gain significant credit under multi-touch models but receive little credit under last-click, and evaluate whether they are currently underfunded.
Pro Tips
Do not abandon last-click data entirely. Use it alongside multi-touch models to understand both closing efficiency and full-funnel influence. The combination gives you a more complete picture than either model alone.
5. Feed Better Conversion Data Back to Ad Platform Algorithms
The Challenge It Solves
Ad platform algorithms learn from the conversion signals you send them. If those signals are based on incomplete pixel data or include duplicate events, the algorithm optimizes toward the wrong behavior. You end up paying for traffic that looks like it converts based on noisy data, but does not actually generate revenue. Cleaning up your conversion signals is one of the highest-leverage improvements you can make to campaign performance. Teams dealing with this issue often struggle with poor ad attribution data undermining their optimization efforts.
The Strategy Explained
Once you have a third party attribution system capturing clean, deduplicated conversion events, you can use that enriched data to improve what you send back to ad platforms. This process, often called conversion sync, takes the accurate conversion events from your independent tracking system and pushes them back to Meta, Google, and other platforms to improve their targeting, lookalike audience modeling, and automated bidding.
Meta's Conversions API and Google's server-side tagging are both designed to support this workflow. When ad platform algorithms receive higher-quality signals, they get better at finding users who resemble your actual customers rather than optimizing toward anyone who fires a pixel event. This compounds over time: better signals lead to better targeting, which leads to higher-quality traffic, which generates more real conversions.
Cometly's Conversion Sync feature automates this process, sending enriched conversion events back to Meta, Google, and other platforms so their algorithms continuously improve based on your real revenue data.
Implementation Steps
1. Audit your current conversion events in each ad platform to identify duplicates, misfires, or events that do not correspond to actual revenue-generating actions.
2. Set up a clean conversion event feed from your third party attribution system that includes only verified, deduplicated conversions.
3. Connect this feed to each ad platform using their respective server-side APIs or conversion import tools.
4. Monitor event match quality scores in Meta Events Manager and Google's conversion diagnostics to confirm that the enriched data is being received and processed correctly.
Pro Tips
Include as much customer data as possible with each conversion event, such as hashed email addresses, phone numbers, and purchase values. Richer match data improves the platform's ability to match conversions back to the correct users and strengthens the quality of your audience signals.
6. Align Attribution Strategy with Your Sales Cycle and Funnel Complexity
The Challenge It Solves
A direct-to-consumer brand selling a 30-dollar product and a B2B SaaS company with a 90-day sales cycle have almost nothing in common when it comes to attribution. Using the same attribution windows and models for both scenarios produces misleading results. Many teams apply a one-size-fits-all approach and then wonder why their attribution data does not reflect reality. The fix is tailoring your setup to the actual shape of your customer journey.
The Strategy Explained
For short sales cycles, such as e-commerce purchases that typically happen within a few days of first exposure, tighter attribution windows make sense. A 7-day click window may be appropriate, and view-through attribution can be reduced or eliminated since the purchase decision happens quickly and is unlikely to span weeks of passive ad exposure. Understanding attribution window performance helps you calibrate these settings for maximum accuracy.
For longer B2B sales cycles, where a prospect might engage with your brand over several months before converting, you need longer attribution windows and multi-touch models that capture the full journey. A 30-day or 90-day window may be necessary to accurately credit the campaigns that initiated awareness or nurtured the prospect through the consideration phase. In these cases, connecting your CRM pipeline data to your attribution system becomes especially important, since the conversion event in your ad platform may be a form fill that happens months before the actual revenue closes. Companies in this space can benefit from dedicated SaaS marketing attribution tracking approaches.
Implementation Steps
1. Calculate your average sales cycle length using CRM data: the time from first known touchpoint to closed revenue.
2. Set attribution windows in your third party system that are long enough to capture the full cycle, with a buffer of at least 20 to 30 percent beyond your average.
3. Choose a multi-touch model that reflects how your buyers actually make decisions. Long B2B cycles often benefit from position-based or time-decay models that emphasize early and late touchpoints.
4. Segment your attribution analysis by product line or audience type if you sell to both short-cycle and long-cycle buyers, since mixing them produces averages that are accurate for neither group.
Pro Tips
Revisit your attribution window settings quarterly. As you scale into new channels or change your offer mix, your typical sales cycle length may shift. Attribution settings that were accurate six months ago may no longer reflect how your customers actually buy today.
7. Let AI Surface Optimization Opportunities Across All Channels
The Challenge It Solves
Even with clean, unified attribution data flowing through your system, the volume of information across multiple channels, campaigns, and audiences is too large for any team to analyze manually at the speed modern campaigns demand. By the time a human analyst identifies a budget reallocation opportunity, the window to act on it may have already closed. AI-powered analysis closes that gap by continuously processing your attribution data and surfacing actionable recommendations in real time.
The Strategy Explained
AI-driven attribution analysis goes beyond reporting. It identifies patterns across your channels that would be invisible in manual reviews: a campaign that performs well for new customer acquisition but poorly for retention, an audience segment that converts at a much higher rate when exposed to a specific ad sequence, or a channel that consistently assists conversions without ever getting last-click credit. Understanding what types of questions marketing attribution can answer helps you frame the right queries for AI analysis.
These cross-channel patterns become the basis for budget reallocation recommendations, creative testing priorities, and audience expansion strategies. The more unified and accurate your attribution data is, the more valuable these AI recommendations become. Garbage in, garbage out applies here: AI built on clean, deduplicated, multi-touch data produces insights that are genuinely actionable rather than misleading.
Cometly's AI Ads Manager and AI Chat are built on top of unified attribution data, allowing you to ask questions about your campaign performance in plain language and receive recommendations for where to shift budget, which ads to scale, and which campaigns to pause based on what is actually driving revenue.
Implementation Steps
1. Ensure your unified attribution data is clean and flowing consistently before activating AI analysis. AI recommendations are only as good as the underlying data.
2. Connect all active ad channels, your CRM, and your website to your attribution platform so the AI has a complete view of every touchpoint.
3. Define your primary optimization goal clearly: revenue, cost per acquisition, return on ad spend, or pipeline volume. This gives the AI a clear objective to optimize toward.
4. Review AI-generated recommendations on a regular cadence and implement high-confidence suggestions in controlled tests before applying changes at scale.
Pro Tips
Use AI chat features to interrogate your data with specific questions rather than waiting for automated recommendations. Asking "which campaigns are driving the highest-value customers based on CRM data" or "which channels have the best assisted conversion rate" often surfaces insights that standard dashboards would never highlight.
Your Implementation Roadmap
Navigating the gap between self attribution and third party attribution does not require choosing sides. It requires building a system where multiple data points work together to give you confidence in every budget decision you make.
Here is the order that makes the most sense for implementation. Start with strategy one by auditing your current platform attribution settings so you understand exactly where inflation is coming from. Then move immediately to strategy two and establish your independent tracking foundation with server-side technology. These two steps together give you the baseline you need for everything else.
Once clean data is flowing, layer in strategy three to build your side-by-side comparison process and quantify the discrepancy between platform-reported and independently tracked numbers. From there, implement strategy four to move beyond last-click attribution and understand the full customer journey. Strategy five then takes that clean data and feeds it back to ad platforms to improve their algorithms and targeting quality.
With a solid data foundation in place, apply strategy six to align your attribution windows and models to your specific sales cycle. Finally, activate strategy seven and let AI continuously surface optimization opportunities across all of your channels based on unified, accurate attribution data.
The goal is not to distrust every number or to abandon platform reporting entirely. It is to build a system where self attribution and third party attribution work together, each informing the other, so you stop guessing and start scaling based on what is actually driving revenue.
Ready to elevate your marketing game with precision and confidence? Discover how Cometly's AI-driven recommendations can transform your ad strategy. Get your free demo today and start capturing every touchpoint to maximize your conversions.