You've just closed a significant deal. The sales team is celebrating, the CRM is updated, and somewhere in your marketing stack, five different campaigns are quietly claiming credit for it. Sound familiar?
This is the daily reality for B2B SaaS marketers. Long sales cycles, multiple decision-makers, and a sprawling mix of channels make it nearly impossible to answer the one question that matters most: which campaign actually drove that deal? Without a clear answer, budget decisions become guesswork, and guesswork is expensive.
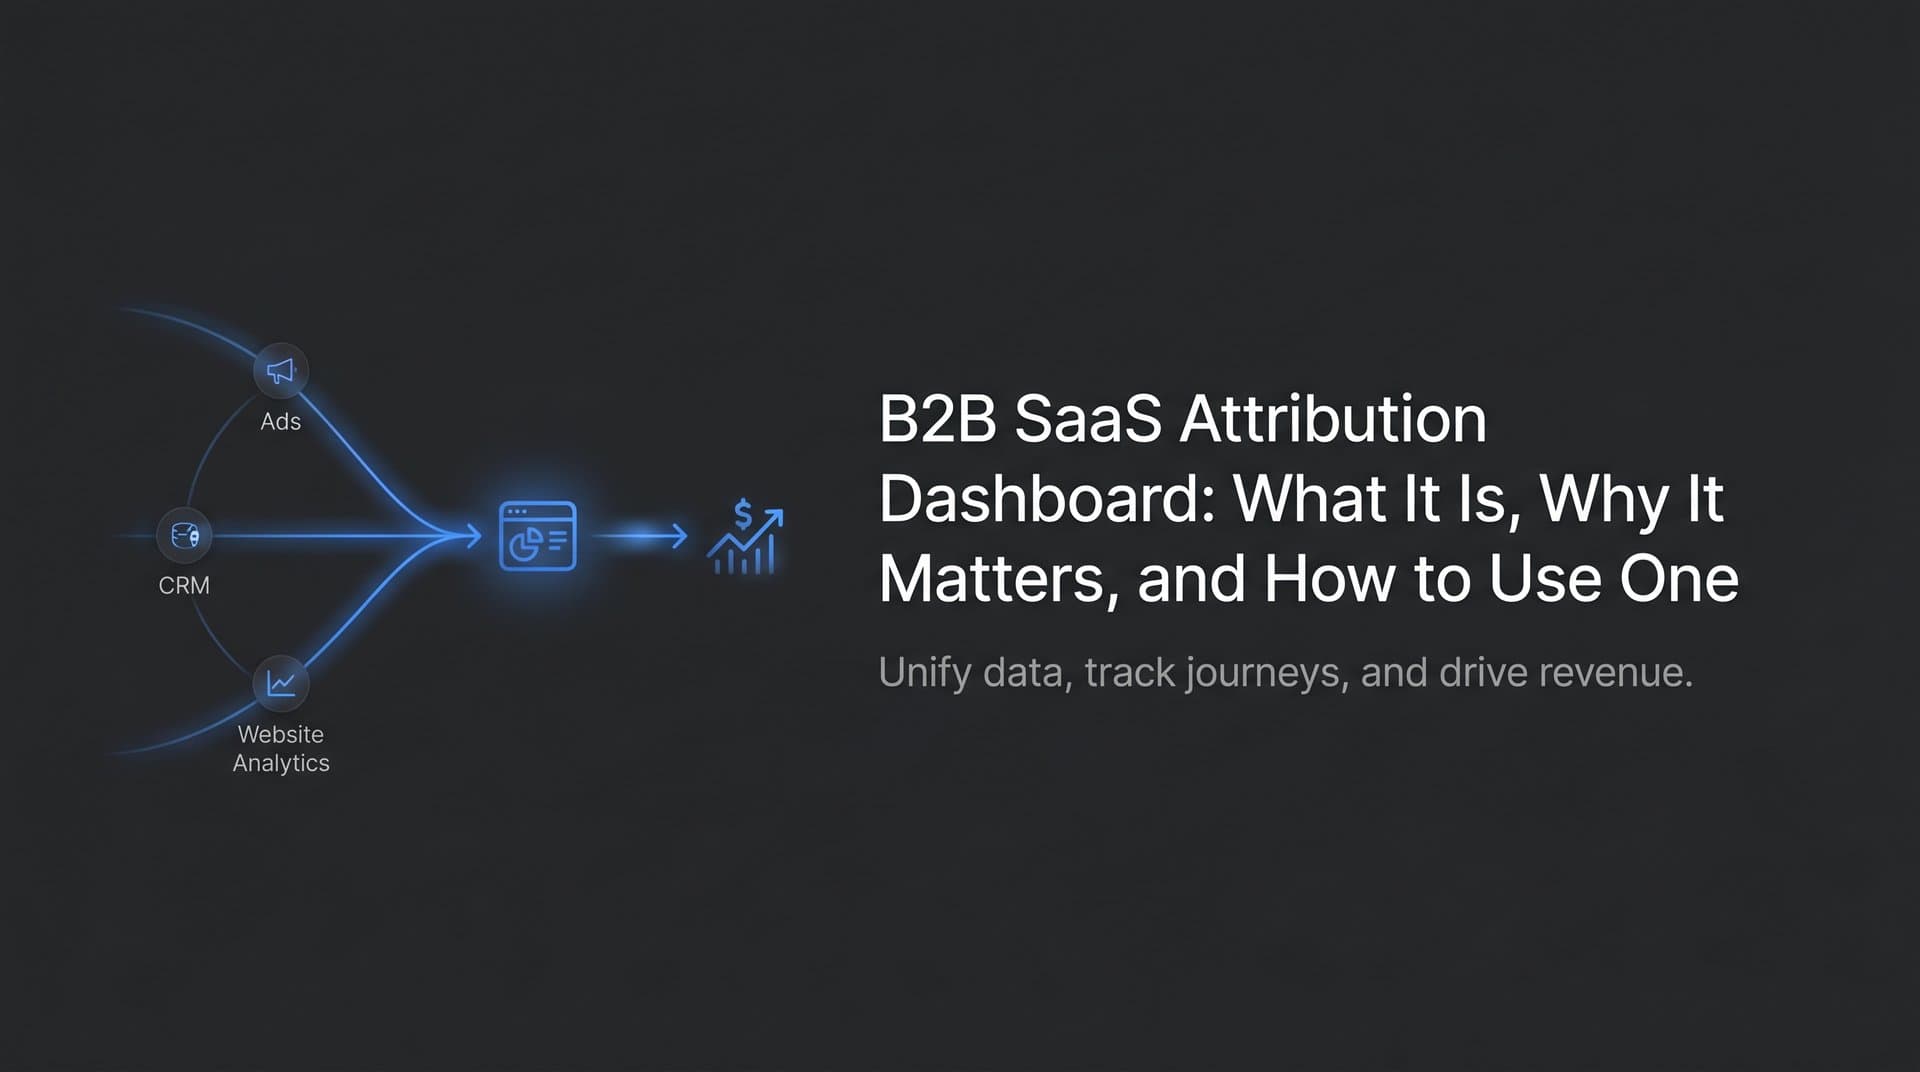
A B2B SaaS attribution dashboard changes that. It connects your ad spend to real revenue by pulling together data from your ad platforms, CRM, and website into a single, unified view of the customer journey. Instead of piecing together fragments from Google Ads, Meta, and your CRM separately, you see the full picture in one place.
This article breaks down exactly what a B2B SaaS attribution dashboard does, what separates a useful one from a frustrating one, which metrics actually deserve your attention, and how to put one to work in your day-to-day marketing operations. Whether you're evaluating tools for the first time or trying to get more value from your current setup, this guide gives you a practical framework to move forward with confidence.
Why B2B SaaS Marketing Creates a Unique Attribution Challenge
B2B SaaS buying decisions rarely happen in a straight line. A potential customer might discover your product through a LinkedIn ad, read a few blog posts over the following weeks, attend a webinar, get a referral from a colleague, click a retargeting ad, and finally book a demo after receiving a personalized email sequence. That entire journey could span two to four months, sometimes longer, and it often involves multiple stakeholders each touching different channels at different times.
This nonlinear, multi-stakeholder reality is what makes attribution so much harder in B2B SaaS than in B2C or e-commerce contexts. When a consumer buys a pair of shoes online, the journey from ad click to purchase might take minutes. When a procurement team evaluates a six-figure SaaS contract, the journey is a completely different animal. Understanding these SaaS marketing attribution challenges is the first step toward solving them.
Traditional analytics tools were not built for this complexity. Google Analytics, for example, gives you a view of website behavior but cannot connect that behavior to closed revenue in your CRM. Native ad platform reporting in Meta Ads Manager or Google Ads shows you clicks and conversions, but each platform measures independently and claims credit for the same conversions, creating a double-counting problem that inflates your apparent performance across the board.
The result is a fragmented picture where each tool shows you a piece of the journey but none of them show you the whole story. Marketing teams end up making budget decisions based on whichever channel shouts the loudest, rather than which channel genuinely drives revenue. This is a core reason attribution data doesn't match across platforms.
There is also a critical gap between the marketing-qualified lead stage and closed revenue. Many B2B SaaS teams track cost per lead and stop there, which means they optimize for lead volume without knowing whether those leads actually convert into paying customers. A channel that generates a high volume of cheap leads might look excellent on the surface while producing deals that churn quickly or never close at all. Meanwhile, a channel that generates fewer, higher-quality leads might appear underperforming by volume metrics alone.
Closing this gap requires connecting downstream CRM events, like opportunities created, deals closed, and revenue generated, back to the upstream ad spend and campaigns that started the journey. That connection is exactly what a purpose-built B2B SaaS attribution dashboard is designed to create.
What's Inside a B2B SaaS Attribution Dashboard
Understanding what a well-built attribution dashboard actually contains helps you evaluate whether a given tool will solve your specific problems. These dashboards are not simply prettier versions of your ad platform reports. They are purpose-built systems that unify data from multiple sources and apply attribution logic to give you a revenue-connected view of your marketing performance.
Cross-Channel Ad Performance Views: The foundation of any attribution dashboard is a unified view of performance across every paid channel you run. Instead of logging into Google Ads, Meta, LinkedIn, and YouTube separately, you see all campaigns side by side with consistent metrics, making apples-to-apples comparisons possible for the first time. This is the core value of unified dashboards for marketing and sales attribution.
Multi-Touch Attribution Models: A strong dashboard lets you apply and compare multiple attribution models simultaneously. First-touch attribution gives full credit to the channel that first introduced a prospect to your brand. Last-touch gives credit to the final interaction before conversion. Linear distributes credit equally across all touchpoints. Time-decay weights recent interactions more heavily. Each model tells a different story, and the ability to compare them side by side is where real insight lives.
Revenue-Connected Reporting: This is the feature that separates attribution dashboards from standard analytics tools. By integrating with your CRM, the dashboard ties pipeline created and deals closed back to specific campaigns, ad sets, and even individual ads. You can see not just which campaigns drove leads, but which ones drove revenue. For a deeper dive into this concept, explore how revenue attribution for B2B SaaS companies works in practice.
Server-side tracking plays a critical role here. Browser privacy restrictions, ad blockers, and the ongoing effects of iOS App Tracking Transparency have made client-side tracking increasingly unreliable. Server-side tracking bypasses these limitations by sending conversion data directly from your server rather than relying on a browser cookie or pixel. The result is more complete, more accurate data that gives your attribution models a stronger foundation to work from.
Conversion syncing is another component that sophisticated dashboards handle well. This is the process of sending enriched conversion events, including offline events like closed deals from your CRM, back to ad platforms like Meta and Google. When these platforms receive better quality conversion signals, their algorithms can optimize toward prospects who are more likely to become paying customers rather than just people who fill out a form. It is a feedback loop that improves targeting over time and makes your ad spend work harder without increasing the budget.
Five Metrics That Actually Matter on Your Dashboard
A dashboard full of numbers is not the same as a dashboard full of insight. Many B2B SaaS marketing teams spend time tracking metrics that feel important but do not connect to revenue outcomes. Here are the five metrics worth prioritizing. For a broader look at what to measure, review the essential metrics every SaaS company should care about.
Cost Per Acquisition at the Revenue Level: Cost per lead is a starting point, not a destination. What you really need is cost per acquisition measured at the closed-deal level, broken down by channel and campaign. This tells you what you actually paid to win a customer, not just to capture their contact information. Teams that optimize for this metric make dramatically better budget allocation decisions.
Return on Ad Spend Tied to Closed Deals: Native ad platform ROAS figures are almost always overstated because each platform counts conversions independently. A revenue-connected ROAS, calculated by dividing actual closed revenue attributed to a campaign by the spend on that campaign, gives you a number you can trust and act on.
Customer Acquisition Cost by Channel: Breaking CAC down by channel reveals which sources are efficient and which are draining budget. A channel with a high CAC might still be worth it if it attracts customers with strong retention and expansion revenue. But you cannot make that judgment without seeing CAC at the channel level in the first place. Dedicated SaaS customer acquisition attribution makes this level of granularity possible.
Pipeline Velocity by Source: Not all leads move through your funnel at the same speed. Pipeline velocity by source shows you which channels produce leads that close quickly versus which ones produce leads that stall in the pipeline for months. Channels with high velocity deserve attention even if their volume is lower, because faster-closing deals improve cash flow and reduce the cost of sales.
Blended vs. Isolated Channel Performance: Looking at any single channel in isolation is misleading. A channel that appears weak on last-click attribution might be doing significant work in the early stages of the buyer journey, warming up prospects who later convert through a different channel. Comparing blended multi-touch performance against isolated last-click performance reveals these hidden contributors and prevents you from cutting channels that are quietly doing important work.
The real power of comparing attribution models side by side is that it exposes channels that look strong on last-click but contribute little across the full journey, and vice versa. This kind of analysis is simply not possible in native ad platform reporting, which is one of the strongest arguments for investing in a dedicated attribution dashboard.
How to Evaluate and Choose the Right Attribution Dashboard
Not all attribution dashboards are built equally, and the wrong choice can leave you with a tool that adds complexity without adding clarity. Here is what to look for when evaluating options. If you are comparing solutions, a guide to the best marketing attribution tools for B2B SaaS companies is a great starting point.
Integration Depth: The single most important factor is how deeply the dashboard connects to your existing stack. It needs to pull data from every ad platform you run, sync with your CRM to capture pipeline and revenue data, connect to your website for behavioral tracking, and ideally integrate with your payment systems to capture actual revenue figures. A dashboard that requires manual data exports or relies on spreadsheet stitching to connect these sources will never give you a reliable picture. The integration needs to be native, automated, and real-time.
AI-Powered Recommendations: The best attribution dashboards do not just report what happened. They surface what you should do about it. AI-powered recommendation engines analyze your campaign data and identify optimization opportunities automatically, flagging underperforming ad sets, suggesting budget reallocations, and highlighting high-performing creative before you would have spotted these patterns manually. This is particularly valuable for marketing teams that manage campaigns across multiple platforms simultaneously and cannot spend hours each week manually analyzing performance data.
Real-Time Data Access: B2B SaaS campaigns move fast, especially in competitive categories. A dashboard that updates daily or with a significant lag means you are making decisions based on yesterday's reality. Real-time data access allows you to catch underperforming campaigns before they burn through budget and double down on high-performers while momentum is on your side.
Flexible Attribution Model Comparison: A dashboard that locks you into a single attribution model is not giving you the full picture. Look for tools that let you toggle between models and compare them side by side, so you can understand how credit is being distributed across your touchpoints. To understand the differences, read about single source attribution and multi-touch attribution models and how each one shapes your insights.
Ease of use also matters more than it might seem. A powerful tool that requires a data analyst to interpret is not practical for most marketing teams. The dashboard should surface insights in plain language, with clear visualizations that help non-technical stakeholders understand what the data is saying and why it matters.
Putting Your Attribution Dashboard to Work: A Practical Playbook
Having access to an attribution dashboard is only the beginning. Getting real value from it requires a deliberate approach to setup and ongoing use. Here is a practical framework for making it work.
Step 1: Connect All Your Data Sources First
Before you analyze anything, make sure every relevant data source is connected and flowing correctly. This means your ad platforms, your CRM, your website tracking, and any offline conversion data you have access to. Running attribution analysis on incomplete data produces incomplete insights, which can be just as misleading as having no attribution at all. Take the time upfront to verify that your integrations are capturing the events that matter, particularly the downstream CRM events like opportunity created, deal closed, and revenue amount. Following proven SaaS marketing attribution best practices during setup prevents costly mistakes later.
Step 2: Establish Baseline Metrics
Once your data is flowing, spend the first few weeks establishing baselines rather than making immediate changes. Understand what your current cost per acquisition looks like at the revenue level, which channels are contributing to pipeline, and how different attribution models distribute credit across your touchpoints. These baselines become your reference point for measuring the impact of future changes.
Step 3: Choose a Primary Attribution Model and Stick With It
While comparing models is valuable, you need a primary model to make consistent budget decisions. For most B2B SaaS teams with longer sales cycles and multiple touchpoints, a time-decay or linear model tends to reflect the buyer journey more accurately than last-touch alone. Choose your primary model, document why you chose it, and use it consistently so your performance comparisons over time are apples-to-apples.
Step 4: Set Up Regular Review Cadences
Attribution data is most useful when reviewed consistently. Build a weekly review of campaign-level performance and a monthly review of channel-level performance into your team's rhythm. The weekly review catches issues early. The monthly review reveals trends that inform larger strategic decisions about where to invest and where to pull back.
Step 5: Use Insights to Reallocate Budget in Real Time
The whole point of an attribution dashboard is to make smarter budget decisions. When your dashboard shows that a particular campaign is driving a high volume of leads that rarely close, reduce its budget and redirect that spend toward campaigns that are generating pipeline and revenue. This kind of real-time reallocation, guided by revenue-connected data rather than lead volume alone, is where attribution dashboards deliver their clearest return.
Step 6: Feed Better Data Back to Ad Platform Algorithms
Use your dashboard's conversion syncing capabilities to send enriched conversion events back to Meta, Google, and other ad platforms. When these platforms receive signals about which leads actually became paying customers, their algorithms can optimize bidding and targeting toward prospects who look like your best customers. Over time, this feedback loop improves the quality of traffic your campaigns attract, which compounds the value of your attribution investment. Reliable SaaS marketing attribution tracking is what makes this feedback loop possible.
Turning Attribution Data Into a Competitive Advantage
The shift from fragmented reporting to unified, revenue-connected attribution is not just an operational improvement. It is a genuine competitive advantage for B2B SaaS teams operating in crowded markets where every dollar of ad spend needs to justify itself.
When your competitors are making budget decisions based on last-click data from their ad platforms, and you are making decisions based on which campaigns actually drive closed revenue across the full buyer journey, you are playing a different game. You can afford to invest in channels that look expensive by surface metrics but deliver high-quality pipeline. You can cut channels that look efficient but rarely produce customers who stick around. And you can do all of this with confidence because your decisions are grounded in complete, accurate data rather than platform-reported estimates.
The first step is auditing your current attribution setup. Ask yourself: can you connect a closed deal in your CRM to the specific campaign that first introduced that customer to your brand? If the answer is no, or even maybe, you have a gap worth closing.
Cometly is built to solve exactly these challenges. It connects your ad platforms, CRM, and website into a single attribution view, applies multi-touch attribution models, uses server-side tracking for data accuracy, and surfaces AI-powered recommendations that help you act on insights without spending hours in spreadsheets. It is designed for B2B SaaS marketing teams who want clear, accurate data and the confidence to make decisions that scale their growth.
A B2B SaaS attribution dashboard is not a reporting tool. It is a decision-making engine. The teams that treat it that way are the ones that consistently outperform on return from their ad spend. Start by evaluating where your current tracking falls short, and then explore what a unified attribution platform can do for your growth. Get your free demo today and see how Cometly brings your full customer journey into focus, from first ad click to closed revenue.