If you are running paid ads, sending emails, and publishing content but still cannot answer "which channel actually drove this deal," you have an attribution problem. Marketing source attribution tracking is the process of connecting every lead, pipeline opportunity, and closed customer back to the specific source that started their journey.
For B2B SaaS companies, this is not a nice-to-have. It is the foundation of every smart budget decision you will make. Without it, you are allocating spend based on gut instinct rather than evidence.
This guide walks you through the exact steps to build a reliable marketing source attribution tracking system from the ground up. You will learn how to structure your UTM parameters, configure your tracking infrastructure, connect your ad platforms and CRM, choose the right attribution model for your business, and analyze the data to make confident decisions about where to scale.
Whether you are starting fresh or fixing a broken setup, these steps will help you build a single source of truth for your marketing performance. By the end, you will know which sources drive qualified leads, which channels convert to revenue, and where your ad spend is actually working.
Work through each step in order. The foundation you build in the early steps directly determines the accuracy of everything you analyze later. Skipping ahead to dashboards before your tracking infrastructure is solid is one of the most common mistakes B2B SaaS teams make.
Step 1: Define Your Conversion Events and Tracking Goals
Before you configure a single pixel or write a single UTM parameter, you need to know exactly what you are trying to measure. This sounds obvious, but many teams skip it and end up with attribution data that tracks the wrong things with great precision.
Start by identifying the specific events that matter most to your business. For most B2B SaaS companies, this means events like form submissions, demo requests, free trial signups, MQL handoffs to sales, and closed-won deals. Each of these represents a meaningful moment in your buyer's journey.
The critical next step is mapping each event to a funnel stage. Think of your conversion events as a chain: a visitor becomes a lead, a lead becomes an MQL, an MQL becomes an opportunity, and an opportunity becomes revenue. Your attribution system for B2B SaaS needs to track source influence at every link in that chain, not just the first one.
Here is why this matters. If you only track top-of-funnel events like page views or newsletter signups, you will have no visibility into which sources actually produce qualified pipeline. You might discover that a particular content channel drives hundreds of signups but zero closed deals. Without downstream tracking, you would never know.
You also need to decide which conversion events will feed back into your ad platforms as optimization signals. Ad platforms like Meta and Google use these signals to improve campaign targeting and bidding. Sending them only top-of-funnel events like all form fills gives them a noisy signal. Sending them qualified events like demo requests or trial activations gives them something meaningful to optimize toward.
Common pitfall: Teams often track only top-of-funnel events while ignoring downstream revenue events. This produces attribution data challenges that look complete but are actually misleading, because it tells you which sources drive volume without telling you which sources drive value.
Success indicator: You have a documented list of three to seven conversion events with clear definitions and funnel stage assignments. Each event is named consistently, and your team agrees on what qualifies as each event before any tracking is configured.
Step 2: Build a Consistent UTM Tagging System
UTM parameters are the backbone of marketing source attribution tracking. They are the small pieces of text you append to your URLs that tell your analytics platform exactly where a visitor came from and which campaign brought them there.
There are five UTM parameters, and each one captures a different dimension of your traffic source. utm_source identifies the platform, such as google, linkedin, or newsletter. utm_medium describes the channel type, such as paid-search, paid-social, or email. utm_campaign names the specific campaign or offer. utm_content identifies the specific ad or creative variant. utm_term captures the keyword for search campaigns.
For a paid LinkedIn campaign targeting a specific persona, a well-structured UTM string might look like this: utm_source=linkedin&utm_medium=paid-social&utm_campaign=q2-demo-request-vp-marketing&utm_content=carousel-ad-v2. Every element is descriptive, lowercase, and follows the same pattern your team uses across all campaigns.
That last point is where most teams run into trouble. Inconsistent naming is the silent killer of attribution data. Your analytics platform treats "LinkedIn" and "linkedin" as two completely separate sources. "Paid Social" and "paid-social" and "paid_social" are three different mediums in your reports. Spaces in UTM values break URLs entirely.
The solution is a shared UTM naming convention document that your entire team, including any agencies or contractors, uses before building any campaign link. This document should define the exact values allowed for each parameter and include examples for every channel type you run.
Several UTM tracking tools can help enforce standards. Google's Campaign URL Builder is a simple starting point. More advanced teams use spreadsheet-based builders that pull from a pre-approved list of values, making it harder for team members to introduce naming variations accidentally.
Practical tip: Audit your existing UTM data before moving forward. Pull a source and medium report from your analytics platform and look for variations of the same channel. Consolidating those variations into a clean naming convention is often one of the fastest ways to improve attribution accuracy without changing anything else in your setup.
Success indicator: Every campaign link in your ad platforms and email tools follows the same naming convention and is consistently lowercase. A new team member can build a correctly tagged URL on their first day using your naming convention document.
Step 3: Set Up Server-Side Tracking and Your Conversion API
Here is a reality that many marketing teams have not fully reckoned with: browser-based pixel tracking alone is no longer reliable enough to power accurate attribution.
Privacy-focused browser updates, ad blockers, and mobile operating system changes have significantly reduced how much data browser-side JavaScript can capture and transmit. When a visitor has an ad blocker installed or is browsing in a privacy-focused mode, your pixel may not fire at all. The result is conversion data with gaps you cannot see, which means your attribution is systematically undercounting the impact of your campaigns.
Server-side tracking solves this by sending conversion data directly from your server to ad platforms rather than relying on the visitor's browser to do the work. The data travels a more reliable path and is not subject to the same browser restrictions.
The two most critical server-side integrations for most B2B SaaS teams are the Meta Conversion API and Google Enhanced Conversions. Both allow you to send conversion events directly from your server or from a third-party marketing attribution platform, matching those events to user profiles using first-party data like email addresses and phone numbers.
Setting up server-side tracking involves three core components. First, you still place your standard tracking pixel on your website. Second, you configure server-side events that mirror your pixel events. Third, you connect those server-side events to each ad platform through their respective Conversion APIs.
One important technical detail: when you run both pixel tracking and server-side tracking simultaneously, you need to implement event deduplication. Without it, the same conversion can be counted twice, once from the browser pixel and once from the server-side event. Both Meta and Google provide deduplication mechanisms, typically using a shared event ID that you pass with both the pixel event and the server-side event. Matching IDs tell the platform to count only one conversion.
Match quality scores are your signal for how well this is working. In Meta Events Manager, match quality scores indicate how effectively your server-side events are being matched to user profiles. Higher match quality means the platform can use those events more effectively for optimization, which directly improves your campaign performance over time.
Success indicator: Your ad platforms are receiving server-side events with high match quality scores and your conversion data gaps have narrowed significantly. You can compare pixel-only data against server-side data and see that you are now capturing conversions that were previously going untracked.
Step 4: Connect Your CRM and Ad Platforms to Close the Revenue Loop
This is the step where most attribution setups either come together or fall apart. You can have perfect UTM tagging and reliable server-side tracking, but if your ad data and CRM data live in separate systems with no connection between them, your attribution stops at the lead level. You will know which sources drive form fills, but you will have no visibility into which sources drive pipeline and revenue.
The fix is connecting your CRM so that lead source data captured at the top of the funnel travels with the contact through every pipeline stage. When a visitor clicks a LinkedIn ad and fills out a demo request form, the UTM parameters from that click should be captured and stored as fields on the lead record in your CRM. From that point forward, every time that contact advances through your pipeline, the source data moves with them.
To make this work, you need to map your UTM parameters to specific CRM fields. Most CRMs allow you to create custom fields for source, medium, campaign, content, and term. Your website forms or tracking scripts capture the UTM values from the URL and pass them into those fields on form submission. This is a technical implementation step, but it is straightforward in most modern CRM and marketing campaign tracking software platforms.
Once your UTM data is stored on lead records, you can start reporting on source-level pipeline value and closed revenue. Instead of asking "which channel drove the most leads," you can ask "which channel drove the most qualified pipeline" and "which channel produced the highest close rate." Those are the questions that actually inform budget decisions.
Connecting your ad platforms to your attribution system adds another layer of value. When you can compare ad spend directly against pipeline and revenue by source, rather than just comparing spend against lead volume, you get a completely different picture of channel efficiency. A channel that looks expensive on a cost-per-lead basis might look extremely efficient on a cost-per-revenue basis.
This is also where cross-channel attribution ROI becomes powerful. Using your own CRM and conversion data to improve ad platform targeting and optimization gives those platforms better signals than they could collect on their own, which compounds the value of your attribution investment over time.
Success indicator: You can open any lead record in your CRM and see the original source, campaign, and ad that generated that contact. You can pull a pipeline report filtered by source and see the revenue value associated with each channel.
Step 5: Choose the Right Attribution Model for Your Business
Attribution models determine how credit for a conversion is distributed across the touchpoints in a buyer's journey. Choosing the right model is not a technical decision. It is a strategic one that shapes how your team understands and invests in each channel.
Here is a quick overview of the core models. First-touch attribution gives all credit to the first interaction a prospect had with your brand. Last-click attribution gives all credit to the final touchpoint before conversion. Linear attribution distributes credit equally across every touchpoint. Time decay attribution gives more credit to touchpoints that occurred closer to the conversion. Data-driven attribution uses algorithmic analysis to assign credit based on actual conversion path patterns rather than fixed rules.
For B2B SaaS companies with longer sales cycles, the model you choose has significant practical consequences. Last-click attribution tends to over-credit bottom-funnel demand capture channels like branded paid search and direct traffic, while under-crediting the awareness and nurture channels that actually started the journey. If you default to last-click and then cut your content or social programs because they do not show conversions, you may be eliminating the channels that were warming up your best prospects.
Multi-touch attribution models are generally more appropriate for complex B2B buying journeys that span multiple weeks and involve several touchpoints. They distribute credit in a way that reflects the reality that no single channel deserves full credit for a deal that took three months and eight interactions to close.
One of the most useful practices is comparing attribution models side by side. When you apply first-touch, last-click, and linear models to the same dataset, you can see how credit shifts across channels depending on the model. This exercise often reveals which channels are doing awareness work that last-click attribution was ignoring.
Common pitfall: Defaulting to last-click attribution and then cutting awareness channels that were actually driving pipeline. If a content program consistently appears as a first touch in multi-touch reports but never as a last touch, that is a signal it is contributing to pipeline even if last-click gives it no credit.
Success indicator: You have selected a primary attribution model and can articulate why it fits your sales cycle and go-to-market motion. You have also run a side-by-side model comparison at least once to understand how credit distribution changes across models.
Step 6: Build Your Attribution Dashboard and Analyze Source Performance
Your attribution data is only as valuable as your ability to read it quickly and act on it confidently. A well-designed attribution dashboard turns weeks of data collection into clear answers you can use in your next planning meeting.
An effective marketing attribution dashboard should show source-level pipeline, revenue by channel, cost per acquisition by source, and conversion rates by touchpoint. These are not vanity metrics. They are the operational data your team needs to make channel investment decisions with confidence.
The key questions your dashboard should answer include: which sources generate the most qualified leads, which channels convert most reliably to closed revenue, where is customer acquisition cost highest, and where are there gaps between lead volume and pipeline value. If your dashboard cannot answer these questions in under two minutes, it needs to be redesigned.
One of the most important shifts you can make is comparing spend against pipeline and revenue by source rather than comparing spend against lead volume. Lead volume is a proxy metric. Pipeline and revenue are the actual outcomes your business cares about. A channel that generates fewer leads but higher-quality pipeline is almost always a better investment than one that floods your CRM with unqualified contacts.
Look specifically for sources that generate high lead volume but low conversion to pipeline or revenue. These are the channels that look productive on the surface but are actually consuming budget without producing outcomes. Attribution data makes these patterns visible in a way that lead-count reporting never can.
AI-driven recommendations add another layer of value here. Patterns in attribution data can be difficult to spot manually, especially when you are managing multiple channels, campaigns, and audience segments simultaneously. AI analysis in marketing attribution can surface insights like which campaign combinations produce the highest pipeline conversion rates or which channels are showing early signs of performance decline before it becomes obvious in your numbers.
Success indicator: You can answer "which channel drove the most revenue last quarter" in under two minutes using your dashboard. You can also identify at least one underperforming source that is generating leads but not pipeline, and you have a plan to address it.
Step 7: Optimize Ad Spend Based on Attribution Insights
Attribution data is not just a reporting tool. It is an optimization engine. Once your system is running, the goal is to use what you are learning to continuously improve where your budget goes and how your ad platforms perform.
The most direct application is budget reallocation. When your attribution dashboard shows that one channel consistently produces qualified pipeline at a lower cost per acquisition than another, that is a signal to shift spend. You are not guessing based on platform-reported metrics or gut feel. You are following the data from ad click to closed revenue.
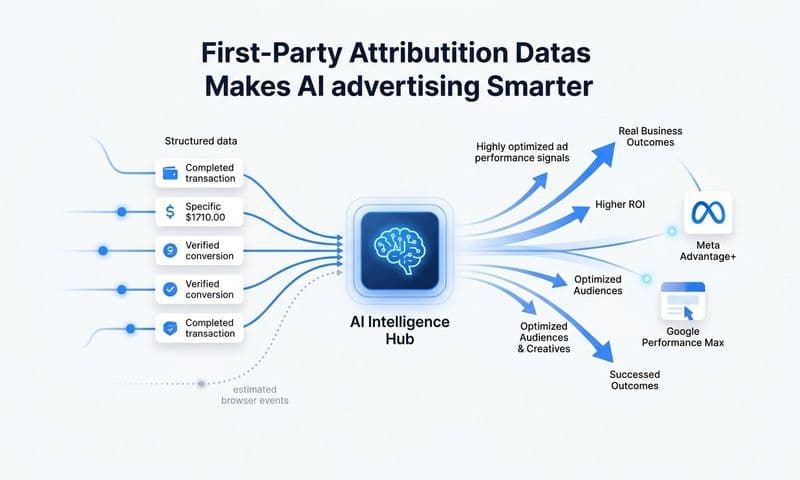
Feeding enriched conversion data back into your ad platforms is equally important. Ad platforms like Meta and Google use conversion signals to optimize campaign delivery, audience targeting, and bidding strategies. If you are sending them only top-of-funnel signals like all form fills, they are optimizing toward volume. If you send them revenue-level signals like qualified demo requests or closed-won deals, they optimize toward quality. That shift in signal quality can meaningfully change how your performance marketing campaigns perform over time.
The cadence for reviewing attribution data matters as much as the data itself. A practical review schedule for most B2B SaaS teams looks like this: weekly reviews for ad-level performance and creative testing, monthly reviews for channel-level budget decisions and source performance trends, and quarterly reviews for attribution model evaluation and overall go-to-market strategy alignment.
Source attribution data is also one of the most effective tools for aligning marketing and sales on channel investment. When you can show your sales team which channels are producing the highest-quality leads based on actual pipeline and close rate data, you create a shared language around what "good" traffic looks like. That alignment makes budget conversations much easier and more productive.
Success indicator: Your ad platform optimization is driven by revenue-level conversion events rather than all-form-fill signals. Your budget allocation decisions are backed by attribution data showing cost per acquisition and pipeline value by source, not by assumptions or platform-reported ROAS alone.
Putting It All Together: From Tracking Setup to Revenue Clarity
Marketing source attribution tracking is not a one-time project. It is an ongoing system that gets more valuable the longer you run it. The data compounds. Your attribution models improve. Your ad platforms get better signals. Your budget decisions get sharper.
Start with Step 1 and work through each step in order. Do not skip ahead to dashboards before your UTM structure and server-side tracking are solid. The foundation determines the accuracy of everything built on top of it.
Here is a quick-start checklist to confirm you have covered every layer of the system:
Conversion events defined: You have three to seven conversion events documented with clear definitions and funnel stage assignments.
UTM naming convention created: Your team has a shared naming convention document and every campaign link follows the same lowercase structure.
Server-side tracking configured: Meta Conversion API and Google Enhanced Conversions are active, event deduplication is in place, and match quality scores are strong.
CRM connected: UTM parameters are mapped to lead fields, and source data travels with contacts through every pipeline stage.
Attribution model selected: You have chosen a primary model that fits your sales cycle and run a side-by-side comparison to understand how credit shifts across models.
Dashboard built: Your attribution dashboard shows source-level pipeline, revenue by channel, and cost per acquisition by source.
Enriched signals feeding ad platforms: Revenue-level conversion events are flowing back into Meta and Google to improve algorithmic optimization.
When your attribution system is working, you stop guessing and start scaling with confidence. Cometly is built to power every step of this process for B2B SaaS teams, connecting your ad platforms, CRM, and website into a single attribution layer with real-time insights and AI-driven recommendations that surface what is actually driving your revenue.
Ready to build a marketing attribution system that connects every touchpoint to revenue? Get your free demo today and see how Cometly gives you the clarity to scale what works and cut what does not.