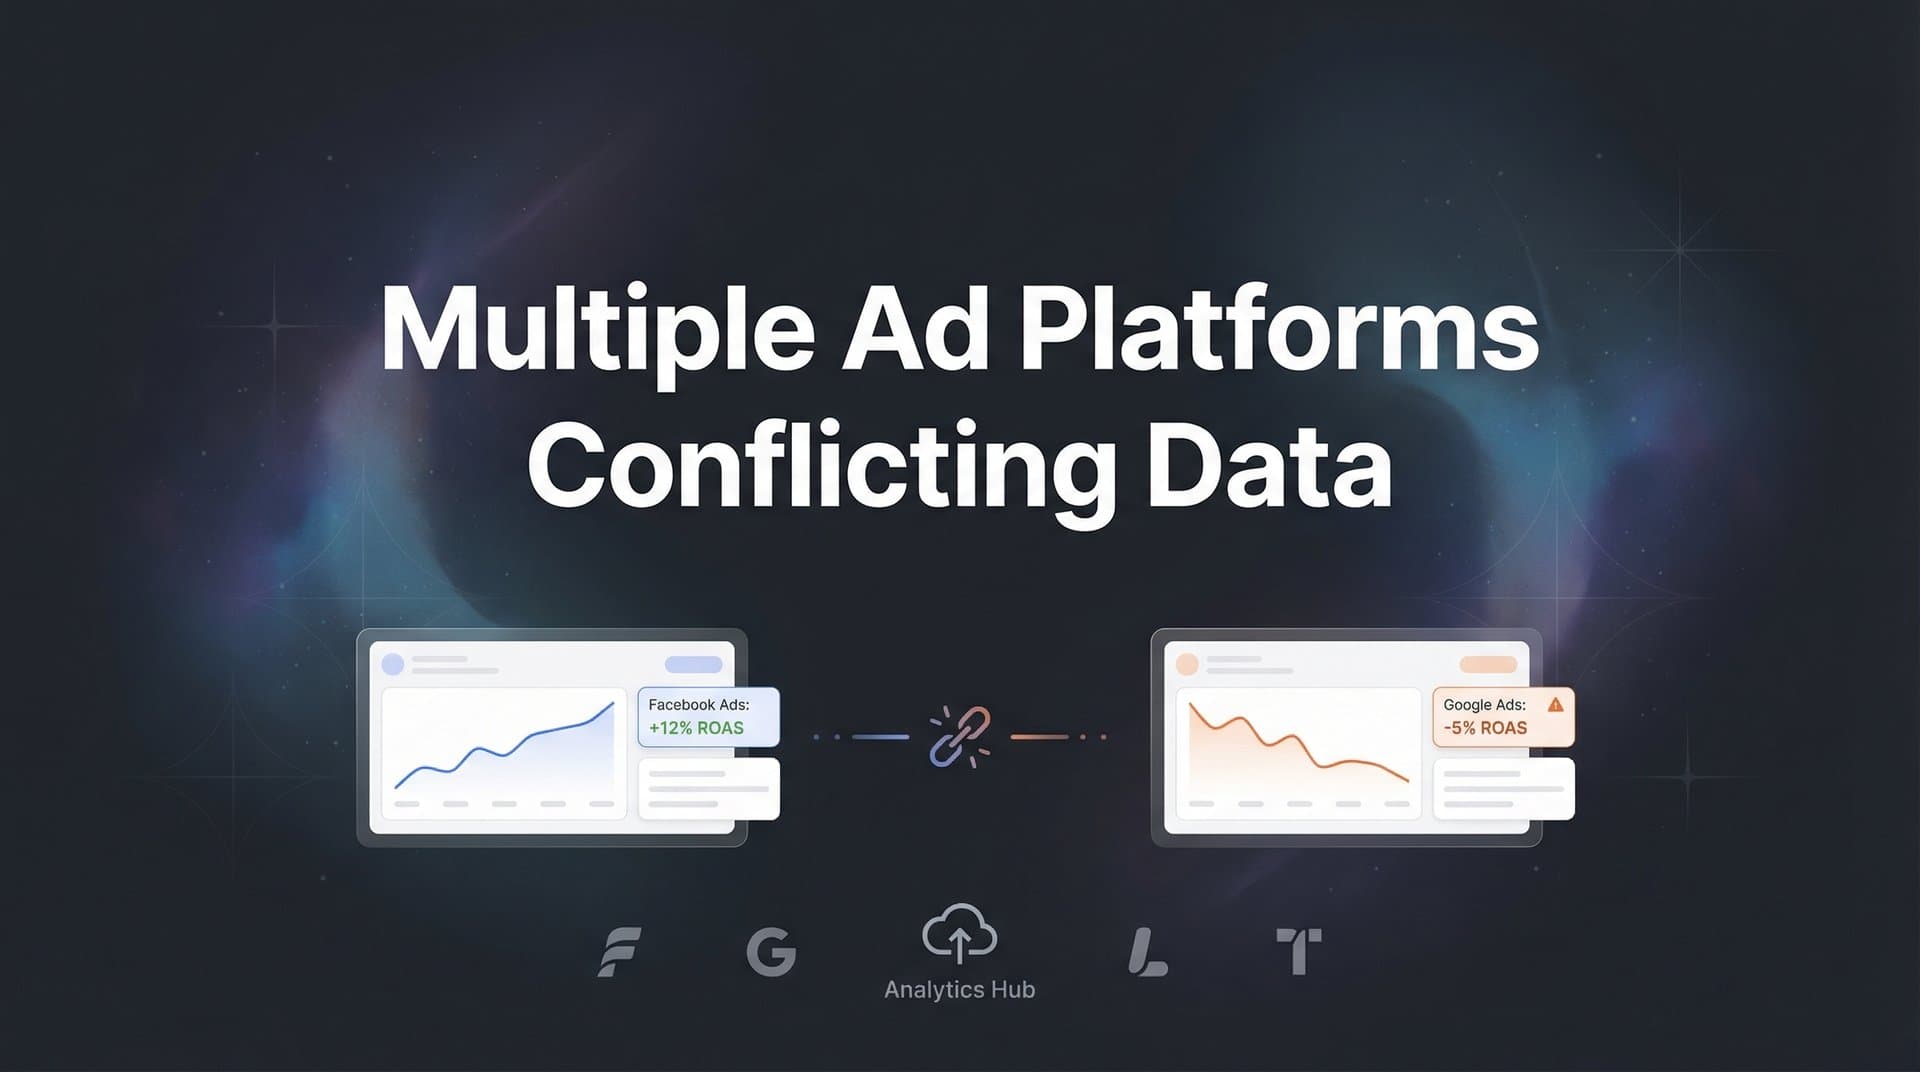
You check your Meta dashboard and see 47 conversions. Google Ads reports 62. TikTok claims 38. Meanwhile, your CRM shows only 51 actual sales.
Sound familiar?
Conflicting data across multiple ad platforms is one of the most frustrating challenges marketers face today. Each platform uses its own attribution logic, tracking methods, and conversion windows, which means they often take credit for the same conversion or miss touchpoints entirely.
This creates a messy picture where the numbers never add up, making it nearly impossible to know which campaigns actually drive revenue. You're left second-guessing every budget decision, wondering if you're scaling winners or throwing money at platforms that just happen to claim credit for conversions they didn't actually influence.
The good news: you can fix this.
This guide walks you through a systematic process to identify why your ad platforms show different numbers, reconcile the discrepancies, and build a unified view of your marketing performance. By the end, you'll have a clear framework for making confident budget decisions based on accurate data rather than platform guesswork.
Let's get your data sorted once and for all.
Step 1: Audit Your Current Tracking Setup Across All Platforms
Before you can fix conflicting data, you need to see exactly what's happening under the hood. Start with a complete inventory of every tracking code, pixel, and tag currently installed on your website.
Open your browser's developer tools and navigate to your site's key pages—homepage, product pages, checkout, and thank you page. Look at the network tab to see which tracking scripts are firing. You're looking for Meta Pixel, Google Ads conversion tags, TikTok Pixel, LinkedIn Insight Tag, and any other platform pixels you've installed.
Document everything you find. Create a simple spreadsheet with columns for the tracking code name, where it's installed, what events it tracks, and any notes about its configuration.
Now check for duplicates. This happens more often than you'd think, especially if multiple team members or agencies have touched your tracking setup over time. Duplicate pixels fire multiple times for the same action, artificially inflating your conversion counts within a platform.
Next, verify that conversion events are defined consistently across platforms. If Meta tracks a "Purchase" event when someone completes checkout, but Google Ads tracks it when someone reaches the thank you page, you're already setting yourself up for discrepancies. The timing difference of even a few seconds can cause platforms to attribute the same conversion differently.
Pay special attention to conversion values. If you're tracking revenue, make sure every platform receives the same dollar amount for the same transaction. Inconsistent values make it impossible to compare platform performance on a revenue basis.
Check your tag management system if you're using one like Google Tag Manager. Look for conflicting triggers that might fire the same conversion event multiple times or under different conditions. A common issue: one trigger fires on page load while another fires on a button click, causing double-counting.
Identify gaps where touchpoints might be missed entirely. Are you tracking form submissions? Phone calls? Chat conversations? Many marketers focus solely on e-commerce transactions while missing significant conversion actions that happen outside the typical checkout flow. Understanding multiple ad platforms tracking issues helps you anticipate where problems typically occur.
Success indicator: You should have a complete inventory of all tracking implementations with specific notes about any inconsistencies, duplicates, or gaps you've discovered. This becomes your baseline for everything that follows.
Step 2: Understand Why Each Platform Reports Differently
Here's the truth: ad platforms are designed to make themselves look good. They're not intentionally lying, but their attribution logic is built to maximize the credit they take for conversions.
Start by documenting the attribution window each platform uses by default. Meta typically uses a 7-day click and 1-day view attribution window, meaning they'll claim credit for conversions that happen within seven days of someone clicking an ad, or within one day of just viewing it. Google Ads defaults to a 30-day click attribution window. TikTok uses 7-day click and 1-day view, similar to Meta.
These different windows create immediate discrepancies. If a customer clicks your Google ad on Monday, then clicks your Meta ad on Tuesday, and converts on Wednesday, both platforms will claim that conversion. They're both technically correct based on their own attribution rules, but you can't have two 100% credits for the same sale.
The iOS 14.5 update changed everything. App Tracking Transparency made it much harder for platforms to track user behavior across apps and websites. As a result, browser-based pixels miss a significant portion of conversions, especially from iOS users who opt out of tracking. Many marketers are losing tracking data from cookies and privacy restrictions at an alarming rate.
To compensate, platforms introduced modeled conversions and statistical estimates. They use aggregate data and machine learning to estimate conversions they can't directly observe. While this helps fill gaps, it also means the numbers you see in your dashboard aren't always based on actual tracked events. They're educated guesses that can inflate reported conversions.
Attribution models add another layer of complexity. Meta might use data-driven attribution that distributes credit across multiple touchpoints, while Google Ads might use last-click attribution that gives 100% credit to the final ad interaction. TikTok might count view-through conversions where someone saw but didn't click your ad, then converted later.
Cross-device tracking compounds the problem. Someone might see your ad on their phone during their morning commute, research on their tablet during lunch, and purchase on their desktop at night. Each platform handles this journey differently. Some can connect these dots, others can't, and the ones that can often use proprietary methods that don't align with how other platforms track the same user.
Understanding these differences doesn't immediately solve your data conflicts, but it explains why they exist. Each platform operates in its own universe with its own rules, and they're all competing to prove their value to you. For a deeper dive into this challenge, explore how ad platform data discrepancies impact your marketing decisions.
Success indicator: You should be able to explain exactly how each of your ad platforms attributes conversions, including their attribution windows, how they handle cross-device journeys, and whether they use modeled data.
Step 3: Establish a Single Source of Truth for Conversions
If you want accurate data, you need to stop relying on platform pixels as your primary conversion tracking. Instead, establish your CRM or backend database as the authoritative source for what actually happened.
Your CRM knows the truth because it records actual business outcomes. When a sale completes, a lead enters your system, or a subscription activates, that's a real event tied to real revenue. Platform pixels might miss it, double-count it, or attribute it incorrectly, but your CRM has the facts.
Connect your CRM directly to your attribution tracking. This might mean setting up API integrations, implementing webhooks that fire when conversions happen, or using a unified attribution platform that pulls data from both your ad platforms and your business systems. A robust attribution data platform can centralize all this information automatically.
Server-side tracking is essential here. Unlike browser-based pixels that depend on cookies and can be blocked by privacy tools or browser settings, server-side tracking sends conversion data directly from your server to ad platforms. This captures conversions that browser tracking misses, giving you more complete data.
Implementing server-side tracking requires technical setup. You'll need to send conversion events from your backend when specific actions occur, like a completed purchase or a qualified lead. These events should include all relevant data: conversion value, user identifiers, and source information.
Create a unified conversion definition that applies across all platforms. Decide exactly what qualifies as a conversion for your business. Is it when someone completes checkout, when payment is processed, when you receive the order, or when you ship the product? Pick one definition and use it consistently everywhere.
UTM parameters become your best friend for accurate source tracking. Implement a consistent UTM structure across all your campaigns: utm_source for the platform, utm_medium for the ad type, utm_campaign for the campaign name, and utm_content for specific ad variations. When these parameters flow through to your CRM, you can definitively see which source drove each conversion.
The key is ensuring these UTM parameters persist through your entire conversion funnel. They should be captured when someone first lands on your site and associated with that user throughout their journey, even if they return later through a different source. Learn more about first party data tracking implementation to build a privacy-compliant foundation.
Set up conversion tracking that captures both the first touch and last touch attribution data in your CRM. This gives you flexibility to analyze performance from multiple angles without depending on platform-reported attribution.
Success indicator: You have a single database—whether it's your CRM, a data warehouse, or a unified attribution platform—that captures every conversion with accurate source attribution, independent of what ad platforms report.
Step 4: Map the Complete Customer Journey Across Touchpoints
Most conversions don't happen in a straight line. A customer might see your TikTok ad in the morning, click a Google search ad at lunch, engage with a Meta retargeting ad in the evening, and finally convert through a direct visit the next day.
Every platform in that chain will try to take full credit, but none of them tells the complete story.
Start mapping actual customer journeys by pulling data from your unified tracking system. Look at individual conversion paths to see every touchpoint that occurred before someone converted. You're building a timeline of interactions across all your marketing channels. Understanding multiple ad platforms attribution helps you see how credit should actually be distributed.
Identify patterns in how customers move through your funnel. You might discover that TikTok ads are great at introducing new audiences to your brand, Google search ads capture high-intent users actively looking for solutions, and Meta retargeting closes the deal for people who visited but didn't convert initially.
Understanding these patterns reveals which channels typically assist conversions versus which ones close them. An assist is any touchpoint that happened before the final conversion but contributed to the customer's decision. A closing touchpoint is the last interaction before conversion.
Multi-touch attribution distributes credit across the journey rather than giving 100% to a single platform. There are several approaches: linear attribution gives equal credit to all touchpoints, time-decay gives more credit to recent interactions, position-based gives more credit to the first and last touchpoints, and data-driven attribution uses machine learning to assign credit based on actual impact.
Choose an attribution model that aligns with your business reality. If you run long sales cycles where multiple touchpoints matter, time-decay or data-driven attribution makes sense. If you focus on direct response where the last click drives action, last-click attribution might work better. The point is to choose consciously rather than accepting whatever each platform decides.
Visualize these journeys. Create path analysis reports that show the most common sequences of touchpoints leading to conversions. You might discover that customers who see both a TikTok ad and a Google search ad convert at much higher rates than those who only interact with one platform.
This insight changes how you allocate budget. Instead of viewing platforms as competitors fighting for credit, you start seeing them as complementary channels that work together to drive conversions. Effective ad tracking across multiple platforms reveals these synergies.
Look for drop-off points where customers engage but don't convert. Maybe they click your ad, visit your site, but leave without taking action. Understanding where the journey breaks down helps you optimize both your ads and your website experience.
Success indicator: You can visualize the complete customer journey from first ad interaction through final conversion, with clear understanding of which channels typically introduce, nurture, and close customers.
Step 5: Reconcile Platform Data Against Your Source of Truth
Now that you have accurate conversion data from your CRM and understand the customer journey, it's time to compare what platforms report versus what actually happened.
Create a weekly reconciliation report. Pull conversion numbers from each ad platform for the same time period, then compare them against actual conversions recorded in your CRM or unified tracking system. Use the same conversion definition and time window for fair comparison.
Calculate the discrepancy ratio for each platform. If Meta reports 100 conversions but your CRM shows 75 conversions that actually came from Meta (based on UTM tracking), Meta is over-reporting by about 33%. Document this ratio because it reveals how much you need to adjust platform numbers to reflect reality.
Identify patterns in when and why discrepancies occur. You might notice that Meta's over-reporting increases during heavy retargeting campaigns because view-through attribution captures conversions that would have happened anyway. Or Google Ads might under-report because it misses conversions from users who clicked an ad on mobile but converted on desktop.
Look at discrepancies by campaign type, audience segment, and conversion action. Some campaigns might report more accurately than others. Prospecting campaigns that introduce new customers often have clearer attribution than retargeting campaigns where multiple platforms compete for credit on the same warm audience. A comprehensive marketing data analytics platform can automate much of this analysis.
Build adjustment factors to translate platform data into realistic expectations. If you know Meta consistently over-reports by 30%, you can mentally adjust their numbers when evaluating performance. This isn't perfect, but it's better than taking platform numbers at face value.
Document everything in a shared dashboard or spreadsheet that your team can reference. Include columns for platform-reported conversions, actual conversions from your source of truth, discrepancy percentage, and notes about why discrepancies might be occurring.
Set up alerts for unusual spikes or drops in discrepancy ratios. If Meta suddenly starts over-reporting by 60% instead of the usual 30%, something changed—maybe a tracking issue, a new campaign type, or a platform update that altered their attribution logic.
Review this reconciliation report in your weekly or monthly performance meetings. Make it a standard part of how your team evaluates campaign success. Over time, you'll develop intuition for interpreting platform data through the lens of what's actually happening in your business.
Success indicator: You have documented accuracy rates for each ad platform, showing exactly how much their reported numbers differ from verified conversions, with clear patterns identified for when and why discrepancies occur.
Step 6: Optimize Budget Allocation Based on Unified Data
This is where all your work pays off. With accurate, reconciled data, you can finally make budget decisions based on what actually drives revenue instead of which platform claims the most credit.
Start by analyzing true return on ad spend for each platform and campaign. Use your verified conversion data and actual revenue numbers, not platform-reported metrics. Calculate ROAS as (Revenue from verified conversions) / (Ad spend) for each channel. Platforms focused on marketing attribution platforms revenue tracking make this calculation straightforward.
You might discover that a platform reporting impressive numbers actually delivers mediocre results when you look at verified data. Or you might find that a channel you were considering cutting actually plays a crucial assist role that doesn't show up in last-click attribution.
Shift budget toward campaigns with verified performance. If your data shows that Google search ads consistently drive high-value customers with clear attribution, while TikTok over-reports conversions by 40%, you can confidently allocate more budget to Google and be more conservative with TikTok scaling.
Feed accurate conversion data back to ad platforms through server-side tracking and conversion APIs. When platforms receive better quality data about what actually converts, their algorithms can optimize more effectively. Learn how to properly feed conversion data back to ad platforms for improved campaign performance. This creates a positive feedback loop where your ads perform better because the platform's machine learning has accurate signals to work with.
Set up ongoing monitoring to catch new discrepancies as they emerge. Platform updates, iOS changes, and new tracking restrictions constantly shift the accuracy landscape. What works today might need adjustment next quarter.
Create budget allocation rules based on verified performance tiers. For example: channels with verified ROAS above 4x get increased budget, channels between 2x-4x maintain current spend, and channels below 2x get reduced budget or paused. These rules keep emotion out of budget decisions.
Test new channels with clear success criteria based on your source of truth data. When evaluating a new platform, don't just look at what they report in their dashboard. Track verified conversions and calculate actual ROAS from day one.
Success indicator: Your budget allocation decisions are driven by verified ROI data from your source of truth, not platform vanity metrics. You can confidently explain why you're spending more on certain channels based on actual business outcomes.
Putting It All Together: Your Data Reconciliation Checklist
Resolving conflicting data across multiple ad platforms isn't a one-time fix. It's an ongoing practice that requires consistent attention and refinement.
Start by auditing your tracking setup to understand what's currently installed and where inconsistencies exist. Then take time to understand why each platform reports differently—their attribution windows, modeling approaches, and tracking limitations all contribute to conflicting numbers.
Establish your CRM or a unified attribution tool as your source of truth, implementing server-side tracking to capture conversions that browser pixels miss. Map the complete customer journey across touchpoints so you understand how channels work together rather than viewing them as isolated performance metrics.
Regularly reconcile platform numbers against actual results, documenting discrepancy patterns and building adjustment factors. Finally, use that verified data to make smarter budget decisions that drive real business growth.
Here's your quick-start checklist to implement this week:
1. Audit all pixels and tracking codes currently installed on your site, documenting duplicates and inconsistencies.
2. Document each platform's attribution settings, including their attribution windows and modeling approaches.
3. Connect your CRM for server-side conversion tracking or implement a unified attribution solution.
4. Implement consistent UTM parameters across all campaigns to enable accurate source tracking.
5. Create a weekly reconciliation report comparing platform-reported conversions against verified data.
6. Review and adjust budgets monthly based on verified performance data rather than platform-reported metrics.
The difference between guessing and knowing is the difference between wasting budget on platforms that claim credit versus investing in channels that actually drive revenue. When you have unified, accurate data, every marketing decision becomes clearer and more confident.
Ready to stop guessing and start knowing exactly which ads drive revenue? A unified attribution platform can automate much of this reconciliation process, capturing every touchpoint from ad click to CRM conversion in one dashboard. Get your free demo today and discover how AI-driven recommendations can transform your ad strategy by showing you precisely which campaigns deserve more budget and which ones are just taking credit for conversions they didn't earn.