Paid media teams are under more pressure than ever to prove exactly what their ad spend is doing. Clicks and impressions no longer cut it. Growth leaders want to see pipeline, revenue, and customer acquisition tied directly to specific campaigns, channels, and even individual ads.
The problem is that most teams are still relying on fragmented data, last-click defaults, and platform-reported numbers that rarely match what shows up in the CRM. The result is a dangerous gap between what you think is working and what is actually driving revenue.
Marketing analytics for paid media teams closes that gap. When done right, it gives you a single source of truth across every channel, a clear view of the customer journey from first touch to closed deal, and the confidence to scale what works and cut what does not.
This guide covers eight practical strategies that high-performing paid media teams use to build a data-driven analytics foundation. Whether you are running campaigns on Meta, Google, LinkedIn, or TikTok, these strategies will help you track smarter, attribute accurately, and make faster decisions with real data.
1. Build a Unified Cross-Channel Data Foundation
The Challenge It Solves
If you are running paid campaigns across Meta, Google, LinkedIn, and TikTok at the same time, you have almost certainly experienced the frustration of conflicting attribution numbers. Each platform uses its own attribution window and counting methodology, which means they all claim credit for the same conversions. The result is inflated reporting and no clear picture of what is actually performing.
Manually reconciling these numbers in spreadsheets is time-consuming and still leaves you with unreliable data. You need one place where all of your channel data lives and speaks the same language.
The Strategy Explained
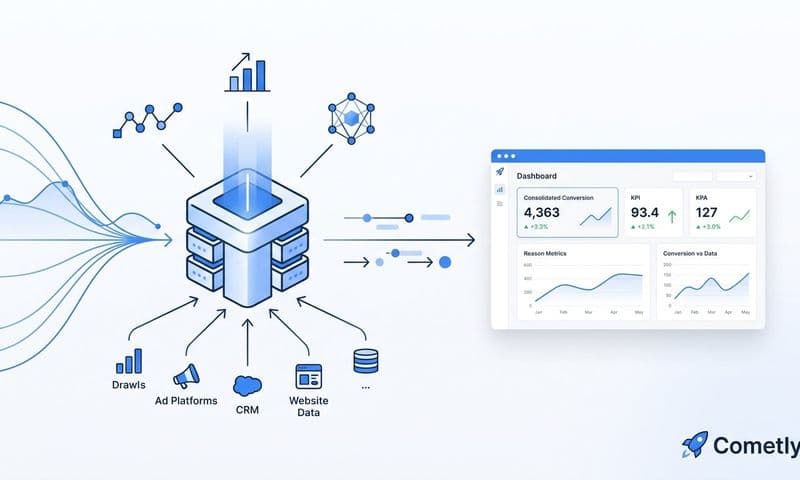
A unified cross-channel data foundation means connecting your ad platforms, CRM, and website into a single attribution system. Instead of toggling between platform dashboards and hoping the numbers add up, you have one consolidated view where every campaign, channel, and conversion is measured consistently.
This is not just about convenience. When your data lives in one place, you can make apples-to-apples comparisons across channels, identify where budget is underallocated, and stop making decisions based on whichever platform's dashboard you happened to open last. Understanding how to build this kind of system is covered in depth in this guide to choosing a marketing analytics platform that fits your team's needs.
Platforms like Cometly are built specifically for this purpose, offering 70+ native integrations that pull data from every major ad platform and connect it with your CRM and website events in real time.
Implementation Steps
1. Audit every active ad platform and data source your team currently uses, including CRM, website analytics, and any offline conversion sources.
2. Choose a central attribution platform with native integrations for each of your channels so data flows automatically rather than requiring manual exports.
3. Standardize your conversion definitions across platforms so that a "lead" or "trial signup" means the same thing regardless of which channel reported it.
4. Establish a consistent attribution window across all channels so comparisons are fair and meaningful.
Pro Tips
Do not try to build this foundation with a generic BI tool and manual data pipelines. The maintenance burden is significant and the data is always slightly stale. Purpose-built attribution platforms maintain integrations for you and update in real time, which means your team spends less time wrangling data and more time acting on it.
2. Move Beyond Last-Click and Choose the Right Attribution Model
The Challenge It Solves
Last-click attribution is still the default in many ad platforms and analytics tools. It assigns all conversion credit to the final touchpoint before a user converts, which sounds logical until you realize it completely ignores every interaction that happened before that last click. For B2B SaaS companies with sales cycles that span weeks or months, this creates a systematic blind spot around the channels and campaigns that actually build awareness and drive consideration.
If you are optimizing based on last-click data, you are likely underinvesting in channels that generate high-quality pipeline and over-crediting the final touchpoint that just happened to be there at the end. The most common attribution challenges in marketing analytics stem directly from this over-reliance on single-touch models.
The Strategy Explained
Multi-touch attribution models distribute conversion credit across multiple touchpoints in the customer journey. The most common models include linear (equal credit to all touches), time-decay (more credit to recent touches), U-shaped (heavy credit to first and last touch), W-shaped (credit to first touch, lead creation, and last touch), and data-driven (credit distributed based on actual conversion patterns).
For B2B SaaS teams with longer sales cycles, W-shaped and data-driven models tend to give the most accurate picture because they account for the key moments that move a buyer from awareness to decision.
Implementation Steps
1. Identify your average sales cycle length and the typical number of touchpoints before a deal closes, as this will inform which model fits your buyer journey.
2. Run your historical conversion data through multiple attribution models side by side to see how credit shifts between channels under each model.
3. Select the model that most accurately reflects how your buyers actually move through the funnel, not just the one that makes your current channels look best.
4. Revisit your attribution model quarterly as your channel mix and sales cycle evolve.
Pro Tips
Avoid switching attribution models frequently based on short-term performance swings. Pick a model that reflects your sales cycle, commit to it for a meaningful period, and use it consistently across your reporting so trends are actually comparable over time.
3. Implement Server-Side Tracking to Protect Data Accuracy
The Challenge It Solves
Browser-based pixel tracking has become increasingly unreliable. Apple's iOS 14.5 update introduced app tracking transparency that significantly reduced the signal available to pixel-based tracking. Ad blockers further degrade pixel accuracy for a meaningful portion of web traffic. The result is that a growing share of your conversions simply never gets reported back to the ad platforms, which means your optimization algorithms are working with incomplete data.
When your conversion data is inaccurate, your cost-per-acquisition numbers are off, your audience targeting degrades, and your campaign optimization decisions are built on a shaky foundation. Teams that rely on paid media analytics without addressing signal loss are making budget decisions on fundamentally incomplete information.
The Strategy Explained
Server-side tracking sends conversion event data directly from your server to the ad platform rather than relying on a browser pixel to fire. Meta's Conversion API and Google's Enhanced Conversions are the primary implementations of this approach. Because the data travels server-to-server, it bypasses ad blockers and is not affected by browser privacy restrictions.
This means more of your conversions get reported, your attribution data becomes more complete, and the ad platform algorithms have better signals to work with when optimizing for your target audience. Cometly's Conversion API integration makes it straightforward to implement server-side tracking without requiring heavy engineering resources.
Implementation Steps
1. Audit your current pixel setup and estimate the conversion signal loss you may be experiencing by comparing browser-reported conversions against CRM-recorded leads or signups.
2. Implement Meta's Conversion API and Google's Enhanced Conversions using your attribution platform's server-side integration rather than a custom build where possible.
3. Use event deduplication to ensure that conversions reported via pixel and server-side are not double-counted in platform reporting.
4. Validate your server-side setup by comparing reported conversion volumes before and after implementation to confirm signal recovery.
Pro Tips
Server-side tracking is most powerful when combined with first-party data enrichment. Sending enriched events with additional customer data, not just a basic conversion signal, gives the ad platform algorithms significantly better information to optimize against.
4. Track the Full Customer Journey, Not Just the Last Ad
The Challenge It Solves
B2B buying decisions rarely happen after a single ad interaction. A prospect might see a LinkedIn thought leadership ad, click a Google Search ad a week later, attend a webinar, and then convert on a retargeting ad a month after that. If you are only tracking the last ad they clicked, you have no visibility into the other three touchpoints that built the relationship and moved them toward a decision.
Without full journey visibility, you cannot identify which funnel stages are converting efficiently and which are leaking potential customers before they ever reach your sales team.
The Strategy Explained
Full customer journey tracking connects ad platform data, website behavior, and CRM events into a continuous record of every interaction a prospect has with your brand. This means you can see the exact sequence of touchpoints that preceded a closed deal, identify patterns across your highest-value customers, and understand which channels are contributing at each stage of the funnel.
The key is connecting your ad platforms to your CRM so that a deal in your pipeline can be traced back to the first ad that introduced the buyer to your brand, not just the last one they clicked before filling out a form. Understanding how to use data analytics in marketing at each stage of the journey is what separates teams that optimize for leads from those that optimize for revenue.
Implementation Steps
1. Define the key stages in your customer journey from first ad impression through to closed-won revenue, including any offline or sales-assisted touchpoints.
2. Implement tracking across each stage so that events in your ad platforms, website analytics, and CRM are connected by a consistent user identifier.
3. Map your existing customer data to identify the most common journey patterns among your highest-value customers.
4. Use journey analytics to pinpoint which stages have the highest drop-off rates and prioritize those for optimization.
Pro Tips
Pay close attention to the gap between marketing-qualified leads and sales-accepted leads. This transition point is where many B2B SaaS companies lose visibility. Connecting your ad data to CRM pipeline stages specifically around this handoff can reveal which campaigns are generating leads that sales actually wants to work with.
5. Connect Ad Spend Directly to Pipeline and Revenue
The Challenge It Solves
Cost-per-lead is one of the most widely used metrics in paid media, and one of the most misleading. A campaign that generates leads at a low cost per lead looks great on paper until you discover that none of those leads ever converted to paying customers. Optimizing for lead volume without connecting those leads to downstream revenue means you could be scaling the exact campaigns that are wasting budget.
This disconnect between marketing metrics and business outcomes is one of the most common reasons paid media teams struggle to earn budget and credibility with leadership. Teams that have solved this problem typically follow the approach outlined in this guide on how SaaS growth teams attribute revenue to marketing efforts.
The Strategy Explained
Revenue attribution connects your ad spend data directly to CRM pipeline stages and closed revenue so you can calculate true ROI at the campaign, channel, and even ad level. Instead of reporting cost-per-lead, you can report cost-per-pipeline-opportunity and cost-per-closed-deal, which are metrics that actually reflect business impact.
Cometly's pipeline and revenue attribution integrates with your CRM and payment data, including Stripe, to create a direct line between ad spend and revenue. This gives you the ability to show exactly which campaigns are generating deals that close, not just leads that go cold.
Implementation Steps
1. Connect your ad platform data to your CRM so that every lead or trial signup can be traced back to the campaign and channel that sourced it.
2. Map your CRM pipeline stages to your attribution reporting so you can track how leads from each campaign progress through the funnel.
3. Integrate your revenue data (CRM closed-won, Stripe, or your billing system) so that actual revenue can be attributed back to the originating campaign.
4. Build a reporting view that shows cost-per-opportunity and cost-per-closed-deal by campaign and channel alongside your traditional cost-per-lead metrics.
Pro Tips
When you first connect ad spend to revenue data, you will likely discover that your top-performing campaigns by lead volume are not always your top performers by revenue. This is a valuable and often uncomfortable insight. Use it to reallocate budget toward campaigns that generate revenue, not just leads.
6. Use First-Party Data Enrichment to Improve Ad Platform Signals
The Challenge It Solves
Ad platforms like Meta and Google optimize their delivery algorithms based on the conversion signals they receive from your campaigns. When those signals are incomplete, based on basic pixel fires with no additional context, the algorithms have less to work with and performance suffers. With third-party cookies being phased out across major browsers, the quality of the default conversion signal has been declining, which means ad platform optimization is becoming less effective for teams that have not adapted.
The Strategy Explained
First-party data enrichment means sending more than just a basic conversion event back to the ad platform. It means including additional context such as lead quality scores, opportunity stage, or actual revenue value alongside the conversion event. This gives Meta's and Google's optimization algorithms a richer signal to work with, which helps them find more of the right people rather than just more people who will fill out a form.
When you feed enriched, conversion-ready events back through server-side integrations, you are essentially teaching the algorithm what your best customers look like. Over time, this improves targeting accuracy and reduces wasted spend on low-quality audiences. The broader role of data science for marketing analytics is precisely this: turning raw signals into smarter optimization inputs.
Implementation Steps
1. Identify which first-party data points are most predictive of customer quality in your business, such as company size, job title, lead score, or opportunity value.
2. Configure your server-side event tracking to include these enrichment fields when sending conversion events back to Meta and Google.
3. Use conversion value optimization in your ad platforms so that algorithms can optimize for higher-value conversions rather than just conversion volume.
4. Monitor audience quality metrics over time to validate that enriched signals are improving the caliber of leads your campaigns generate.
Pro Tips
Start with revenue or opportunity value as your enrichment signal if you have it available. Telling the ad platform that a specific conversion was worth a certain dollar amount is one of the most direct ways to shift algorithm optimization toward your highest-value customer profiles.
7. Build Campaign Analytics Dashboards That Drive Decisions
The Challenge It Solves
Most paid media dashboards are built to report what happened, not to drive what should happen next. They surface impressions, clicks, and spend, but they do not clearly show which campaigns are generating pipeline, which channels have the lowest cost per acquisition, or where budget should be reallocated today. When your reporting is built around vanity metrics, decisions get delayed until the weekly review meeting instead of happening in real time.
The Strategy Explained
Decision-driven dashboards are structured around the questions your team needs to answer daily: Which campaigns are generating pipeline? Which channels have the best cost-per-acquisition? Where is budget being wasted? The metrics you surface should directly connect to budget allocation decisions, not just performance summaries. The best marketing analytics dashboard companies design their tools specifically around this decision-first philosophy.
Real-time dashboards in Cometly allow paid media teams to monitor performance across every channel in one view, with metrics organized by campaign, channel, and funnel stage. When something changes, your team sees it immediately and can act without waiting for a reporting cycle to complete.
Implementation Steps
1. Start by listing the five to seven questions your team needs to answer every day to make good budget decisions, and build your dashboard around those questions.
2. Prioritize metrics that connect to business outcomes: cost per pipeline opportunity, return on ad spend by channel, and revenue attributed by campaign.
3. Organize your dashboard by decision type, such as budget reallocation, creative performance, and audience efficiency, so team members can find what they need quickly.
4. Set up automated alerts for significant performance changes so your team is notified when a campaign is underperforming or outperforming expectations rather than discovering it in a weekly review.
Pro Tips
Resist the temptation to include every metric available. A dashboard with 40 metrics is not more useful than one with 10. The goal is to surface the data that drives decisions, not to display everything you can track. Fewer, more relevant metrics lead to faster and better decisions.
8. Use AI-Driven Insights to Scale What Works
The Challenge It Solves
As your paid media program grows across channels, campaigns, ad sets, and creatives, the volume of data becomes too large for manual analysis to handle effectively. A team managing dozens of active campaigns across four platforms cannot realistically review every data point and identify the patterns that predict high performance. Important signals get missed, budget stays in underperforming campaigns longer than it should, and scaling decisions get made on gut feel rather than data.
The Strategy Explained
AI applied to marketing analytics can surface patterns across large datasets that would take a human analyst hours or days to find. It can identify which creative elements correlate with higher conversion rates, which audience segments have the lowest cost per acquisition, and which campaigns are trending toward strong pipeline performance before the results are obvious in standard reporting. Exploring the power of AI marketing analytics shows how these capabilities are reshaping how paid media teams operate at scale.
Cometly's AI ads manager analyzes performance across every channel and provides recommendations for where to increase investment and where to pull back. It also feeds higher-quality data back into Meta's Advantage+ and Google's Smart Bidding algorithms, improving the performance of those systems by giving them better conversion signals to optimize against.
Implementation Steps
1. Ensure your data foundation is clean and unified before implementing AI-driven analysis. AI recommendations are only as reliable as the data they are built on.
2. Use AI to audit your current campaign portfolio and identify which campaigns are consistently generating pipeline versus which are generating activity without business impact.
3. Apply AI recommendations to creative testing by identifying which ad formats, messages, and visuals correlate with higher-quality conversions, not just higher click-through rates.
4. Feed enriched conversion data back to ad platform AI systems so that Meta Advantage+ and Google Smart Bidding have the signals they need to find your highest-value audiences.
Pro Tips
Think of AI as an analyst that works continuously across your entire dataset. The more complete and accurate your underlying data, the better the recommendations. This is why the earlier strategies in this guide, specifically unified data, server-side tracking, and revenue attribution, directly amplify the value you get from AI-driven insights.
Putting It All Together
Implementing all eight strategies at once is not realistic for most teams. Start with your data foundation and attribution model, because everything else builds on those two. Once you have clean, unified data flowing into one place, server-side tracking becomes more impactful, journey analytics become more accurate, and AI recommendations become more reliable.
The teams that win with paid media are not necessarily the ones with the biggest budgets. They are the ones who know exactly which campaigns generate real revenue, which channels are undervalued, and where to put the next dollar.
Here is a practical sequencing to guide your implementation:
Phase 1 (Foundation): Unify your cross-channel data and select the right attribution model for your sales cycle.
Phase 2 (Data Integrity): Implement server-side tracking and connect ad spend to pipeline and revenue in your CRM.
Phase 3 (Optimization): Build decision-driven dashboards, enrich your first-party data signals, and map the full customer journey.
Phase 4 (Scale): Layer in AI-driven insights to identify patterns at scale and continuously improve budget allocation.
Cometly is built to give paid media teams exactly this kind of clarity. It connects your ad platforms, CRM, and website data into a single attribution platform so you can track every touchpoint, analyze performance across channels, and make confident decisions backed by real data.
If your team is ready to move past guesswork and start scaling with precision, Get your free demo today and start capturing every touchpoint to maximize your conversions.