You're running campaigns across Meta, Google, LinkedIn, and email. Your dashboard shows clicks, impressions, and conversions. But here's what you're not seeing: the customer who clicked your Facebook ad last Tuesday, Googled your brand on Thursday, opened your email Friday morning, and finally converted through a direct visit on Monday. That's four touchpoints across five days—and if you're only tracking last-click attribution, you just credited "direct traffic" for a sale that actually started with paid social.
This is the reality for most marketing teams. Customers interact with your brand across dozens of channels before converting, yet your analytics only capture fragments of this journey. You're making budget decisions based on incomplete data, wondering why your "best performing" channels don't scale when you increase spend.
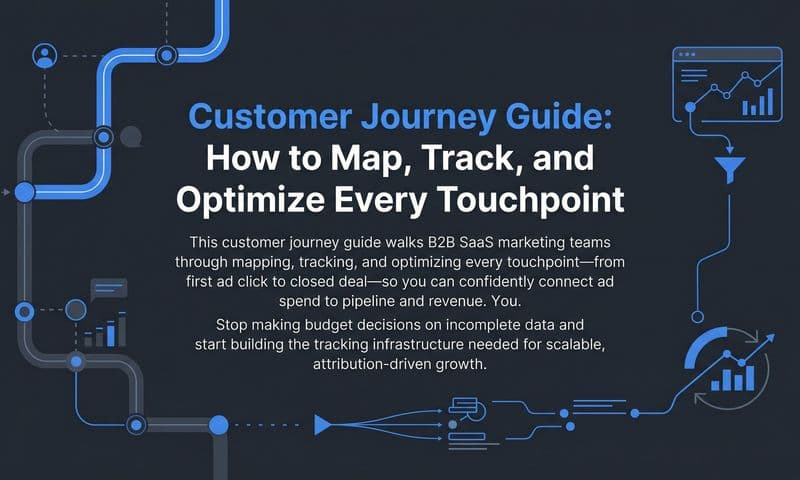
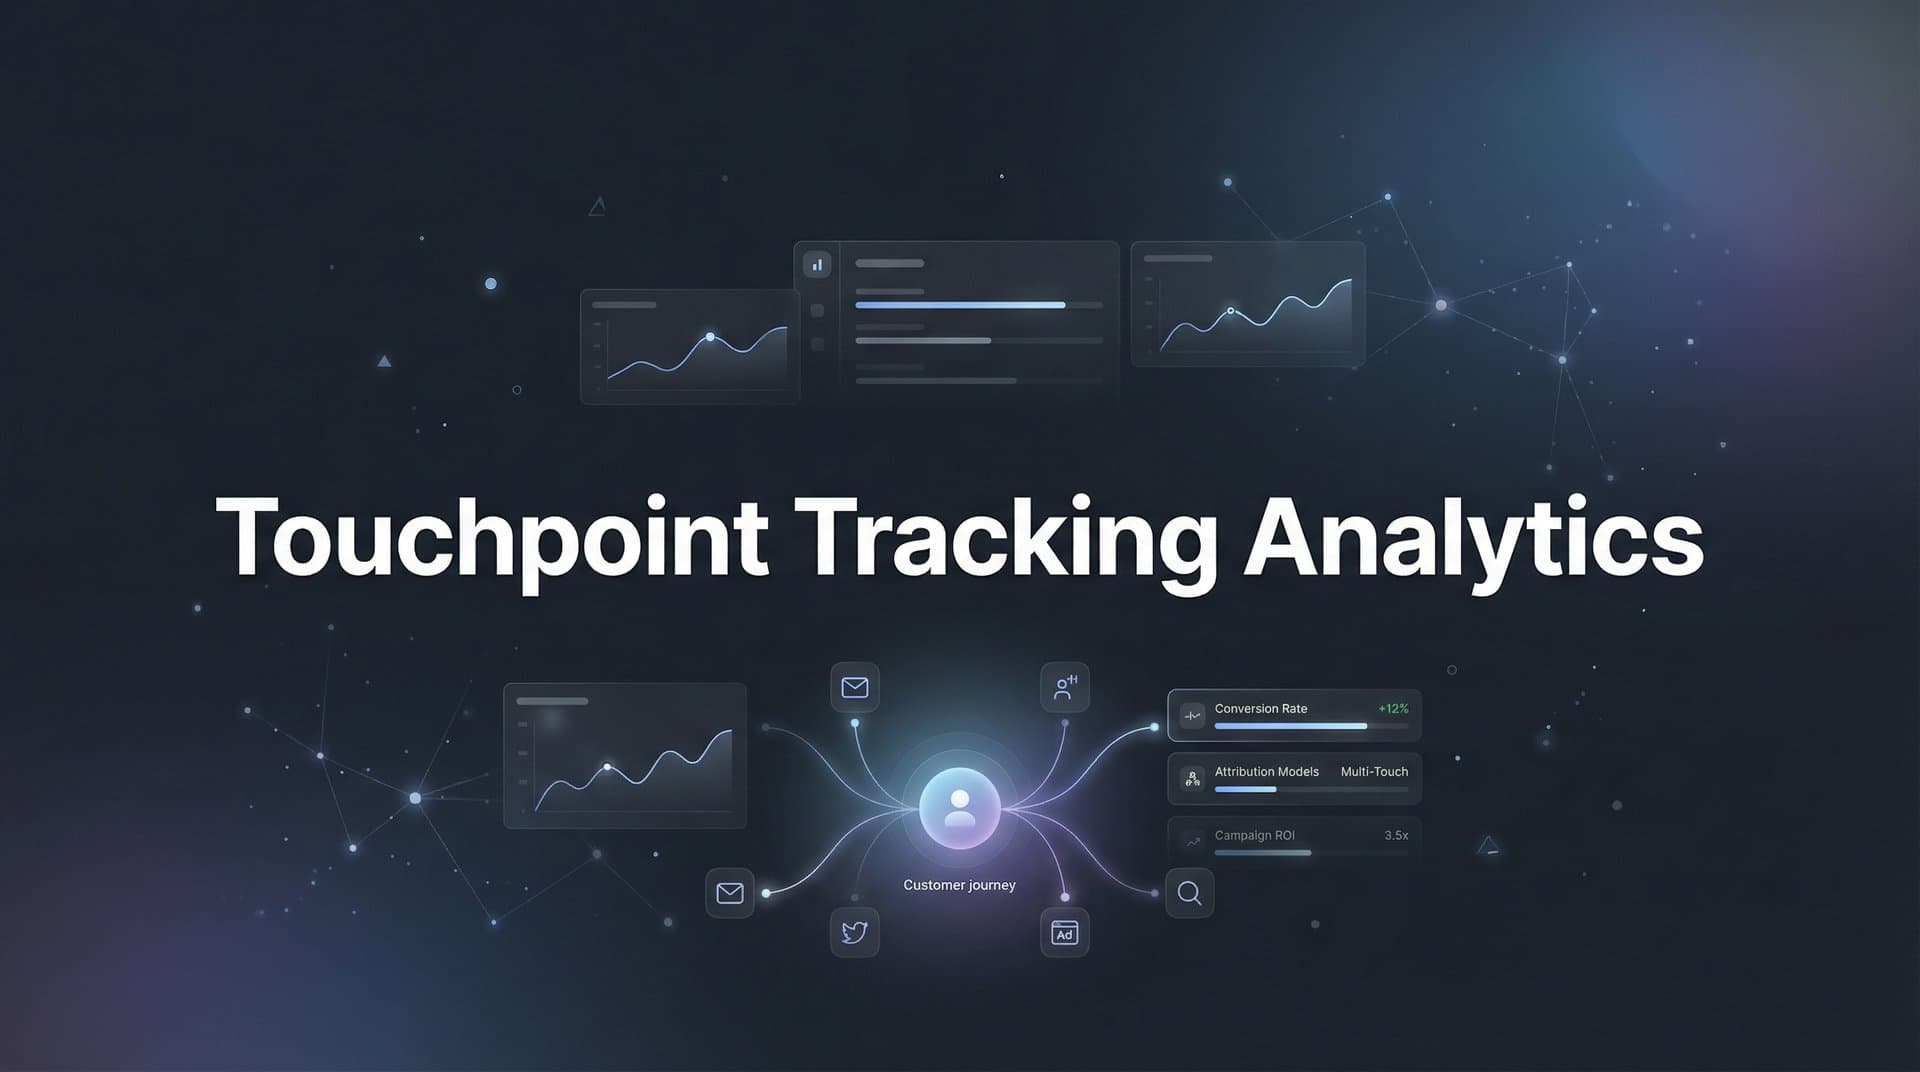
Touchpoint tracking analytics solves this problem by connecting these scattered interactions into a coherent picture of how customers actually find and choose you. It's the difference between seeing individual dots and understanding the complete constellation. By the end of this guide, you'll understand how to capture every touchpoint, analyze what's actually driving revenue, and make smarter marketing decisions based on the full customer journey—not just the last click before conversion.
Beyond Clicks and Conversions: How Touchpoint Tracking Actually Works
Touchpoint tracking analytics is the systematic collection and analysis of every customer interaction across channels—from the first ad impression to the final purchase and beyond. Unlike basic analytics that count pageviews and sessions, true touchpoint tracking connects these interactions to individual customer journeys, showing you exactly how someone moved from stranger to customer.
Think of it like this: basic analytics tells you 10,000 people visited your site this month. Touchpoint tracking tells you that Customer A saw your Facebook ad on January 3rd, clicked a Google search ad on January 8th, read three blog posts over two weeks, opened two emails, and finally converted on January 22nd after clicking a retargeting ad. That's the difference between aggregate numbers and actionable intelligence.
The technical foundation relies on several interconnected systems working together. Tracking pixels fire when someone visits your site or takes an action, creating a record of that interaction. UTM parameters in your URLs tell you which specific campaign, source, and medium drove each visit. Cookies store a unique identifier that helps connect multiple sessions from the same person. Server-side events capture conversions and send them to your analytics platform without relying solely on browser-based tracking.
Here's where it gets interesting: these technologies don't work in isolation. When someone clicks your ad, the UTM parameters in the URL tell your analytics platform which campaign they came from. A tracking pixel fires and sets a cookie in their browser. When they return three days later through organic search, that same cookie connects this new session to their previous visit. When they finally convert, a server-side event captures this conversion and attributes it back through their entire journey.
The key distinction is connection. Basic analytics sees these as separate events: one Facebook visit, one Google visit, one conversion. Touchpoint tracking sees them as a single journey: Customer 12345 interacted with your brand three times across two channels before converting. This connected view changes everything about how you evaluate performance.
Modern touchpoint tracking also captures events beyond website visits. When someone opens your email, attends a webinar, downloads a resource, or talks to sales, these become trackable touchpoints. When integrated with your CRM, you can see how marketing touchpoints influence pipeline and closed revenue, not just website conversions. Understanding event tracking in Google Analytics provides a foundation for capturing these micro-interactions.
The technical challenge is maintaining this connection across devices and sessions. Someone might see your ad on their phone during their commute, research on their laptop at work, and convert on their tablet at home. Advanced tracking uses probabilistic matching and deterministic identifiers to connect these cross-device interactions to the same customer journey.
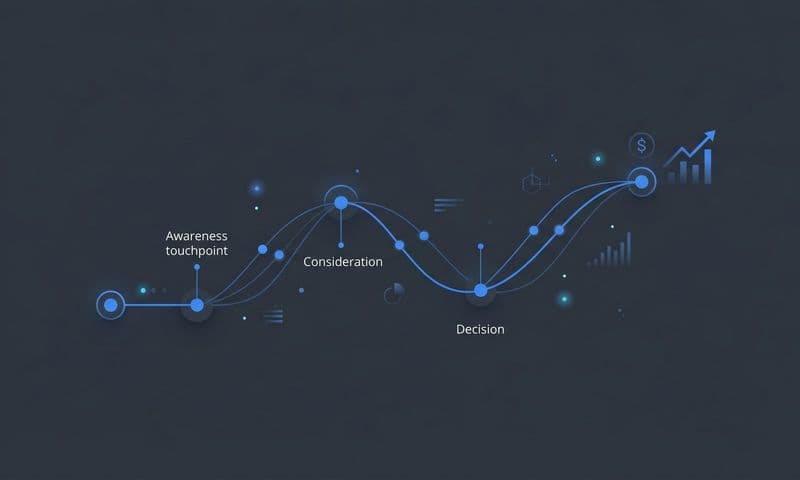
The Anatomy of a Modern Customer Journey
Let's map out what a real customer journey looks like in 2026. For a B2C e-commerce brand selling premium fitness equipment, a typical path might start with a Facebook ad showcasing a new product. The customer clicks through, browses for three minutes, but doesn't buy. Two days later, they Google "best home gym equipment" and click an organic search result to your blog post. They read it, check out your product pages, but still don't convert.
A week passes. They see a YouTube ad while watching workout videos. This time they click, add items to cart, but abandon at checkout. Your retargeting pixel fires, and three days later they see your Instagram ad. They click through, complete the purchase. Last-click attribution credits Instagram. But the real story involves five touchpoints across three weeks: Facebook discovery, Google research, blog education, YouTube consideration, and Instagram conversion.
B2B journeys are even more complex. Picture a marketing manager researching attribution software. They might see your LinkedIn ad, visit your site, read a comparison article, leave. A week later they Google "marketing attribution tools," find your site again through organic search, download a guide. Two weeks pass. They attend your webinar, share it with their team. A colleague Googles your brand name directly, requests a demo. The sales team nurtures them for a month. Finally, they convert into a customer.
That's at least eight touchpoints across six weeks, involving multiple people from the same company. Single-channel attribution would miss most of this journey entirely. Implementing Facebook touchpoint tracking helps capture those critical early-stage interactions that start these complex journeys.
Research shows the average B2B buyer now interacts with 27 pieces of content before making a purchase decision. For B2C, customers typically engage with a brand 3-7 times before converting. These aren't consecutive interactions—they're spread across days or weeks, across multiple devices and channels.
Here's what makes modern journeys particularly challenging: the rise of dark social. Someone sees your content on LinkedIn, screenshots it, shares it in a private Slack channel. A colleague clicks the link from Slack—your analytics sees this as "direct traffic" with no attribution to the original LinkedIn post. These invisible touchpoints represent a significant portion of how people actually discover brands, yet they're nearly impossible to track with traditional methods.
Cross-device behavior compounds the complexity. Morning research on mobile, afternoon comparison on desktop, evening purchase on tablet. Without proper cross-device tracking, these look like three separate customers with three separate journeys. In reality, it's one person moving through their natural device usage patterns.
The critical touchpoints most teams miss include: social shares that don't generate direct clicks, offline conversations triggered by online content, branded search that follows display ads, and email opens that precede direct website visits. These "invisible" touchpoints influence purchase decisions but rarely get credit in last-click models.
From Raw Data to Revenue Insights: Key Metrics That Matter
Once you're capturing touchpoints, the question becomes: what do you actually measure? The most revealing metric is time between touchpoints. If customers typically convert after three touchpoints spread over 14 days, and you see someone hit their third touchpoint on day 7, you know they're moving faster than average. This insight helps you identify high-intent prospects worth prioritizing.
Channel sequence patterns reveal which combinations drive conversions. You might discover that customers who start with paid search and then engage with email convert at 3x the rate of those who start with social and then visit directly. This isn't about which channel is "better"—it's about understanding which sequences work together effectively.
Touchpoint frequency before conversion tells you how many interactions customers need before they're ready to buy. If your data shows the average converter engages seven times, but you're only nurturing people through three touchpoints, you're giving up too early. Conversely, if someone has engaged 15 times without converting, they might need a different approach or simply aren't a fit.
Drop-off points identify where your journey breaks down. Maybe 40% of people who engage with three touchpoints never reach a fourth. What happens at that stage? Are you failing to retarget effectively? Is there a natural pause in the buying cycle? Understanding where momentum stalls helps you fix the gaps.
Here's the critical distinction: touchpoints that influence versus touchpoints that close. Your Facebook ads might generate awareness and start journeys, but rarely close deals directly. Your retargeting campaigns might be the final push that converts people who were already considering a purchase. Both matter, but they serve different roles in your strategy. Learning about channel attribution in digital marketing helps you understand these distinct roles.
Influence metrics show you which channels start journeys and keep them moving. These are your top-of-funnel and mid-funnel drivers. Closing metrics show you which channels get credit for the final conversion. Smart marketers optimize for both—you need channels that attract and educate, and channels that convert and close.
This is where attribution models come into play. First-touch attribution gives all credit to the initial interaction—useful for understanding what's driving awareness. Last-touch attribution credits the final touchpoint—helpful for seeing what closes deals. But neither tells the complete story.
Linear attribution splits credit equally across all touchpoints. If someone had five interactions before converting, each gets 20% credit. This works well for short sales cycles where every touchpoint matters roughly equally.
Time-decay attribution gives more credit to recent touchpoints, assuming interactions closer to conversion had more influence. This makes sense for longer sales cycles where early touchpoints might have less impact on the final decision.
Position-based attribution (also called U-shaped) gives 40% credit to the first touchpoint, 40% to the last, and splits the remaining 20% among middle interactions. This recognizes that both starting and closing the journey matter most.
Which model should you use? It depends on your business. E-commerce with short sales cycles might prefer last-touch or time-decay. B2B SaaS with long sales cycles benefits from position-based or custom models that weight demo requests and sales conversations heavily. The key is choosing a model that reflects how your customers actually make decisions, not just defaulting to whatever your analytics platform uses by default. Our guide on attribution tracking methods breaks down each approach in detail.
Building Your Touchpoint Tracking Infrastructure
Setting up comprehensive touchpoint tracking requires four core components working together. First, you need unified tracking across all your ad platforms—Meta, Google, LinkedIn, TikTok, wherever you run campaigns. Each platform has its own pixel or tracking code, and all of them need to fire correctly on your website and pass data back to both the platform and your central analytics hub.
Second, you need CRM integration. When a lead converts, that conversion data should flow into your CRM alongside all their touchpoint history. When that lead becomes a customer and generates revenue, that revenue data should flow back to your analytics platform so you can calculate true ROI, not just cost per lead.
Third, you need comprehensive website event tracking. Beyond pageviews, you should track specific actions: button clicks, form submissions, video plays, scroll depth, time on page. These micro-conversions reveal engagement and intent even before someone converts.
Fourth, you need a central analytics hub that connects all these data sources. This is where individual touchpoints become connected journeys. Your hub should show you the complete path from first interaction to final conversion, with all the steps in between. Evaluating the best marketing analytics software for revenue tracking helps you select the right platform for your needs.
Here's where the technical landscape has shifted dramatically: iOS privacy changes and cookie deprecation have made browser-based tracking increasingly unreliable. When iOS users opt out of tracking, traditional pixels can't follow them across sites. When browsers phase out third-party cookies, your ability to track returning visitors diminishes.
Server-side tracking provides the solution. Instead of relying entirely on browser-based pixels, you send conversion data directly from your server to ad platforms and analytics tools. When someone converts on your site, your server captures this event and sends it to Meta, Google, and your analytics platform through secure APIs. Understanding the differences between Google Analytics vs server-side tracking is essential for making the right infrastructure decisions.
The advantage is accuracy and persistence. Server-side events aren't affected by ad blockers, iOS privacy settings, or cookie restrictions. You're sending verified conversion data directly from your infrastructure, not relying on a pixel in someone's browser that might be blocked or deleted.
This matters for more than just tracking—it directly impacts campaign performance. Ad platforms like Meta and Google use conversion data to optimize their algorithms. When you send them accurate, complete conversion data through server-side tracking, their AI can better identify which audiences and placements drive results. This creates a virtuous cycle: better data leads to better optimization, which leads to better results.
The technical implementation requires coordination between your development team, marketing team, and analytics platform. You'll need to set up server-side tracking endpoints, configure event parameters, test data flow, and ensure everything maps correctly to your attribution model. A proper attribution tracking setup ensures all these components work together seamlessly. It's more complex than dropping a pixel on your site, but the data quality improvement makes it worthwhile.
Turning Touchpoint Data Into Smarter Marketing Decisions
Once your tracking infrastructure is running, the real work begins: using this data to make better decisions. Start by identifying underperforming channels that actually contribute to conversions. Your display ads might have terrible last-click conversion rates, but when you look at their assist value—how often they appear earlier in converting customer journeys—you might discover they're critical for starting high-value paths.
Let's say your data shows that 60% of customers who eventually convert through paid search had a prior touchpoint with your display campaign. Those display ads aren't "failing"—they're doing exactly what they should: creating awareness that leads to higher-intent search behavior later. Without touchpoint tracking, you might have cut that display budget. With it, you recognize its strategic value.
Budget reallocation becomes strategic rather than reactive. Instead of simply increasing spend on channels with the best last-click ROI, you allocate based on true touchpoint contribution. Maybe your email campaigns have mediocre direct conversion rates, but they're present in 80% of customer journeys as a middle touchpoint. That's not a channel to cut—it's a channel to optimize for its actual role in the journey.
The framework is simple: identify which channels start journeys (awareness drivers), which channels keep them moving (engagement drivers), and which channels close deals (conversion drivers). Then allocate budget accordingly. You need all three types working together. Cutting awareness drivers because they don't close deals directly is like firing your sales development reps because they don't close enterprise contracts—they're not supposed to.
Here's where AI-powered analysis transforms the game. Human analysts can spot obvious patterns: paid search converts well, social media assists frequently. But AI can surface patterns that would take weeks of manual analysis to discover. It might identify that customers who engage with a blog post, then see a retargeting ad within 48 hours, then receive an email within 72 hours of that ad view convert at 5x the average rate. Discovering how data analytics can improve marketing strategy reveals these hidden optimization opportunities.
That's an actionable insight. You can now build automated workflows that trigger these sequences. When someone reads a blog post, add them to a custom audience for retargeting. When they see that retargeting ad, trigger an email sequence. You've just engineered a high-converting touchpoint sequence based on what your data revealed about successful customer journeys.
AI can also identify diminishing returns thresholds. Maybe your data shows that customers who engage with 3-5 touchpoints convert at a healthy rate, but those who need 8+ touchpoints before converting have much lower lifetime value and higher churn rates. This insight helps you set budget caps—you're willing to nurture someone through five touchpoints, but beyond that, the ROI drops too low to justify continued spend.
The most sophisticated use of touchpoint analytics is predictive scoring. By analyzing thousands of customer journeys, AI can identify which early-stage touchpoint patterns most reliably predict eventual conversion. Someone who visits your pricing page, then reads a case study, then requests a demo has a 70% conversion probability. Someone who bounces from three blog posts without deeper engagement has a 5% probability. This lets you prioritize high-probability leads and deprioritize low-probability ones before wasting budget on extensive nurture campaigns.
The Path Forward: From Data Collection to Marketing Intelligence
Touchpoint tracking analytics transforms marketing from guesswork into a data-driven discipline. But here's what matters most: the goal isn't collecting more data. You don't win by having the most touchpoints tracked or the most complex attribution model. You win by connecting the dots to understand what actually drives revenue, then acting on that understanding faster than your competitors.
The marketers who master touchpoint tracking will outcompete those still relying on fragmented channel data. While your competitors are cutting budgets on channels with poor last-click attribution, you'll recognize their true contribution to the customer journey. While they're blindly scaling what appears to be working, you'll understand which touchpoint sequences actually convert and engineer more of them.
This isn't about perfection. Your tracking will never capture every single interaction. Dark social, offline conversations, and cross-device behavior will always have gaps. But 80% visibility into the customer journey is infinitely better than the 20% you get from last-click attribution. The competitive advantage comes from being less wrong than everyone else, not from achieving perfect data.
The infrastructure you build today—unified tracking, CRM integration, server-side events, attribution modeling—becomes more valuable over time. Every customer journey you capture trains your understanding of what works. Every touchpoint sequence you analyze reveals patterns you can replicate. The data compounds, and so does your advantage.
Ready to elevate your marketing game with precision and confidence? Discover how Cometly's AI-driven recommendations can transform your ad strategy—Get your free demo today and start capturing every touchpoint to maximize your conversions.