
You are spending money across Meta, Google, TikTok, and maybe a handful of other platforms. The dashboards are full of data: clicks, impressions, cost per click, and conversion counts. But when you sit down to answer the simplest question in advertising, which ad campaign is actually profitable, the picture gets blurry fast.
The problem is not a lack of data. It is that most marketers are measuring the wrong things, in the wrong places, with the wrong tools. Platform-reported metrics often inflate results because of overlapping attribution windows, modeled conversions, and the ongoing loss of tracking signals from privacy changes. The result is a dangerous illusion: you think a campaign is profitable when it is quietly burning cash, or you kill a campaign that was driving your best customers all along.
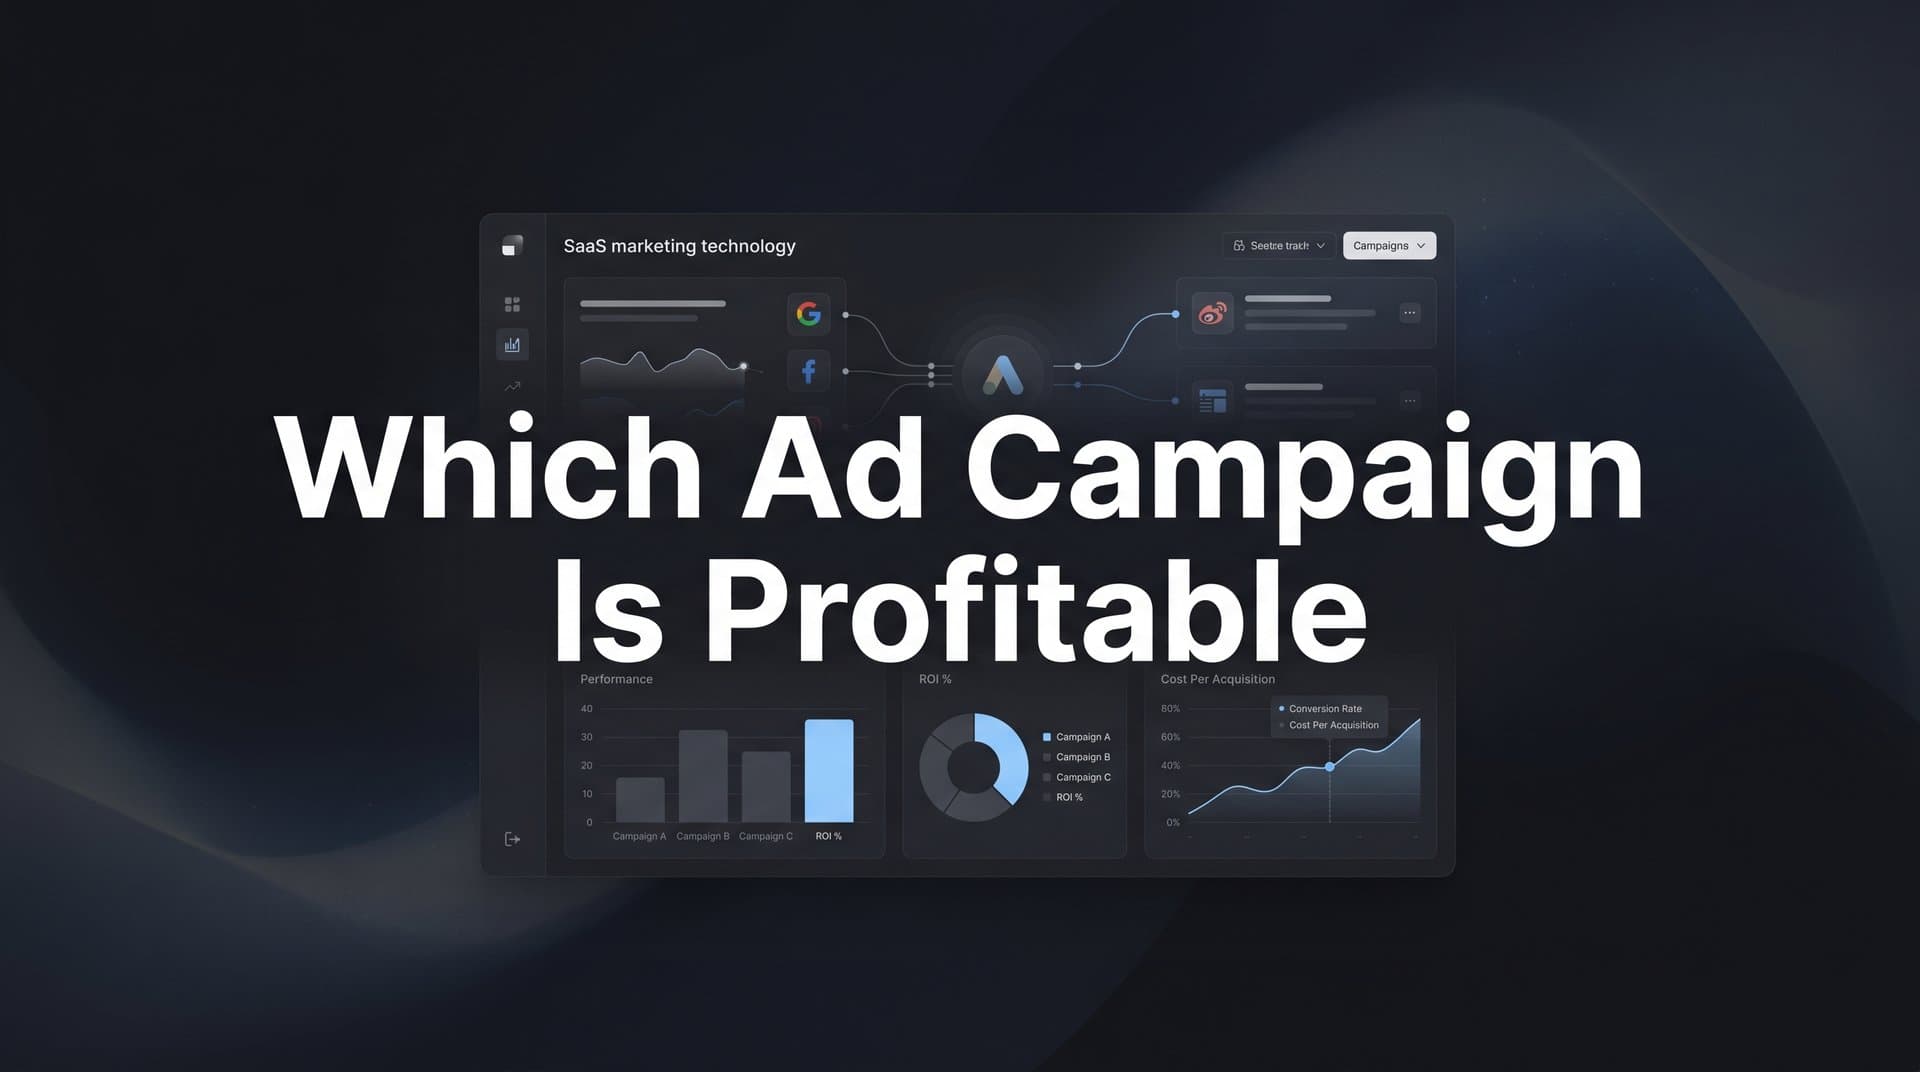
Sound familiar? You are not alone. This is one of the most common and costly mistakes in paid advertising, and it happens at every budget level.
This guide walks you through a clear, repeatable process to identify which ad campaigns are truly profitable and which ones are draining your budget. You will learn how to define real profitability metrics, set up accurate tracking, connect ad spend to actual revenue, compare campaigns on a level playing field, and take action on what you find.
Whether you run campaigns for your own brand or manage ads for clients, these steps give you a framework you can apply across any platform or budget size. The goal is not more data. It is the right data, connected in the right way, so every budget decision you make is grounded in actual profit rather than platform-reported optimism.
Let's get into it.
Step 1: Define What "Profitable" Actually Means for Your Business
Before you open a single dashboard, you need to answer a foundational question: what does profitable actually mean for your business? This sounds obvious, but most marketers skip it and end up optimizing for metrics that have almost nothing to do with real profit.
The most common trap is treating ROAS (return on ad spend) as the ultimate measure of campaign success. ROAS tells you how many dollars in revenue came back for every dollar you spent on ads. But it says nothing about whether you actually made money. A 4x ROAS sounds great until you factor in a 40% cost of goods sold, fulfillment costs, platform fees, and overhead. Suddenly that "profitable" campaign is breaking even at best.
True profitability requires you to account for the full picture. Here is a simple formula to work with:
True Campaign Profit: Revenue from campaign minus (ad spend + cost of goods sold + fulfillment costs + overhead allocation) = true campaign profit.
Once you run that calculation, you will know your actual margin per campaign, not just your revenue multiple.
From there, work backward to set a target CPA (cost per acquisition) and a target ROAS that reflect your real margins. If your product costs $30 to produce and sell, ships for $8, and you have $12 in overhead per order, then your total cost before ad spend is $50. If you sell it for $100, you have $50 left to cover ads and still profit. That sets your maximum allowable CPA at $50, and your minimum profitable ROAS at 2x. These are the numbers you should be optimizing toward, not whatever the platform defaults suggest.
There is another dimension worth thinking through: front-end versus back-end profitability. Front-end profitability is whether the first purchase from a new customer covers its costs. Back-end profitability factors in repeat purchases, upsells, and customer lifetime value (LTV) over time. A campaign that looks unprofitable on the first transaction might be highly profitable when you account for what those customers spend over the next 12 months.
This distinction changes which campaigns look like winners. A campaign targeting loyal, high-LTV customers might have a higher CPA but generate far more profit over time than a campaign optimized purely for cheap first purchases. Understanding which ads drive actual revenue requires looking beyond surface-level metrics to these deeper profitability signals.
One critical tip: set your profitability thresholds before you look at the data. If you decide what "good" looks like after you have already seen the numbers, you will unconsciously rationalize underperforming campaigns and dismiss solid ones. Define your targets first, then measure against them.
Step 2: Set Up Accurate Cross-Platform Tracking
Here is the uncomfortable truth about platform-reported data: it is almost certainly overstating your results. Meta counts a conversion if someone clicked your ad and converted within a 7-day window. Google does the same within its own window. TikTok has its own. When the same customer sees ads on all three platforms before buying, every platform claims full credit for that conversion. Your total reported conversions can easily be two or three times your actual conversion count.
This is not a bug or a conspiracy. It is just how attribution windows work when every platform operates in its own silo. The problem is that making budget decisions based on siloed platform data leads you to over-invest in channels that look productive but are actually sharing credit for the same customers. Solving this requires tracking multiple ad campaigns accurately through a unified system rather than relying on each platform's self-reported numbers.
The second major issue is tracking signal loss. Apple's App Tracking Transparency changes made it significantly harder for browser-based pixels to follow users across apps and websites on iOS devices. Add in ad blockers, privacy-focused browsers, and cookie restrictions, and a meaningful portion of your conversions are simply invisible to client-side pixels. You are making decisions based on incomplete data without even knowing it.
Server-side tracking addresses this directly. Instead of relying on a pixel in the browser to fire a conversion event, server-side tracking sends that data from your server directly to the ad platform. It bypasses many of the browser-level restrictions that cause data loss, giving you a more complete and accurate picture of what is actually happening.
Beyond server-side tracking, the bigger goal is building a single source of truth. That means connecting your ad platforms, your website, and your CRM so that every step of the customer journey, from ad click to purchase to repeat order, is visible in one place. Mastering conversion tracking across all your channels is essential to eliminating the blind spots that lead to bad budget decisions.
This is exactly the problem Cometly is built to solve. Cometly's server-side tracking captures conversion data that browser pixels miss, and its platform integrations pull together data from Meta, Google, and other channels so you can see the full customer journey without manually stitching spreadsheets together.
The success indicator for this step is straightforward: you should be able to see a single customer's journey from the first ad click all the way through to closed revenue. Not just a conversion event firing in a dashboard, but the actual path a real customer took before spending money with you. When you can see that, you have the foundation you need to make accurate profitability decisions.
Step 3: Connect Ad Spend to Actual Revenue in Your CRM
This is where most profitability analysis breaks down, and it is the step most marketers skip entirely. The gap between "conversions" and "revenue" is enormous, and it is where the illusion of campaign profitability is born.
Think about what most ad platforms count as a conversion. A form fill. A lead submission. A trial signup. These are valuable signals, but they are not dollars. A campaign that generates 100 leads at $50 each looks like it has a $5,000 cost. But if only 10 of those leads close, and the average deal is $500, the campaign generated $5,000 in revenue against $5,000 in spend. That is a 1x ROAS before you factor in any other costs. Not exactly the win the conversion report suggested.
The only way to know which ad campaigns are truly profitable is to connect your ad data to your CRM pipeline. Learning how to attribute revenue to specific campaigns is the bridge between vanity metrics and real profitability analysis. This means attributing revenue back to the originating campaign, ad set, and even individual creative, so you can see not just which campaigns generate leads, but which campaigns generate leads that actually close into paying customers.
Here is how to approach this in practice. Start by ensuring your CRM captures the UTM parameters or click IDs from your ad platforms at the point of lead capture. Every contact in your CRM should carry information about which campaign, ad set, and ad brought them in. Then, as those leads move through your pipeline, the revenue they generate gets attributed back to that originating source. Following UTM parameter best practices ensures your data stays clean and attributable throughout the entire funnel.
This shifts your analysis from "cost per lead" to "cost per closed deal" and "revenue per campaign." Those are the numbers that actually tell you about profitability. A campaign with a $200 cost per lead that closes at 30% and generates $2,000 average deal values is far more profitable than a campaign with a $50 cost per lead that closes at 5% and generates $800 deals. You would never see that difference without CRM-connected attribution.
Cometly connects CRM events directly to ad campaign data, so marketers can see revenue attribution at every pipeline stage. Instead of stopping at the lead, you can trace each campaign's contribution all the way to closed revenue, giving you a true picture of which campaigns are driving profit and which are just filling your pipeline with noise.
Step 4: Compare Campaigns Using Multi-Touch Attribution
Even with accurate tracking and CRM-connected data, there is still a significant risk of misreading your campaigns if you rely on a single attribution model. The most common default, last-click attribution, gives 100% of the credit for a conversion to the final touchpoint before the purchase. It is simple, but it is deeply misleading.
Consider a customer who sees your brand on a YouTube ad, clicks a retargeting ad on Meta three days later, and then converts after clicking a Google Search ad. Last-click attribution gives all the credit to Google Search. The YouTube ad and the Meta retargeting ad get nothing, even though they were essential steps in the journey. Understanding retargeting campaign attribution is critical because these mid-funnel touchpoints often play a decisive role in converting prospects that top-of-funnel campaigns introduced.
Understanding the common attribution models helps you use them correctly:
First Touch: Gives 100% credit to the first interaction. Useful for understanding which campaigns initiate customer journeys and drive top-of-funnel awareness.
Last Touch: Gives 100% credit to the final interaction before conversion. Useful for identifying which campaigns close deals, but tends to over-credit retargeting and branded search.
Linear: Distributes credit equally across all touchpoints. Gives a balanced view of the full journey but can dilute the contribution of high-impact touchpoints.
Time Decay: Gives more credit to touchpoints closer to the conversion. Useful when recent interactions genuinely indicate higher purchase intent.
The smart approach is not to pick one model and commit to it. It is to evaluate the same campaign under multiple models and look for patterns. If a campaign looks strong under first touch but weak under last touch, it is likely an effective awareness driver that needs support from mid-funnel campaigns to close. If it looks strong under last touch but weak under first touch, it is a closer, not a starter.
One critical pitfall to avoid: never compare campaigns across different platforms using each platform's own native attribution. Each platform applies its own model and claims credit independently, which leads to double and triple counting. Investing in the right attribution marketing tools gives you the neutral, unified view you need to make accurate comparisons.
Cometly's multi-touch attribution dashboard lets you compare models side by side across all your campaigns and channels. Instead of toggling between platform reports that each tell a different story, you get a single view that shows each campaign's contribution to revenue under any model you choose. That is how you find campaigns that are genuinely driving profit versus campaigns that are just good at taking credit.
Step 5: Run a Profitability Audit Across All Active Campaigns
Now that you have your profitability thresholds defined, your tracking in place, your CRM connected, and your attribution models set up, it is time to actually audit what is working. This step is where the analysis becomes action.
Start by pulling all active campaigns into a single view. This is much easier when you have a unified attribution platform, but even a well-structured spreadsheet works if you are pulling data manually. The goal is to have every active campaign visible in one place, with consistent metrics applied across all of them. A solid campaign tracker template can help you organize this data systematically whether you are using a dedicated platform or building your own reporting framework.
Apply the profitability formula from Step 1 to each campaign. Revenue from campaign minus ad spend, COGS, and overhead allocation gives you true campaign profit. Rank every campaign from most profitable to least profitable based on this calculation, not based on ROAS or conversion volume alone.
Then segment your campaigns to find patterns. Break them down by platform, objective, audience type, and creative format. You will often find that certain segments consistently outperform others in ways that are not obvious from top-line numbers. For example, video creative on Meta might generate lower conversion volume but attract customers with higher LTV. A prospecting campaign on Google might have a higher CPA than retargeting but drive more first-time buyers who go on to become repeat customers.
This segmentation is also how you find hidden winners and hidden losers. Hidden winners are campaigns that look mediocre on ROAS but attract customers with high lifetime value, strong close rates, or large average deal sizes. Hidden losers are campaigns that look great on ROAS or conversion volume but generate low-quality leads that rarely close, or customers who churn quickly. Developing a systematic approach to underperforming ad campaigns detection ensures these hidden losers do not silently drain your budget month after month.
Use this checklist as your audit framework:
Spend vs. Revenue: Is the campaign generating more revenue than it costs, after factoring in COGS and overhead?
CPA vs. Target CPA: Is the cost per acquisition within the threshold you set in Step 1?
ROAS vs. Target ROAS: Is the return on ad spend meeting or exceeding your margin-based target?
Lead Quality Score: For lead gen campaigns, what percentage of leads meet your ideal customer profile?
Close Rate by Campaign: What percentage of leads from each campaign convert to paying customers?
Run this audit at minimum once a month. If you are spending aggressively, weekly audits will help you catch underperforming campaigns before they drain significant budget. The faster you catch a hidden loser, the more budget you have to redirect to proven winners.
Step 6: Reallocate Budget and Feed Better Data to Your Ad Platforms
Identifying which campaigns are profitable is only valuable if you act on what you find. This final step is where the analysis pays off in real budget decisions and improved campaign performance over time.
The decision framework is straightforward. Scale profitable campaigns by increasing budget incrementally and monitoring whether efficiency holds as spend grows. Pause campaigns that are clearly unprofitable after giving them enough time and spend to generate statistically meaningful data. For borderline campaigns, run controlled tests with tighter targeting, creative variations, or audience adjustments before making a final call. Avoiding wasted ad spend on ineffective campaigns is the single biggest lever most marketers have for improving overall marketing ROI.
But there is a second, equally important action in this step that most marketers overlook: feeding better conversion data back to the ad platforms themselves. Meta, Google, and other platforms use machine learning to optimize bidding and targeting. Their algorithms are only as good as the signals you send them. If you are only sending form fill events as conversions, the algorithm optimizes to find more people likely to fill out forms. That is not the same as finding people likely to become profitable customers.
When you send enriched conversion signals back to the platform, including information about which leads closed, which customers made repeat purchases, and which conversions were actually high-value, the algorithm can optimize toward the outcomes that actually matter to your business. This is a compounding advantage: better data leads to better targeting, which leads to higher-quality customers, which generates better data for the next cycle.
Cometly's Conversion Sync feature is built for exactly this purpose. It sends enriched, revenue-connected conversion events back to Meta, Google, and other platforms, so their bidding algorithms receive signals about your actual profitable customers rather than just any conversion event. Over time, this improves the quality of traffic the platforms send you, which makes your campaigns more profitable without necessarily spending more.
Alongside this, Cometly's AI-powered recommendations surface optimization opportunities across your campaigns without requiring you to manually comb through every data point. Instead of spending hours in dashboards looking for patterns, the AI flags which campaigns deserve more budget, which ones are underperforming, and where your best opportunities for growth are hiding.
The success indicator for this step is a measurable shift in budget allocation toward campaigns with proven profitability, combined with improved campaign performance as the platforms receive higher-quality conversion signals. When both of those things happen together, you are no longer just measuring profitability. You are actively engineering it.
Your Profitability Framework at a Glance
Here is a quick-reference summary of the six steps covered in this guide:
1. Define profitability metrics before looking at data. Calculate target CPA and target ROAS based on real margins, not platform defaults.
2. Set up accurate cross-platform tracking using server-side tracking and a unified data layer that connects your ad platforms, website, and CRM.
3. Connect ad spend to CRM revenue so you can see which campaigns generate leads that actually close, not just which campaigns generate the most form fills.
4. Apply multi-touch attribution to evaluate campaigns across the full customer journey, and compare models side by side to understand each campaign's true contribution.
5. Run a structured profitability audit monthly, segmenting by platform, objective, audience, and creative to find hidden winners and hidden losers.
6. Reallocate budget to proven winners, pause clear losers, and feed enriched conversion data back to ad platforms so their algorithms optimize toward your most profitable customers.
The key shift in all of this is moving from platform-reported vanity metrics to a unified, revenue-connected view of campaign performance. Clicks and impressions do not pay salaries. Profit does.
Cometly makes this process faster and more accurate by connecting your ad platforms, website, and CRM in one place, with server-side tracking to capture what pixels miss and AI-powered insights to surface what the data is telling you. You get a clear, complete picture of which campaigns are truly driving your business forward.
Ready to stop guessing and start knowing which campaigns are actually profitable? Get your free demo today and see exactly how Cometly connects every touchpoint to revenue so you can make every budget decision with confidence.


