Ad agencies live and die by their ability to prove value. Yet many agencies still send clients spreadsheets packed with vanity metrics, disconnected channel data, and numbers that don't map to business outcomes. The result is a familiar pattern: clients grow skeptical, budget conversations get uncomfortable, and accounts churn.
Today's clients are more data-literate and more budget-conscious than ever before. They don't want impressions and click-through rates in isolation. They want to know which campaigns drove pipeline, which channels closed revenue, and whether the agency is the right partner to continue investing in.
Client reporting for ad agencies has evolved from a routine deliverable into a retention and growth tool. The agencies that hold onto accounts longest are the ones who can clearly demonstrate what is working, explain why, and show a credible path forward. That requires more than a polished PDF every month.
This guide covers eight practical strategies to transform your reporting from a backward-looking recap into a forward-looking performance conversation. Whether you manage five clients or fifty, these approaches will help you connect ad activity to real business outcomes and build the kind of trust that keeps accounts renewing year after year.
1. Anchor Every Report to Business Outcomes, Not Ad Metrics
The Challenge It Solves
Most platform dashboards are designed to showcase platform-native metrics: impressions, reach, CTR, and engagement rate. Those numbers look impressive, but they rarely answer the question every budget holder is actually asking: "What did I get for my money?" When reports lead with ad metrics instead of business outcomes, clients start to question whether the agency understands their actual goals.
The Strategy Explained
Reframe every report around the metrics that connect to your client's business model. For most B2B clients, that means pipeline generated, cost per qualified lead, cost per acquisition, and revenue influenced by paid channels. For e-commerce clients, it means revenue, return on ad spend, and customer acquisition cost.
This shift positions the agency as a business partner rather than a media buyer. It also changes the tone of client conversations. Instead of defending why CTR dropped, you are discussing how pipeline trended and what adjustments will drive more qualified opportunities next quarter.
Implementation Steps
1. Start each new client engagement by documenting their primary KPIs: the metrics their leadership team uses to measure success, not the metrics the ad platform defaults to showing.
2. Map every ad metric in your report to a corresponding business outcome. If you are reporting on click volume, connect it to traffic quality and downstream conversion rates, not just the raw number.
3. Open every report with a one-page executive summary that leads with business outcomes. Save the channel-level detail for the appendix or supporting sections.
Pro Tips
Ask clients directly: "If you had to show this report to your CEO, what three numbers would they care about most?" Build your reporting template around those answers. When clients feel like the report speaks their language, they are far more likely to see the agency as a strategic partner rather than a vendor. Exploring the right client reporting tools can make this kind of outcome-focused structure much easier to implement consistently.
2. Implement Multi-Touch Attribution Before You Report Anything
The Challenge It Solves
Last-click attribution is one of the most persistent problems in client reporting. It credits the final touchpoint before conversion while ignoring every channel that contributed earlier in the journey. This systematically under-credits awareness campaigns, social channels, and content efforts, and over-credits retargeting and branded search. Agencies that report on last-click data alone often end up defending channels that look weak on paper but are actually driving significant pipeline influence.
The Strategy Explained
Multi-touch attribution distributes credit across every touchpoint in the customer journey, giving agencies and clients a far more accurate picture of how channels work together. Models like linear attribution, time-decay, and data-driven attribution each offer a different lens on the same journey. Setting up proper attribution before building any client report ensures the data reflects reality rather than a distorted version of it.
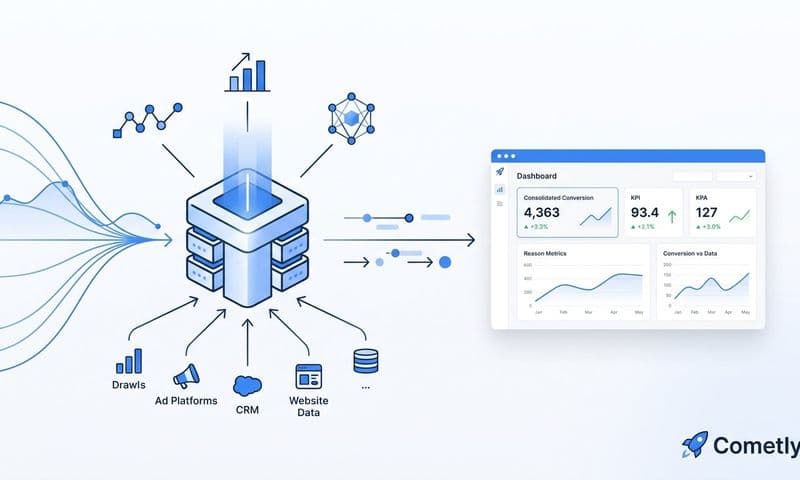
Platforms like Cometly are built specifically for this kind of attribution work. They connect ad platforms, CRM data, and website events to track every touchpoint from first ad click to closed-won revenue, giving agencies a foundation they can report from with confidence.
Implementation Steps
1. Audit your current attribution setup for each client. Identify whether you are relying on last-click data from individual platforms or using a unified attribution model that spans all channels.
2. Configure multi-touch attribution tracking before launching new campaigns. Retrofitting attribution after the fact is possible but significantly harder.
3. Document which attribution model you are using in every client report and explain briefly why that model was chosen for their specific funnel structure.
Pro Tips
Don't just pick one model and call it done. Showing clients how performance looks under multiple attribution models builds credibility and demonstrates analytical depth. Choosing the right attribution software for marketing agencies also prevents the uncomfortable situation where a client runs their own last-click analysis and arrives at a completely different number than your report.
3. Use Server-Side Tracking to Eliminate Data Gaps
The Challenge It Solves
Browser-based pixel tracking has become increasingly unreliable. Ad blockers, iOS privacy updates, and browser-level restrictions on third-party cookies all prevent pixels from firing correctly. When conversion events go untracked, your client reports undercount results, making campaigns look less effective than they actually are. This creates unnecessary doubt and makes it harder to justify budget.
The Strategy Explained
Server-side tracking sends conversion data directly from your server to ad platforms rather than relying on a browser pixel to fire. Conversion API integrations like Meta CAPI and Google Enhanced Conversions are the industry-standard solutions for maintaining data fidelity in a privacy-first environment. They capture conversion events that browser pixels miss and send that data back to the ad platforms in a way that improves both reporting accuracy and algorithmic optimization.
When your conversion data is complete, your client reports become more defensible. You can show clients the full picture of what their campaigns produced rather than a partial view filtered through browser restrictions.
Implementation Steps
1. Audit your current tracking setup for each client. Check whether you are relying solely on browser pixels or have server-side tracking in place.
2. Implement Conversion API integrations for the platforms your clients are actively running on. Prioritize Meta CAPI and Google Enhanced Conversions as a baseline.
3. Use a platform like Cometly to centralize server-side event tracking across all ad channels, ensuring consistent data collection without managing separate integrations for each platform manually.
Pro Tips
Run a data quality audit after implementing server-side tracking. Compare the conversion volumes you were capturing before versus after. In many cases, agencies discover they were significantly undercounting conversions, which means they were also underreporting the value they were delivering to clients. Using dedicated performance marketing tracking software makes this kind of before-and-after comparison straightforward to document and present.
4. Build a Single Source of Truth Across All Ad Channels
The Challenge It Solves
Pulling data from separate platform dashboards creates a reporting nightmare. Google Ads attributes a conversion one way, Meta attributes it another way, and LinkedIn has its own view entirely. When clients see different numbers from different sources, trust erodes fast. They start to wonder which number is real and whether the agency actually has a handle on their data.
The Strategy Explained
Centralizing all channel data into a single unified view eliminates the discrepancy problem at its root. Instead of reconciling platform dashboards after the fact, you work from one consistent data set that applies the same attribution logic across every channel. This gives clients a coherent, cross-channel picture of performance rather than a collection of siloed reports that don't add up.
A unified view also makes it much easier to identify cross-channel patterns. You can see how a prospect who clicked a LinkedIn ad later converted through a Google search, and credit both touchpoints appropriately rather than letting each platform claim full credit for the same conversion.
Implementation Steps
1. Identify all the ad platforms your client is running on and document which conversion events each platform is currently tracking and how it attributes them.
2. Connect all platforms to a centralized attribution tool that applies consistent attribution logic across channels. Cometly supports 70-plus native integrations specifically for this purpose.
3. Establish a standard reporting cadence that pulls from the unified view rather than individual platform dashboards. Make the single source of truth the default, not the exception.
Pro Tips
When you present a unified view to clients for the first time, walk them through why the numbers differ from what they see in individual platform dashboards. A robust marketing reporting platform helps explain the attribution overlap problem proactively, which builds credibility and prevents the confusion that comes when clients log into their own ad accounts and see different figures.
5. Structure Reports Around the Client's Funnel Stage
The Challenge It Solves
A one-size-fits-all report template fails clients at different stages of growth. A client running brand awareness campaigns at the top of the funnel needs to see reach, frequency, and brand search lift. A client focused on pipeline acceleration needs to see lead quality, cost per opportunity, and conversion rates from lead to qualified pipeline. Sending the same report structure to both clients means neither gets the clarity they need.
The Strategy Explained
Align your report sections with where the client's current campaigns sit in the funnel: top of funnel, middle of funnel, or bottom of funnel. TOFU reports should focus on awareness metrics and audience building. MOFU reports should focus on engagement quality and nurture efficiency. BOFU reports should focus on conversion rates, cost per acquisition, and revenue influence.
This approach also helps clients understand why certain metrics matter at certain stages. When a client asks why you are reporting on video completion rates, you can point to the TOFU section of the report and explain how that metric connects to downstream pipeline quality. Tracking the right digital marketing performance metrics at each funnel stage is what separates agencies that guide strategy from those that simply recap activity.
Implementation Steps
1. Map each active campaign to a funnel stage at the start of every reporting period. Campaigns can shift stages over time, so this should be a live document, not a one-time exercise.
2. Build report templates for each funnel stage with the corresponding primary and secondary KPIs pre-defined. This saves time and ensures consistency across clients.
3. Include a brief funnel stage summary at the top of each report section explaining what the client was trying to achieve at that stage and how the data reflects progress toward that goal.
Pro Tips
Use funnel stage framing to manage client expectations proactively. When a client wants to see immediate revenue results from a brand awareness campaign, a TOFU-focused report with appropriate metrics helps redirect the conversation toward the right success criteria for that stage of the funnel.
6. Include Attribution Model Comparisons to Show the Full Story
The Challenge It Solves
Showing clients a single attribution number creates a false sense of certainty. Every attribution model involves trade-offs, and a single number can mask important nuances about how channels contribute at different stages of the journey. When clients only see one view, they often make budget decisions that over-invest in bottom-funnel channels and starve the awareness and nurture stages that feed them.
The Strategy Explained
Including attribution model comparisons in your reports, showing how performance looks under first-touch, linear, time-decay, and data-driven models, gives clients a richer understanding of cross-channel contribution. It also positions the agency as analytically rigorous rather than cherry-picking the model that makes their work look best.
This transparency builds significant trust. When clients can see that the agency is willing to show multiple perspectives on the data rather than a single flattering view, they are more likely to trust the analysis and act on the recommendations that follow. Understanding what attribution model is best for optimizing ad campaigns helps agencies make a more compelling case for the models they recommend.
Implementation Steps
1. Use an attribution platform that supports multiple models simultaneously. Cometly allows you to compare attribution models side by side, making it straightforward to include model comparisons in client reports without manual calculation.
2. Select two or three models that are most relevant to the client's funnel structure and include a brief explanation of what each model emphasizes and why it matters for their specific situation.
3. Use the model comparison to guide budget recommendations. If the data-driven model credits a channel that last-click ignores, use that as evidence to support continued investment in that channel.
Pro Tips
Keep the attribution model comparison section concise. The goal is to build credibility and provide context, not to overwhelm clients with methodology. A short visual comparison with a one-paragraph explanation is usually more effective than a deep technical breakdown.
7. Automate Data Collection So Reports Stay Accurate and Timely
The Challenge It Solves
Manual data pulls from multiple ad platforms are slow, error-prone, and unsustainable as client counts grow. When an analyst spends hours every week pulling numbers from Google Ads, Meta, LinkedIn, and the CRM, there are multiple opportunities for copy-paste errors, date range mismatches, and outdated figures to slip into the final report. Clients who spot discrepancies lose confidence quickly, and that confidence is hard to rebuild.
The Strategy Explained
Automating data collection through native integrations keeps client data current and eliminates the manual steps that introduce errors. When your reporting platform connects directly to ad platforms and pulls data automatically, reports are always working from the latest available figures. This also frees agency teams to spend their time on analysis and strategy rather than data wrangling.
Automation also enables more frequent reporting touchpoints. Instead of a monthly report that clients wait four weeks for, automated data collection makes it practical to offer weekly performance snapshots or real-time dashboards that clients can check on their own schedule. Agencies that embrace marketing automation for agencies consistently find they can serve more clients without proportionally increasing headcount.
Implementation Steps
1. Audit your current reporting workflow and identify every manual step involved in pulling, formatting, and reconciling data. These are your automation targets.
2. Connect all client ad platforms to a centralized reporting tool with native integrations. Prioritize platforms where manual data pulls are most time-consuming or error-prone.
3. Set up automated data refresh schedules so client dashboards and reports always reflect current performance without requiring manual intervention.
Pro Tips
Use the time saved by automation to invest in the parts of reporting that require human judgment: insight generation, trend analysis, and strategic recommendations. Clients don't pay agency fees for data collection. They pay for the expertise that turns data into decisions. Automation makes it possible to deliver more of that expertise at scale.
8. Turn Reports Into Forward-Looking Strategy Conversations
The Challenge It Solves
Most client reports are backward-looking by default. They recap what happened last month, explain the numbers, and stop there. This format positions the agency as a scorekeeper rather than a strategic partner. Clients who see their agency as a scorekeeper are always one bad month away from reconsidering the relationship. Clients who see their agency as a strategic partner are invested in the long-term collaboration.
The Strategy Explained
The best client reports don't just summarize performance. They surface insights, flag optimization opportunities, and recommend specific next steps. This requires moving beyond data presentation into data interpretation. What does the trend in cost per lead tell you about audience saturation? What does the attribution model comparison reveal about where the funnel needs strengthening? What should the client do differently next quarter based on what the data shows?
AI-driven analysis tools make this kind of insight generation more scalable. Platforms like Cometly use AI to identify high-performing ads, flag underperforming segments, and surface optimization recommendations that might take a human analyst hours to find manually. That analysis can feed directly into the forward-looking section of every client report.
Implementation Steps
1. Add a dedicated "Recommendations and Next Steps" section to every client report. Make it the final section, after the data review, so it lands as the natural conclusion of the performance conversation.
2. Use AI-powered insights to identify patterns in the data that inform your recommendations. Look for high-performing ad creative, underperforming audience segments, and channels where spend efficiency is trending in the wrong direction.
3. Frame every recommendation in terms of business impact. Instead of "we recommend increasing budget on this campaign," say "shifting budget toward this campaign is projected to improve cost per qualified lead based on the trend we are seeing over the past six weeks."
Pro Tips
Schedule a brief strategy call alongside every monthly report delivery rather than just sending the document. The report becomes the agenda for a conversation about what to do next. That conversation is where client relationships deepen and where agencies demonstrate the kind of proactive thinking that justifies retainer renewals.
Putting It All Together
Start by auditing your current reports against these eight strategies. Most agencies find they are reasonably strong on data collection but weaker on attribution accuracy and business outcome framing. Addressing those two areas first tends to have the most immediate impact on how clients perceive agency value.
The agencies that retain accounts longest are not necessarily the ones running the best campaigns. They are the ones who can clearly demonstrate what is working, explain why, and show a credible path forward. That requires accurate attribution data, unified cross-channel reporting, and a reporting structure built around client goals rather than platform defaults.
Here is a practical implementation sequence to get started:
1. Audit your attribution setup and identify gaps in conversion tracking across all client accounts.
2. Implement server-side tracking and Conversion API integrations to close the data gaps that browser pixels miss.
3. Centralize all channel data into a unified view and eliminate manual data pulls from individual platform dashboards.
4. Rebuild your report templates around business outcomes, funnel stage alignment, and forward-looking recommendations.
5. Add attribution model comparisons and AI-driven insights to position the agency as analytically rigorous and strategically proactive.
Cometly gives ad agencies the infrastructure to execute every one of these steps. From multi-touch attribution and server-side conversion tracking to AI-powered insights and 70-plus native integrations, Cometly connects every touchpoint to revenue so your reports always tell the full story.
Ready to elevate your agency's reporting with precision and confidence? Discover how Cometly's AI-driven recommendations can transform your client strategy. Get your free demo today and start capturing every touchpoint to maximize the value you deliver to every account.