
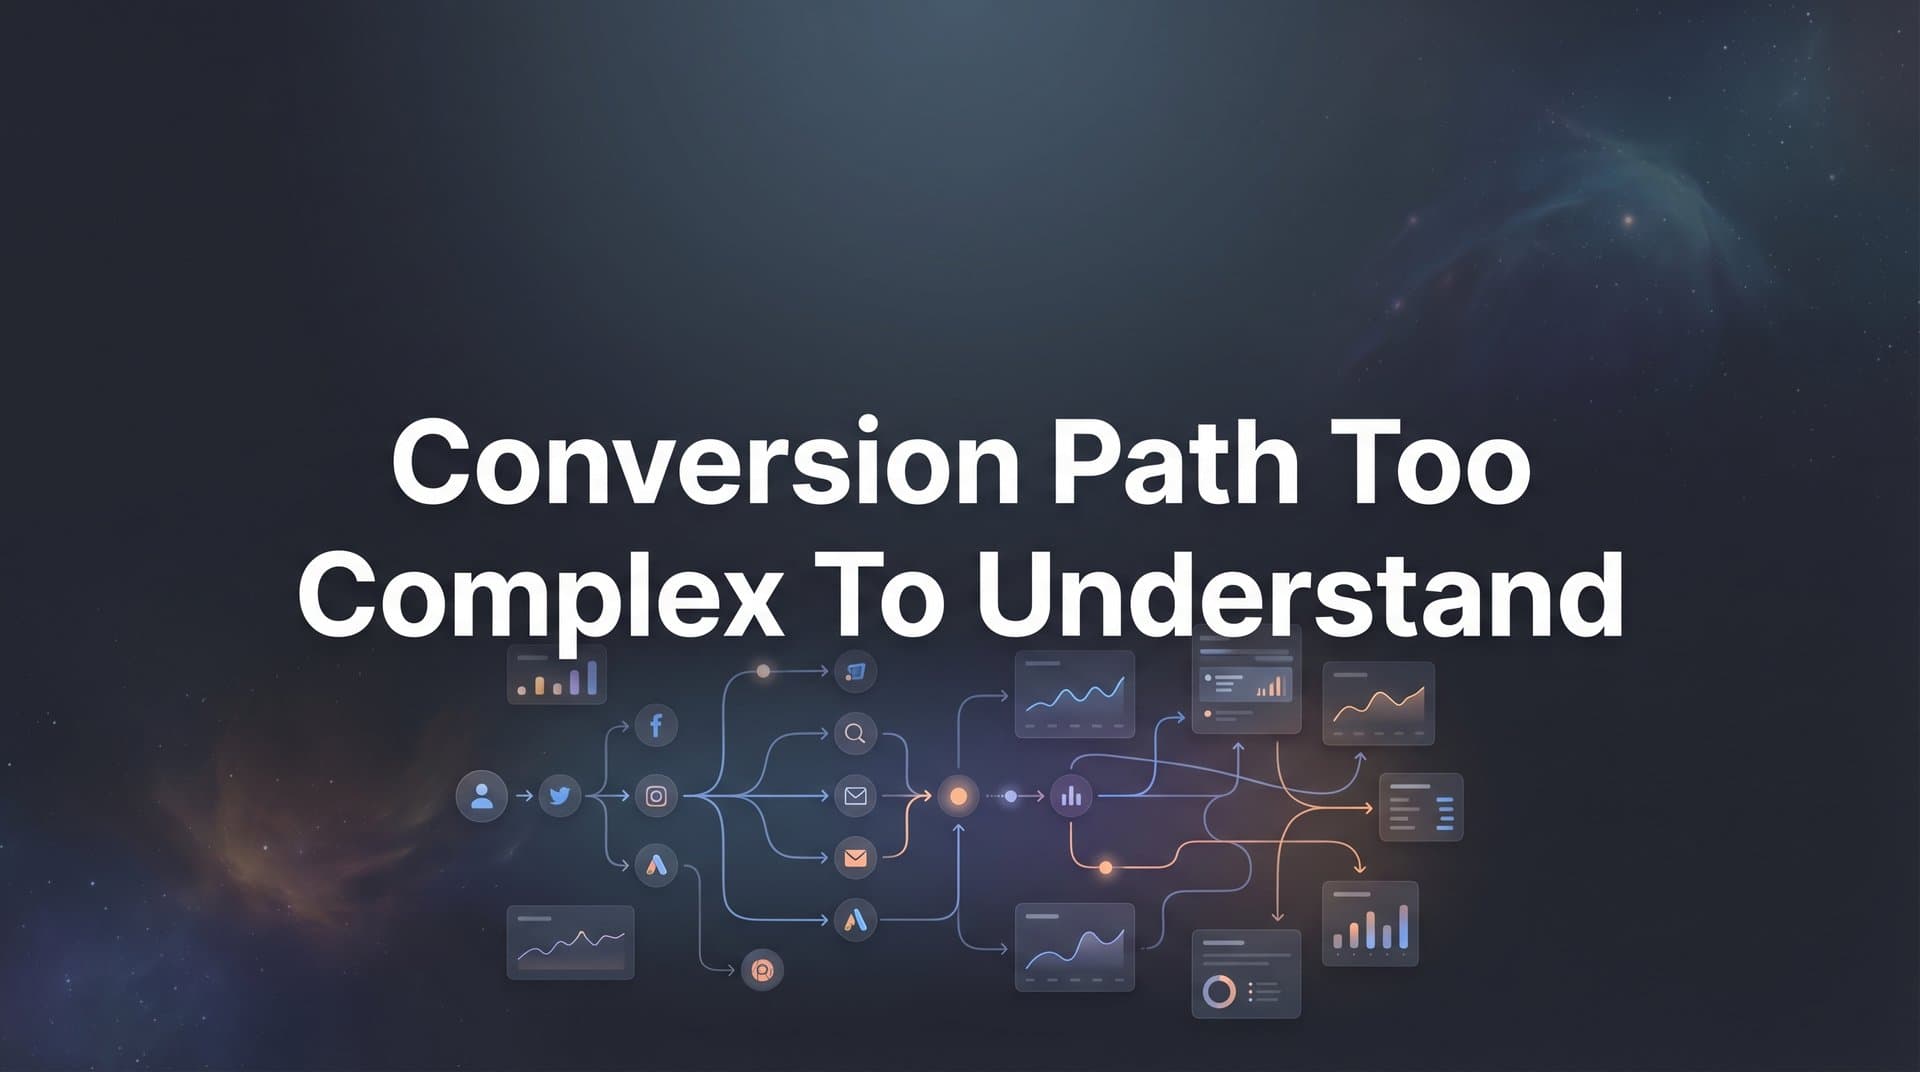
When your conversion path feels like a tangled web of touchpoints, channels, and interactions, making sense of what actually drives revenue becomes nearly impossible. You are not alone in this challenge.
Modern customer journeys often span dozens of interactions across multiple platforms, devices, and timeframes before a single conversion occurs. A prospect might see your Facebook ad on their phone during their morning commute, research your product on their laptop at work, read customer reviews on their tablet that evening, and finally convert on their desktop three days later after clicking an email.
The result? Marketing teams struggle to identify which efforts deserve credit, budgets get misallocated, and scaling becomes guesswork rather than strategy.
This guide walks you through a practical, step-by-step process to untangle even the most complex conversion paths. You will learn how to map your customer journey systematically, identify the touchpoints that truly matter, and implement tracking that brings clarity instead of confusion.
By the end, you will have a clear framework for understanding exactly how your marketing efforts connect to real revenue. No more staring at disconnected data points wondering which campaigns actually work. Just clear, actionable insights that let you scale with confidence.
Step 1: Audit Your Current Touchpoints and Data Sources
Before you can simplify anything, you need to see the full picture of what you are working with. Think of this step as creating an honest inventory of your marketing ecosystem.
Start by listing every channel where customers interact with your brand. This includes paid advertising platforms like Facebook Ads, Google Ads, LinkedIn Ads, and any other paid channels you use. Document your organic channels: SEO traffic, social media presence, content marketing efforts, and referral sources. Do not forget email campaigns, SMS marketing, affiliate partnerships, and direct traffic.
The goal here is completeness, not judgment. Write it all down, even the channels you suspect are not performing well.
Next, document all tracking tools currently in use. You might have Google Analytics on your website, pixel tracking from various ad platforms, a CRM system tracking leads and customers, email marketing software with its own analytics, and possibly marketing automation platforms. List them all and note what each tool actually tracks. For a comprehensive overview of available options, explore these best conversion tracking tools on the market.
This is where you will likely discover your first major problem: gaps and overlaps. Maybe your Facebook pixel fires on some pages but not others. Perhaps your CRM tracks closed deals but has no visibility into the marketing touchpoints that preceded them. You might find three different tools all claiming to track the same conversion event, each reporting different numbers.
Now map where your data actually lives. Create a simple document showing which platforms house which data. Ad performance metrics live in ad platforms. Website behavior sits in analytics tools. Customer and revenue data resides in your CRM. Campaign tracking might be scattered across spreadsheets.
Pay special attention to the disconnections. Can your analytics tool see which CRM contacts came from which ad campaigns? Does your CRM know which marketing touchpoints influenced each deal? Can you connect an anonymous website visitor who clicked your ad to the same person who filled out a form three days later?
These gaps represent the complexity you are trying to solve. When data lives in silos, connecting the dots becomes manual, time-consuming, and often inaccurate. Many marketers face conversion path visibility problems that stem directly from these disconnected systems.
Success indicator: You have a complete inventory showing all touchpoints, all tracking tools, where data lives, and which connections are missing. This document becomes your roadmap for the remaining steps.
Step 2: Define Your Conversion Events and Revenue Milestones
Not all conversions carry equal weight, yet many marketing teams track them as if they do. This creates confusion about which touchpoints actually matter for revenue.
Start by identifying your primary conversions. These are the events that directly generate revenue or represent committed future revenue. For e-commerce businesses, this means completed purchases. For SaaS companies, it might be paid subscriptions or contracts signed. For service businesses, it could be booked appointments that show up or signed proposals.
These primary conversions deserve the most attention in your attribution analysis because they represent actual business outcomes, not just marketing activity.
Next, document your micro-conversions. These are meaningful steps toward a primary conversion but do not immediately generate revenue. Email signups, content downloads, free trial starts, demo requests, and webinar registrations all fall into this category.
Micro-conversions matter because they help you understand the path to revenue, but they should not be weighted equally with actual revenue events in your analysis. Understanding how to leverage conversion rate optimization tools can help you improve performance at each stage.
Now comes the critical part: establish clear definitions for what counts as a conversion at each stage. When exactly does a demo request become a qualified lead? Does every email signup count, or only those who complete a specific action afterward? What defines a completed purchase versus an abandoned cart?
Vague definitions create vague insights. If your sales team considers a lead qualified based on criteria your marketing team is not tracking, you cannot accurately attribute which marketing efforts generate qualified leads.
Finally, assign revenue values or lead scores to different conversion types. If you sell multiple products at different price points, each purchase should carry its actual revenue value. For lead-based businesses, calculate the average value of leads from different sources based on historical close rates and deal sizes.
This step might require collaboration with sales or finance teams to get accurate numbers, but it is essential. Without revenue values attached to conversions, you cannot determine which marketing touchpoints actually drive profitable growth versus just driving activity.
Success indicator: You have a documented list of conversion events with clear definitions, categorized as primary or micro-conversions, with revenue values or lead scores assigned to each type.
Step 3: Connect Your Data Sources Into a Unified View
This is where you transform your siloed data into something actually useful. The audit from Step 1 showed you the gaps. Now you fill them.
Start by integrating your ad platforms, website analytics, and CRM data into a single source of truth. This integration is not optional if you want to understand complex conversion paths. When data lives in separate systems that do not communicate, you are forced to manually piece together customer journeys, and manual processes always introduce errors and delays.
Modern attribution platforms can automatically pull data from multiple sources and connect the dots for you. Look for solutions that offer native integrations with your existing tech stack rather than requiring custom development work. Dedicated conversion path analysis software can dramatically simplify this process.
Here is where server-side tracking becomes critical. Traditional client-side tracking relies on cookies and pixels that fire in the user's browser. This approach has become increasingly unreliable due to iOS privacy changes, browser restrictions, and ad blockers.
Server-side tracking captures data on your server before sending it to analytics and ad platforms. This means you collect more complete data even when browser-based tracking fails. For businesses running significant ad spend, the difference in data accuracy can be substantial. Implementing a proper conversion API implementation tool ensures your data flows reliably.
Set up server-side tracking for your most important conversion events. This ensures you capture the full customer journey even when client-side tracking misses interactions.
Next, establish consistent UTM parameters and naming conventions across all campaigns. This might sound basic, but inconsistent UTM usage is one of the most common reasons conversion paths appear more complex than they actually are.
Create a documented UTM structure that everyone on your marketing team follows. Decide how you will name campaigns, sources, mediums, and content parameters. Then stick to it religiously. When one team member uses "facebook" as a source and another uses "Facebook" or "fb," your analytics tool treats them as separate channels, fragmenting your data.
The same principle applies to campaign naming. Establish a clear structure like "platform_campaigntype_audience_date" and use it consistently. This makes it easy to filter and analyze performance across similar campaigns.
Success indicator: Customer journey data flows automatically into one platform without manual data stitching. You can see a complete path from first ad click through multiple touchpoints to final conversion, all in one view.
Step 4: Choose the Right Attribution Model for Your Business
Attribution models determine how credit gets distributed across the touchpoints in a conversion path. Choose the wrong model, and you will optimize for the wrong things.
First-touch attribution gives all credit to the initial touchpoint that brought someone into your ecosystem. This model favors top-of-funnel awareness channels like display ads, social media, and content marketing. It answers the question: "What made someone aware of us?"
Last-touch attribution does the opposite, giving all credit to the final touchpoint before conversion. This model favors bottom-of-funnel channels like branded search, retargeting, and email campaigns. It answers: "What closed the deal?"
Both single-touch models oversimplify reality. If a customer clicked a Facebook ad, read three blog posts, attended a webinar, and then converted via a Google search, which touchpoint deserves credit? In reality, they all contributed. Understanding your Facebook conversion path specifically can reveal how social touchpoints contribute to the overall journey.
Linear attribution distributes credit equally across all touchpoints. If there were five interactions before conversion, each gets 20% credit. This model acknowledges that multiple touchpoints matter but assumes they all matter equally, which is rarely true.
Multi-touch attribution models get more sophisticated. Time-decay models give more credit to touchpoints closer to conversion. Position-based models might give 40% credit to first touch, 40% to last touch, and split the remaining 20% among middle touchpoints. Specialized attribution modeling tools for marketers can help you implement and compare these approaches.
The right model depends on your sales cycle and typical customer journey. For impulse purchases with short consideration periods, last-touch attribution might suffice. Someone sees an ad, clicks, and buys within minutes. The ad drove the sale.
For complex B2B sales with long cycles and multiple decision-makers, multi-touch attribution becomes essential. A software purchase might involve months of research, multiple stakeholders, and dozens of touchpoints. Giving all credit to the last touch would completely misrepresent which marketing efforts actually influenced the deal.
Here is a practical approach: compare how different models credit the same conversions. Most attribution platforms let you view the same data through multiple model lenses. Look at your top converting paths through first-touch, last-touch, and multi-touch models.
If the models tell dramatically different stories about which channels drive value, your conversion path is complex enough to need multi-touch attribution. If they tell similar stories, you might be fine with a simpler model.
Success indicator: You have selected an attribution model that aligns with your business goals and sales cycle, and you understand how it distributes credit across your typical conversion paths.
Step 5: Visualize and Analyze Your Simplified Conversion Paths
Data without visualization is just numbers. Now you turn those numbers into insights you can actually use.
Create visual journey maps showing the most common paths from first touch to conversion. Most attribution platforms offer journey visualization tools that show you exactly how customers move through your marketing ecosystem. Robust conversion path analysis tools make this visualization process straightforward.
Look for patterns in these visualizations. You might discover that your highest-value customers typically interact with three specific touchpoints in a particular order. Or you might find that conversions from one channel almost always include a middle touchpoint from another channel.
These patterns reveal the true structure of your conversion paths. What looked like chaos in your initial audit now shows clear highways that customers travel repeatedly.
Compare high-value conversions to low-value or abandoned journeys. What differentiates a path that ends in a large purchase from one that ends in cart abandonment? The difference might be a specific touchpoint, a particular sequence of interactions, or a time gap between touches.
Use your analytics dashboard to identify which channels consistently appear in winning paths. This is different from asking which channels get last-touch credit. A channel might rarely close deals but almost always appear early in high-value conversion paths, making it crucial for pipeline generation even if last-touch attribution ignores it. The best data visualization tools for marketing analytics can help surface these insights clearly.
Focus on your top converting paths rather than trying to account for every possible journey. In most businesses, a small number of path patterns account for the majority of conversions. Identify your top five to ten most common paths and understand them deeply.
These common paths become your framework for decision-making. When you launch a new campaign, you can ask: "Does this fit into our known high-converting paths, or are we hoping to create an entirely new pattern?"
Success indicator: You have clear visualizations of your top five to ten most common conversion paths, and you can articulate which touchpoints consistently appear in high-value customer journeys.
Step 6: Take Action on Your Attribution Insights
Insights without action are just interesting observations. This final step turns your simplified conversion path understanding into better business results.
Start by reallocating budget toward channels that consistently contribute to conversions. This does not necessarily mean the channels with the most last-touch conversions. Look at which channels appear most frequently in your high-value conversion paths, regardless of where they appear in the journey.
You might discover that webinar attendees convert at five times the rate of other leads, even though webinars rarely get last-touch credit. That insight should influence how much you invest in webinar promotion. Using the best analytics tools for paid ads helps ensure your budget decisions are data-driven.
Feed enriched conversion data back to ad platforms to improve their optimization algorithms. Platforms like Meta and Google use the conversion signals you send them to optimize ad delivery. When you send incomplete or inaccurate data, their algorithms optimize for the wrong outcomes.
Server-side tracking and proper attribution let you send richer conversion data. Instead of just telling Facebook that someone converted, you can tell them the conversion value, which attribution model credits this touchpoint, and which other channels were involved. Implementing best conversion API tools ensures this data flows accurately to your ad platforms.
This enriched data helps ad platforms make better decisions about who to show your ads to and how much to bid. The result is improved return on ad spend without changing your creative or targeting.
Set up regular review cadences to monitor how paths change as campaigns evolve. Conversion paths are not static. Seasonal trends, competitive changes, and your own campaign adjustments all shift how customers move through your ecosystem.
Schedule monthly or quarterly reviews of your top conversion paths. Look for emerging patterns, declining paths that used to perform well, and opportunities to create new high-value journeys.
This regular review process keeps your attribution insights current and actionable. What worked last quarter might not work this quarter, and you need visibility into those changes to adapt quickly.
Success indicator: You are making budget allocation decisions based on attribution data, your ad platforms are receiving enriched conversion signals, and you have a regular cadence for reviewing and acting on path insights.
Putting It All Together
Simplifying a complex conversion path is not about reducing the number of touchpoints your customers experience. It is about gaining clarity on which touchpoints matter and how they work together to drive revenue.
By auditing your current data, defining clear conversion events, connecting your sources, choosing the right attribution model, and visualizing your paths, you transform confusion into confidence. You stop wondering which campaigns work and start knowing exactly how your marketing efforts connect to revenue.
Here is your quick checklist before you start: inventory all touchpoints and data sources, define conversion events with revenue values, connect data sources into a unified platform, select an attribution model that matches your business, build visual journey maps of common paths, and create action plans based on insights.
The marketers who master this process stop guessing about what works and start scaling with precision. They allocate budgets based on data rather than assumptions. They feed better signals to ad platforms, which improves algorithmic optimization. They identify winning patterns and double down on what actually drives results.
Your next step: begin with the audit in Step 1 and work through each phase systematically. Do not try to implement everything at once. Each step builds on the previous one, and rushing through the foundation will undermine everything that comes after.
Take the time to get your data infrastructure right. Define your conversion events clearly. Choose attribution models thoughtfully. The upfront investment pays dividends every time you make a marketing decision based on accurate, complete data instead of fragmented guesses.
Ready to elevate your marketing game with precision and confidence? Discover how Cometly's AI-driven recommendations can transform your ad strategy. Get your free demo today and start capturing every touchpoint to maximize your conversions.


