
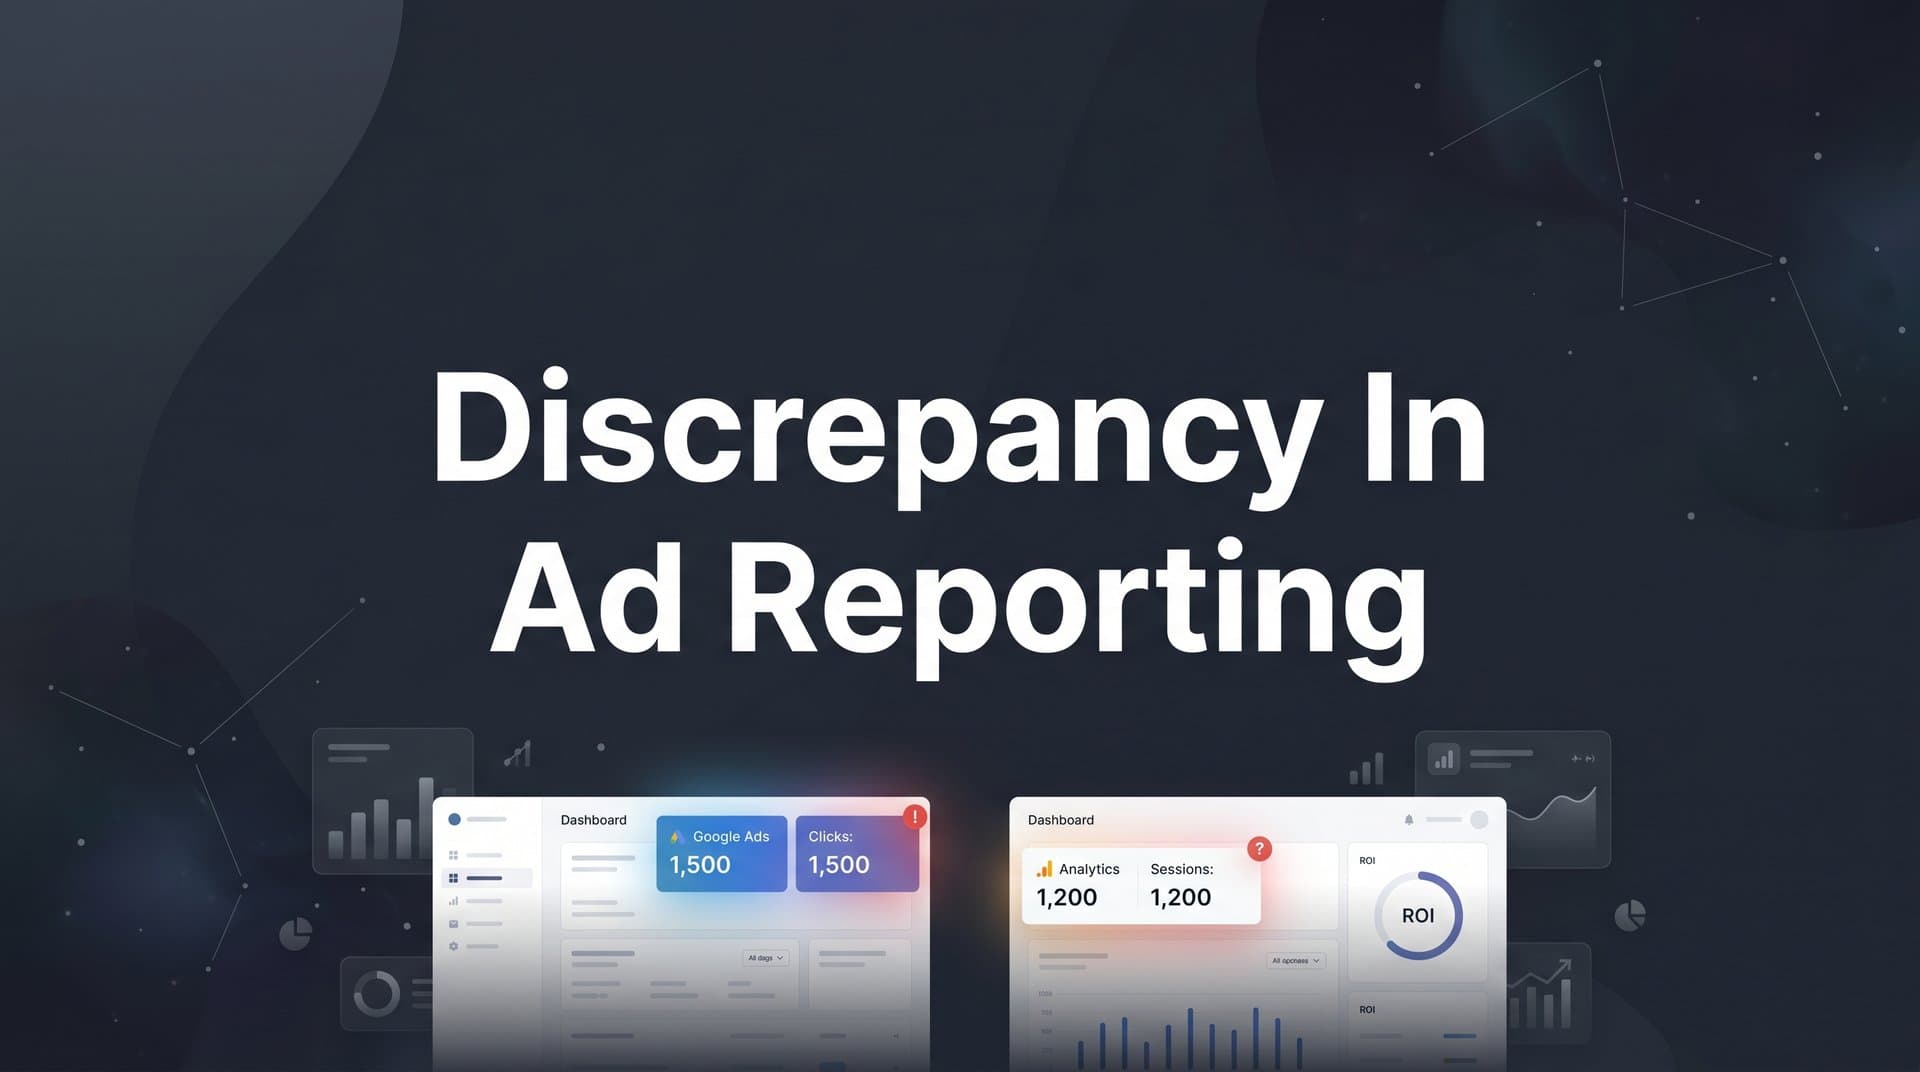
If your Facebook Ads dashboard shows 50 conversions but your CRM only logged 30, you have a reporting discrepancy. This gap is not just a numbers problem. It distorts your understanding of which campaigns are working, leads to misallocated budget, and undermines every optimization decision your team makes.
For B2B SaaS marketing teams, where a single closed deal can be worth thousands of dollars in ARR, inaccurate ad reporting is a serious operational risk. When your data lies to you, even subtly, you end up scaling campaigns that are not actually performing and cutting ones that are quietly driving pipeline.
The good news is that discrepancies in ad reporting happen for predictable, fixable reasons. Mismatched attribution windows, broken pixel tracking, inconsistent UTM parameters, and platform-level data modeling differences are the usual suspects. Once you understand the root cause, you can resolve it systematically and build a reporting foundation that stays accurate over time.
This guide walks you through a clear, repeatable process for diagnosing and resolving ad reporting discrepancies. You will learn how to audit your tracking setup, align attribution windows across platforms, standardize your UTM structure, implement server-side tracking, and establish a single source of truth for your marketing data.
Whether you are seeing gaps between Meta and Google, between your ad platforms and your CRM, or between your analytics tool and your revenue data, the steps below will help you close those gaps and make confident, data-driven decisions.
Step 1: Identify Where the Discrepancy Lives
Before you fix anything, you need to know exactly which data sources are disagreeing and by how much. Jumping straight into troubleshooting without this step is like trying to fix a leak without knowing which pipe is broken.
Start by pulling conversion data from every relevant source for the same date range: your ad platforms (Meta, Google, LinkedIn), your analytics tool (Google Analytics 4 or similar), and your CRM. Put them side by side in a spreadsheet. Use the same time period, the same conversion event definition, and the same date range for every source.
Once you have the numbers in front of you, categorize the type of discrepancy you are dealing with. There are three common types:
Volume gap: Different platforms are reporting different total conversion counts for the same period. For example, Meta reports 80 leads while your CRM shows 45.
Attribution gap: The same conversions exist across systems, but they are being credited to different campaigns or channels. A lead that your CRM attributes to organic search might be claimed by a Meta retargeting campaign because the user saw an ad within the attribution window.
Timing gap: The same events are recorded but on different dates. This often happens when ad platforms use impression date attribution while your CRM records the actual conversion date.
Document the gap percentage for each source pairing. If Meta is reporting 60 conversions and your CRM shows 40, that is a 50% gap, which is significant and worth investigating urgently. Note which platform is consistently reporting higher numbers, because this signals the likely cause.
A common pattern to watch for: if your ad platform consistently reports more conversions than your CRM, over-counting or misattribution is likely the culprit. This could mean duplicate pixel fires, view-through attribution inflating counts, or attribution windows that are too broad. On the other hand, if your analytics tool is reporting fewer conversions than your CRM, you are probably losing data due to ad blockers, UTM stripping, or tracking gaps on specific pages. Understanding Facebook Ads reporting discrepancies in particular can help you pinpoint the most common sources of over-counting.
This diagnostic step gives you a clear starting point. You are not guessing at the problem. You have a documented gap, a direction of the discrepancy, and a hypothesis about the cause. Everything in the next steps flows from this foundation.
Step 2: Audit Your Pixel and Event Tracking Setup
Pixel and event tracking errors are responsible for a large share of ad reporting discrepancies. The good news is they are also among the most straightforward to diagnose once you know where to look.
Start with the diagnostic tools built into each platform. Install the Meta Pixel Helper Chrome extension and visit your key landing pages, thank-you pages, and conversion URLs. The extension will tell you whether your pixel is firing, which events are triggering, and whether there are any errors. For Google, use Google Tag Assistant to verify that your tags are loading correctly and firing on the right pages.
One of the most common causes of inflated conversion counts in ad platforms is duplicate pixel installations. This happens when a pixel is hardcoded directly into the page AND also firing through Google Tag Manager. The result is two conversion events recorded for every one actual conversion. Check your source code and your tag manager simultaneously to confirm you are not running both. If you are unclear on how tracking pixels work at a fundamental level, understanding what a tracking pixel is and how it works can clarify why these misconfigurations happen.
Next, verify that your conversion events are mapped correctly. A lead event should fire exactly once per form submission, not on every page load. A common misconfiguration is setting a page view event on a thank-you page as the conversion trigger, which works fine until someone refreshes the page or visits it multiple times, generating phantom conversions.
Test your tracking in real time. Submit a test form or complete a test action on your site, then immediately check your platform's event manager to confirm the event appeared with the correct parameters. Meta's Events Manager and Google Ads' conversion tracking both have real-time event testing features that make this straightforward.
Also look for missing events on thank-you pages or post-conversion URLs. If your thank-you page is hosted on a subdomain or a third-party tool like Calendly or HubSpot, your pixel may not be present there at all. This causes under-reporting in your analytics tool and creates a gap relative to your CRM, which captures the lead regardless of where it came from.
If you are using Google Tag Manager, audit your triggers carefully. Look for triggers set to "All Pages" that should be scoped to specific pages, and check for duplicate tags that fire the same event under slightly different conditions. A single misfired trigger can skew your conversion data significantly over time.
By the end of this step, you should know whether your pixel is firing correctly, whether any events are duplicated or missing, and whether your conversion definitions match what you actually want to measure.
Step 3: Align Attribution Windows Across All Platforms
Attribution windows are one of the most misunderstood sources of discrepancy in ad reporting. They define how long after an ad interaction a conversion gets credited to that ad, and different platforms use different defaults without making this obvious.
Here is the core problem: Meta defaults to a 7-day click and 1-day view attribution window. Google Ads defaults to a 30-day click window. LinkedIn uses a 30-day click and 7-day view window by default. When you compare conversion numbers across these platforms without accounting for these differences, you are comparing apples to oranges. The same conversion event can be claimed by all three platforms simultaneously, each under its own logic. Reviewing the most common ad attribution models will help you understand why each platform reaches different conclusions from the same underlying data.
The practical fix is to set a consistent attribution window across all platforms you are comparing. For most teams doing cross-platform reporting, 7-day click only is a reasonable standard. It captures the most directly attributable conversions without inflating counts through long windows or view-through credits.
View-through attribution deserves special attention. When Meta's default 1-day view window is active, any user who saw your ad (without clicking) and then converted within 24 hours gets counted as a Meta conversion. This is a legitimate signal for brand awareness campaigns, but it systematically inflates Meta's conversion count relative to click-only models used in most analytics tools and CRMs. If you are comparing Meta to Google Analytics, you need to either turn off view-through attribution in Meta or understand that the difference is intentional and expected.
For B2B SaaS companies with longer sales cycles, the window question becomes even more important. If your average time from first touch to closed deal is 45 days, a 7-day click window will miss a significant portion of your actual conversions. Consider whether your current windows even capture the full conversion path, and adjust them to reflect your actual B2B customer journey.
Once you have decided on a standard window, document it. Write down the exact settings for each platform and make sure every team member uses those same settings when pulling reports. A reporting discrepancy that appears to be a data problem is often just two people pulling reports with different attribution window settings.
This step alone resolves a surprisingly large share of the gaps teams see between platforms. It does not require any technical changes, just deliberate alignment on how you define and measure attribution across your stack.
Step 4: Standardize UTM Parameters Across Every Campaign
UTM parameters are the connective tissue between your ad platforms and your analytics or CRM data. When they are inconsistent or missing, that connection breaks, and you lose the ability to trace conversions back to specific campaigns in any tool outside the ad platform itself.
Start with an audit of your current UTM structure. Pull a report from your analytics tool showing all traffic sources and campaign names from the past 90 days. Look for inconsistencies: campaigns tagged as "facebook" in some places and "meta" in others, mixed capitalization like "Google" versus "google," spaces in campaign names instead of hyphens, and missing parameters on some campaigns but not others.
These inconsistencies fragment your data. A campaign that should appear as one line item in your reports ends up split across multiple rows, making it impossible to see total performance at a glance. Following a structured approach to naming conventions for ad creative insights gives your team a reusable framework that prevents this fragmentation from the start.
Create a UTM naming convention document that every campaign builder follows. At minimum, it should cover:
Required parameters: Specify which of the five UTM parameters (source, medium, campaign, content, term) are required for every campaign and which are optional.
Capitalization rules: Use all lowercase to avoid data fragmentation. "Google" and "google" are treated as two different sources in most analytics tools.
Spacing rules: Always use hyphens instead of spaces or underscores. Spaces get encoded as "%20" in URLs, which can cause tracking issues in some tools.
Campaign naming structure: Define a consistent format such as channel-objective-audience-date so anyone on the team can identify a campaign from its UTM alone.
Next, check for UTM stripping. Some landing page redirects, third-party form tools, or website platforms strip UTM parameters before they reach your analytics tool. Test this by clicking a UTM-tagged link and checking whether the parameters appear in your analytics in real time. If they disappear, you have a stripping issue that needs to be resolved at the platform or redirect level.
Finally, verify that your CRM is capturing UTM data on lead records. This is critical for B2B SaaS teams. If your CRM does not store the original UTM parameters on each lead, you cannot trace closed-won revenue back to specific campaigns without relying solely on ad platform attribution. Most CRMs support hidden form fields that capture UTM values automatically. Make sure these are set up and working. A solid lead tracking process ensures UTM data flows cleanly from first click all the way through to your CRM records.
Step 5: Implement Server-Side Tracking to Close the Data Gap
Even with a perfectly configured pixel and consistent UTM parameters, browser-based tracking has a fundamental limitation: it depends on the user's browser cooperating. And increasingly, browsers are not cooperating.
Ad blockers, iOS privacy updates, and browser cookie restrictions have significantly reduced the reliability of client-side pixel tracking. When a user has an ad blocker installed or is on a privacy-focused browser, your pixel simply does not fire. The conversion happens, your CRM records it, but your ad platform never sees it. This is a major source of under-reporting in ad platforms relative to CRM data. The impact of iOS 14 on digital advertising marked a turning point that made server-side tracking a necessity rather than an option.
Server-side tracking solves this by sending conversion events directly from your server to ad platforms via APIs, bypassing the browser entirely. Meta's Conversion API (CAPI) and Google's Enhanced Conversions are the two primary implementations. Instead of relying on a JavaScript pixel in the user's browser, your server sends the event data directly to the platform after the conversion occurs.
The practical result is that even when a user's browser blocks your pixel, the conversion event is still recorded and attributed correctly. This closes the gap between your CRM (which records every lead) and your ad platforms (which previously only saw browser-trackable leads).
Server-side events also improve the quality of data sent back to ad platforms. First-party data sent via server-side events is more durable and accurate than browser-based third-party cookie data. This improves the platform's machine learning models, which in turn improves audience targeting and ad optimization over time.
One critical detail: if you run both your browser pixel and server-side events simultaneously (which is recommended for maximum coverage), you must implement event deduplication. Without deduplication parameters, the same conversion will be counted twice, once from the browser and once from the server. Both Meta and Google support deduplication through event ID matching. Make sure your implementation includes this.
Setting up CAPI or Enhanced Conversions manually requires engineering resources and API knowledge. Platforms like Cometly handle server-side event tracking natively, connecting your ad platforms, CRM, and website to ensure every touchpoint is captured without requiring custom API development. This is particularly valuable for marketing teams that do not have dedicated engineering support for tracking infrastructure.
Step 6: Build a Single Source of Truth for Ad Reporting
Here is the uncomfortable truth about ad reporting: if you are pulling reports directly from Meta, Google, and your CRM separately, you will always get different numbers. Not because something is broken, but because each platform uses its own attribution logic, its own conversion definitions, and its own rules for claiming credit.
This is the root cause of most ongoing reporting discrepancies. It is not a technical failure. It is a structural one. Without one authoritative data source that applies consistent rules across all channels, reconciling your numbers is a manual, error-prone process that consumes time your team should be spending on optimization.
A marketing attribution platform solves this by aggregating data from all your ad channels, your CRM, and your website into one unified view. Instead of each platform applying its own logic, the attribution platform applies consistent attribution rules across all sources simultaneously. You can compare channel performance using the same attribution model, the same date range, and the same conversion definitions, regardless of which platform the traffic came from.
This matters especially for B2B SaaS teams measuring pipeline and revenue, not just leads. When you can connect ad spend to CRM pipeline stages and closed-won revenue, you get a fundamentally different and more accurate picture of ROI than what any individual ad platform can show you. Teams that invest in B2B revenue attribution software gain the ability to tie marketing spend directly to closed deals rather than relying on platform-reported conversion estimates.
Cometly connects your ad platforms, CRM, and revenue data, including Stripe, to show exactly which ads and channels are driving pipeline and closed-won revenue. Instead of reconciling numbers across five different dashboards, your team has one place to make budget decisions, compare campaigns, and report performance to leadership.
To make this work in practice, your team needs to agree on a source hierarchy. Define which platform is the official record for marketing performance reporting. Use your attribution platform for budget decisions, channel comparisons, and ROI reporting. Use individual ad platform dashboards only for platform-specific optimization tasks like creative testing or audience management.
Document this agreement and make sure every stakeholder who touches marketing data knows which source to use and why. This eliminates the situation where one team member pulls from Meta, another pulls from GA4, and leadership gets two different numbers in the same meeting.
Putting It All Together: Your Discrepancy Resolution Checklist
Resolving a discrepancy in ad reporting is not a one-time fix. It is an ongoing data hygiene practice that requires periodic audits, consistent standards, and the right infrastructure. Here is a quick-reference summary of the six steps to run whenever a new discrepancy appears:
Step 1: Locate the gap. Compare conversion data across all platforms for the same date range. Categorize the discrepancy as a volume gap, attribution gap, or timing gap, and document the percentage difference.
Step 2: Audit your pixel and event tracking. Use Meta Pixel Helper and Google Tag Assistant to verify correct firing. Check for duplicate pixels, misfired triggers, and missing events on conversion pages.
Step 3: Align attribution windows. Set a consistent window across all platforms you are comparing. Document the setting and make sure every team member uses it when pulling reports.
Step 4: Standardize UTM parameters. Create and enforce a naming convention. Check for UTM stripping on redirects and form tools. Verify that your CRM is capturing UTM data on every lead record.
Step 5: Implement server-side tracking. Set up Meta CAPI or Google Enhanced Conversions to recover lost signal from ad blockers and browser restrictions. Use event deduplication to prevent double-counting.
Step 6: Build a single source of truth. Use a marketing attribution platform to apply consistent attribution logic across all channels. Define a source hierarchy and stick to it as a team.
Accurate ad reporting is a competitive advantage for B2B SaaS marketing teams. When your data is reliable, you can scale what is working, cut what is not, and defend your budget decisions with confidence. The teams that get this right are not just better at reporting. They are better at growing.
If you want to eliminate the manual reconciliation work and build a reporting foundation that stays accurate at scale, Get your free demo of Cometly today. See how it connects your ad platforms, CRM, and revenue data into one unified view so your team always knows exactly which campaigns are driving results.


