Most marketing teams are drowning in ad data but starving for insight. You can see impressions, clicks, and cost-per-click across a dozen platforms, yet still cannot answer the question that actually matters: which ads are driving revenue?
This guide to ad performance analysis is built for B2B SaaS marketers and growth teams who want to move beyond vanity metrics and build a repeatable system for measuring what works. You will learn how to define the right metrics for your goals, set up reliable tracking infrastructure, analyze performance across channels, apply attribution models correctly, and turn your findings into confident budget decisions.
Whether you are managing Google Ads, Meta campaigns, LinkedIn, or a mix of paid channels, the same analytical framework applies. The difference between teams that scale efficiently and those that waste budget on underperforming campaigns often comes down to process.
Ad performance analysis is not a one-time audit. It is a structured, ongoing practice that connects your ad spend to pipeline and revenue. When done well, it tells you not just what happened, but why it happened and what to do next.
Think of it like running a business review versus checking a dashboard. Checking a dashboard tells you numbers. Running a structured review tells you what those numbers mean and what action to take. That distinction is what separates teams that manage campaigns from teams that manage growth.
By the end of this guide, you will have a clear, actionable process for auditing your current ad performance, identifying what is working and what is not, and making data-driven decisions that improve ROI across every paid channel you run. Let's get into it.
Step 1: Define Your Performance Goals and KPIs
Before you pull a single report, you need to know what you are measuring and why. This sounds obvious, but it is the step most teams skip, and it causes everything downstream to fall apart.
There is a meaningful difference between activity metrics and outcome metrics. Activity metrics like clicks, impressions, and cost-per-click tell you what your ads are doing mechanically. Outcome metrics like pipeline generated, cost per qualified lead, and revenue attributed tell you whether your ads are actually working for the business.
For B2B SaaS teams, outcome metrics are what matter. Optimizing for CTR when your real goal is demo bookings is one of the most common and costly mistakes in paid media. A high click-through rate on an ad targeting the wrong audience is not a win. It is a budget drain with a flattering number attached to it.
The right approach is to map your KPIs to funnel stage. Here is how that typically breaks down:
Top-of-funnel campaigns: Focus on reach, engagement, and cost per new visitor or new audience member. These campaigns build awareness, so volume and efficiency of reach are the relevant signals.
Mid-funnel campaigns: Look at cost per content download, cost per webinar registration, or cost per retargeting engagement. These campaigns nurture intent, so lead quality and progression matter more than raw click volume.
Bottom-of-funnel campaigns: Prioritize cost per qualified lead, cost per opportunity created, and cost per demo or trial signup. These campaigns are closest to revenue, so every dollar should be evaluated against pipeline impact.
For B2B SaaS specifically, the metrics that carry the most weight are cost per qualified lead, cost per opportunity, and pipeline influenced. These connect directly to what your sales team and leadership actually care about. Understanding the full landscape of digital marketing performance metrics helps you choose the right standards for each campaign type.
Set a primary KPI per campaign type before you start analyzing. This keeps your review focused. When you have too many metrics competing for attention, analysis becomes noise. One primary KPI per campaign type gives you a clear standard for judgment.
Document your KPI targets before you pull any data. If you define success after seeing the numbers, you are rationalizing, not analyzing. Write down your benchmarks first, then evaluate performance against them.
Step 2: Audit Your Tracking Setup Before You Analyze Anything
Here is a rule worth printing and pinning to your monitor: garbage in, garbage out. If your tracking is broken or inconsistent, every analysis you run will produce misleading conclusions that lead to wrong budget decisions. Fixing your data foundation is not optional. It is the prerequisite for everything else.
Start by verifying that your pixel or tag implementation is firing correctly on all key conversion pages. This means your thank-you pages, demo confirmation pages, trial signup completions, and any other page that represents a meaningful action. Use a tag debugging tool or your ad platform's diagnostics to confirm events are triggering as expected.
Next, check for event deduplication issues. If you are using both a client-side pixel and server-side tracking simultaneously, which is increasingly common and recommended, you need to ensure the same conversion is not being counted twice. Duplicate conversion events inflate your reported numbers and make campaigns look more efficient than they actually are.
Server-side tracking via Conversion APIs has become essential for accurate data collection. Meta's Conversion API and Google's Enhanced Conversions fill the gaps that browser-based tracking leaves behind, gaps caused by ad blockers, browser privacy restrictions, and iOS privacy changes. If you are still relying entirely on client-side pixels, you are likely undercounting conversions and making budget decisions based on incomplete data.
UTM parameters deserve their own audit. Check that every campaign, ad set, and ad is tagged with consistent, structured UTM parameters. Inconsistent naming breaks your ability to filter and segment data reliably. A campaign tagged as "google-ads" in one place and "Google_Ads" in another creates two separate entries in your analytics, splitting the data and distorting your view of that channel's performance.
Validate that your CRM is receiving lead source data from your ad platforms. This is the bridge between your ad data and your revenue data. If leads are arriving in your CRM without source attribution, you cannot connect ad spend to pipeline, and the analysis you do in later steps will be incomplete.
The success indicator for this step is alignment between your ad platform reported conversions and your CRM lead counts. They will not match exactly, and they do not need to. But if your ad platform is reporting 200 conversions and your CRM shows 40 leads from that same period, something is wrong. That gap is telling you something important about your performance marketing tracking setup, and it needs to be resolved before you draw any conclusions from the data.
Step 3: Pull and Organize Your Performance Data
Once your tracking is verified, it is time to gather your data in a structured way. How you organize your data before analysis determines how much signal you can actually extract from it.
Start by establishing a consistent reporting window. Weekly data pulls work well for tactical optimization decisions. Monthly reviews are better suited for strategic comparisons. Quarterly audits give you the broad view needed to evaluate channel mix and budget allocation. Using inconsistent time windows makes it difficult to spot trends or compare performance meaningfully.
Pull data at three levels, and keep them distinct in your analysis:
1. Account level: Total spend, total conversions, overall cost per outcome, and return on ad spend. This gives you the macro view of whether your paid media investment is working overall.
2. Campaign level: Performance broken down by campaign, aligned to the goals you defined in Step 1. This tells you which campaign types and objectives are delivering against their intended purpose.
3. Ad level: Creative performance within campaigns. This is where you identify which messages, formats, and visuals are resonating with your audience and which are not.
Segment your data beyond just campaign groupings. Breaking performance down by channel, audience segment, device type, and placement often surfaces patterns that aggregate numbers hide completely. An ad that looks average overall might be performing exceptionally well on desktop and poorly on mobile. Without segmentation, you would never see that split.
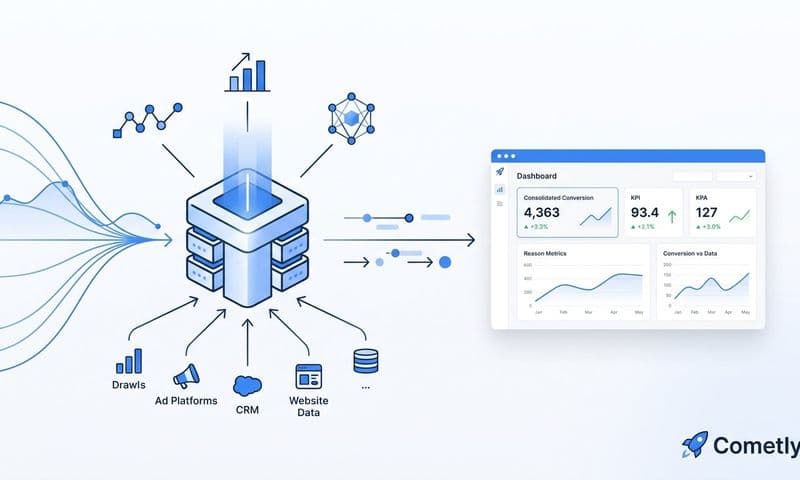
One of the biggest friction points for teams managing multiple paid channels is context-switching between platform dashboards. Pulling data from Google Ads, Meta, LinkedIn, and other channels separately and trying to compare them mentally is inefficient and error-prone. Consolidating cross-channel data into a single view is not a nice-to-have. It is a prerequisite for accurate multi-channel ad performance analysis.
Consistent naming conventions across your campaigns make filtering and grouping fast and reliable. If your campaigns are named inconsistently, sorting and comparing becomes manual and messy. A clear naming structure, such as including channel, audience type, funnel stage, and campaign type in the name, pays dividends every time you pull a report.
Finally, identify your top 20% of spend and confirm whether it is generating proportional results. In most accounts, a small number of campaigns consume the majority of budget. If that spend is not producing proportional pipeline or revenue, that is your highest-priority optimization opportunity.
Step 4: Apply the Right Attribution Model to Your Data
Attribution is where ad performance analysis gets both powerful and politically charged. The attribution model you choose changes which campaigns look like winners and which look like underperformers. Get this wrong and you will systematically defund the campaigns that are actually building your pipeline.
Here is a quick breakdown of the main models and what each one tells you:
Last-click attribution: Assigns 100% of credit to the final touchpoint before conversion. This is the default in many platforms and is deeply misleading for B2B SaaS, where buyers interact with multiple ads across weeks or months before converting. Last-click consistently undervalues awareness and mid-funnel campaigns that did the heavy lifting earlier in the journey.
First-touch attribution: Assigns 100% of credit to the first interaction. This is useful for understanding what initially brings prospects into your pipeline, but it ignores everything that happened between the first touch and the conversion.
Linear attribution: Distributes credit equally across all touchpoints. This is more balanced and works reasonably well for longer sales cycles where multiple campaigns contribute meaningfully throughout the journey.
Time-decay attribution: Gives more credit to touchpoints closer to the conversion, with earlier touchpoints receiving less. This model acknowledges the full journey but weights recent interactions more heavily.
Data-driven attribution: Uses actual conversion path data to assign credit based on measured influence. This is the most sophisticated model and requires sufficient conversion volume to produce reliable outputs, but it gives you the most accurate picture of what is actually driving results.
For B2B SaaS with multi-touch buyer journeys, multi-touch attribution models give a more accurate picture of what is driving pipeline than any single-touch model. The longer your sales cycle, the more misleading last-click attribution becomes.
A practical approach is to run your data through two or three models before making budget decisions. Compare how your channel rankings shift between last-click and a multi-touch model. If LinkedIn drops from third to first when you switch from last-click to linear attribution, that tells you LinkedIn is doing meaningful work earlier in the funnel that last-click was not crediting.
The success indicator here is that your chosen attribution model aligns with your actual sales cycle length and reflects the full customer journey. If your average deal takes three months to close and involves eight touchpoints, a model that only credits the last interaction is not giving you an accurate picture. Choose the model that fits your reality, not the one that is easiest to set up.
Step 5: Diagnose What Is Working and What Is Draining Budget
This is the diagnostic step where analysis turns into insight. With your data organized and your attribution model applied, you can now identify your true performers and your budget drains with precision.
Start by sorting campaigns by cost per outcome, not cost per click. Cost per click tells you how efficiently you are buying traffic. Cost per qualified lead or cost per opportunity tells you how efficiently you are buying pipeline. These are very different numbers, and optimizing for the wrong one leads you in the wrong direction.
Look for audience fatigue signals in campaigns that have been running for a while. Rising CPCs, declining CTR over time, and lower conversion rates on previously strong campaigns are all indicators that your audience has seen your ads too many times. Fatigue is not a campaign failure. It is a signal to refresh creative or expand your audience targeting.
Compare creative performance within the same audience segment. This isolates whether the message or the targeting is the variable driving performance differences. If two ads are running to the same audience and one dramatically outperforms the other, the creative is the differentiator. If all ads to a particular audience are underperforming, the audience itself may be the issue.
Pay close attention to campaigns with high click volume but low conversion rates. This pattern almost always signals an audience-offer mismatch. The ad is compelling enough to generate clicks, but when visitors land on your page, the offer does not match their expectations or intent. This is often a landing page issue as much as a targeting issue.
Flag any campaigns where ad platform reported conversions are high but CRM pipeline is low. This discrepancy is a common sign of either a tracking problem or low-quality traffic that is converting on your form but not qualifying as real pipeline. Both scenarios require investigation before you continue investing in those campaigns.
When benchmarking your performance, start with your own historical data. Comparing your current cost per lead to what you achieved three months ago is more meaningful than comparing it to an industry average from a source you cannot verify. Use external benchmarks as loose context, not as primary evaluation criteria. Reviewing campaign performance metrics over consistent time periods gives you the most reliable baseline for judgment.
One common pitfall worth calling out: pausing campaigns too early before they have accumulated enough data to evaluate statistically. Campaigns need sufficient conversion volume before you can draw reliable conclusions. Making optimization decisions based on a handful of conversions is as risky as ignoring the data entirely.
Step 6: Connect Ad Performance to Pipeline and Revenue
Clicks and conversions are inputs. Pipeline and revenue are the outputs that justify your ad spend. This step is where the analysis becomes truly valuable, and it is the step that most teams either skip entirely or execute poorly.
The goal is to map each campaign to its downstream impact on the business. That means tracking how many leads from a given campaign became qualified opportunities, and how many of those opportunities eventually closed. When you can see that path clearly, you can calculate the true ROI of every campaign with confidence.
For longer B2B sales cycles, closed-won revenue is a lagging indicator. A campaign you ran today may not produce closed revenue for three to six months. This is why tracking pipeline influenced and pipeline created are important leading indicators. They tell you whether your current campaigns are building the foundation for future revenue, even when closed deals have not yet materialized.
Calculating true ROI requires connecting your ad spend data with your actual revenue data. This means integrating your ad platforms with your CRM and, ideally, with your billing system. When you can compare ad spend against closed-won revenue attributed to each channel or campaign, you move from reporting on marketing activity to reporting on marketing impact. A structured approach to revenue attribution makes this connection systematic rather than manual.
Connecting ad data with Stripe or your CRM revenue data gives you a complete picture from first click to closed deal. This is the single most powerful capability a B2B SaaS marketing team can build into their analytics stack. Without it, you are making budget decisions based on proxies rather than outcomes.
This step is what separates teams that manage campaigns from teams that manage growth. When you know which channels are producing pipeline and revenue, and at what cost, budget allocation becomes a data-driven decision rather than an educated guess. You can confidently double down on what is working and pull back from what is not.
Step 7: Build a Repeatable Review and Optimization Cadence
Ad performance analysis is only valuable if it drives action on a consistent schedule. A one-time audit gives you a snapshot. A repeatable cadence builds institutional knowledge and compounds your optimization efforts over time.
Structure your review cadence across three time horizons:
Weekly review: Focus on spend pacing, early performance signals, and operational health. Check that you are on track with budget, flag any campaigns that are significantly underperforming or overspending, and confirm that tracking is intact. This review should be fast and tactical, not a deep analytical session.
Monthly review: Compare channel performance over the full month, evaluate attribution model outputs, and adjust budget allocation based on what the data is showing. This is where you make meaningful optimization decisions, such as shifting spend between channels, pausing underperformers, or increasing investment in campaigns that are generating strong pipeline.
Quarterly review: Step back and audit your full attribution setup, revisit your KPI targets to make sure they still reflect your business goals, and evaluate whether new channels or audience segments are worth testing. This is your structural review, the one where you assess whether your overall approach is still aligned with where the business is going.
Document your findings and decisions at every level of review. When you write down what you observed, what you decided, and why, your team builds institutional knowledge that survives personnel changes and informs future decisions. Without documentation, you repeat the same analysis from scratch every quarter.
AI-driven recommendations are increasingly valuable in this cadence. Modern attribution platforms can surface performance patterns in your data that manual review would miss, especially when you are managing campaigns across multiple channels with large volumes of data. Use those recommendations as a starting point for your review, not a replacement for human judgment.
Feeding enriched, first-party conversion data back to your ad platforms also improves the quality of your optimization over time. When Meta, Google, and LinkedIn receive better conversion signals from your campaigns, their algorithms improve targeting quality and reduce wasted spend. This is a compounding benefit: better data in means better performance out. Teams that invest in improving campaign performance with analytics consistently outpace those relying on platform defaults alone.
The success indicator for this step is straightforward. Your optimization decisions should be grounded in revenue data, not just platform metrics. If your weekly review consists of checking CTR and adjusting bids, you are optimizing for the platform, not for the business. When your decisions are driven by cost per opportunity and pipeline influenced, you are managing growth.
Putting It All Together
Ad performance analysis is the foundation of every smart paid media decision. When you follow this process consistently, you stop guessing about which channels deserve more budget and start making decisions backed by pipeline and revenue data.
To recap the seven steps: define your KPIs, verify your tracking, organize your data, apply the right attribution model, diagnose performance gaps, connect ads to revenue, and build a repeatable review cadence. Each step builds on the last. Skip one and your analysis loses accuracy. Follow all seven and you create a system that compounds over time.
The teams that scale paid media efficiently are not the ones with the biggest budgets. They are the ones with the clearest picture of what is working and the discipline to act on it consistently.
Cometly is built to support exactly this kind of analysis. It connects your ad platforms, CRM, and website into a single source of truth, tracks every touchpoint from first ad click to closed-won revenue, and gives your team AI-driven recommendations to scale what is working. From multi-touch attribution to Stripe revenue integration, it gives you the complete picture that platform dashboards alone cannot provide.
If your current setup makes any of these steps harder than it should be, that is the problem worth solving first. Get your free demo today and start capturing every touchpoint to maximize your conversions.