Most B2B SaaS marketing teams are sitting on a mountain of data and still making decisions based on gut feel. The problem is not a lack of data. It is a lack of structure around how that data gets collected, interpreted, and acted on.
Marketing analytics best practices exist to solve exactly that problem. This guide walks you through a clear, sequential process for building an analytics foundation that connects your ad spend to real pipeline and revenue.
Whether you are running paid campaigns across Meta, Google, and LinkedIn, or trying to understand which content channels actually convert, these steps will help you move from fragmented reporting to a single, reliable source of truth.
By the end, you will know how to define the right metrics, set up accurate tracking, choose attribution models that reflect your actual buyer journey, and use your data to make confident decisions about where to invest your marketing budget.
Each step builds on the last, so work through them in order. The goal is not to collect more data. The goal is to collect the right data, trust it, and use it to grow faster.
Step 1: Define Your Marketing Goals and KPIs Before Touching Any Data
Before you open a single dashboard or adjust a tracking pixel, you need to answer one question: what does success actually look like for your business this quarter? It sounds obvious, but most teams skip this step and end up optimizing for metrics that feel good but do not move the business forward.
Start with business outcomes and work backward. If your company needs to generate a certain amount of new ARR this quarter, trace that back to the pipeline required, the number of qualified opportunities needed, and the volume of leads that historically convert to those opportunities. That reverse-engineering exercise tells you which marketing KPIs actually matter for your stage and model.
The distinction between vanity metrics and performance metrics is critical here. Impressions, follower counts, and raw click volume are easy to report but hard to act on. Performance metrics like pipeline generated, cost per qualified lead, and revenue attributed to marketing are harder to pull together but directly connected to business outcomes. Build your framework around the latter.
Your KPI framework also needs to match your sales motion. A sales-led SaaS company with a long enterprise cycle tracks very different signals than a product-led growth model where free-to-paid conversion is the core loop. Make sure your metrics reflect how your business actually acquires and retains customers.
Avoid metric overload: Focus on three to five core metrics per channel and one or two north star metrics at the program level. When everything is a priority, nothing is.
Document your definitions: Create a shared reference document that defines each KPI in plain language. What counts as a qualified lead? When does an opportunity get created? How is revenue attributed to marketing? If marketing, sales, and leadership all interpret these terms differently, your reporting will never align.
Align across teams: One of the most common breakdowns in B2B analytics happens when marketing and sales define key terms differently. "Lead," "qualified lead," and "opportunity" should have consistent definitions across both teams and should be tracked consistently in your CRM.
The success indicator for this step is simple: every team member can answer "what does success look like this quarter?" with the same answer. If you get three different responses from three different people, you are not ready to move on yet.
Step 2: Audit and Clean Up Your Tracking Infrastructure
Here is a hard truth: most marketing teams assume their tracking is working because data is coming in. But data being present and data being accurate are two very different things. Before you build any analysis on top of your current setup, you need to know what you are actually measuring.
Start by inventorying every tracking touchpoint you currently have. That includes browser pixels, UTM parameters on your ads and links, form submission events, CRM event triggers, and any server-side integrations you have running. Map them all out in a single document so you can see the full picture.
Then look for gaps. Common ones include form submissions that fire a page view but not a conversion event, ad clicks that lose attribution before the lead reaches your CRM, and landing pages that load slowly enough that the pixel fires inconsistently. Each of these gaps means conversions are being missed or misattributed.
UTM consistency is foundational: Inconsistent naming conventions create fragmented channel data that makes comparison unreliable. If your campaigns use "Facebook," "facebook," and "fb" interchangeably as UTM sources, your channel reports will show three separate sources instead of one. Establish a naming convention document and enforce it across every campaign and every team member who creates links.
Check for duplicate events: Duplicate conversions inflate your reported numbers and mislead your optimization decisions. If a form submission fires both a pixel event and a server-side event without deduplication, you are counting that conversion twice. Most platforms use event IDs to match and deduplicate browser and server events, but you need to verify this is configured correctly.
Prioritize server-side tracking: Browser-based pixel tracking has become less reliable as ad blockers, browser privacy updates, and cookie restrictions reduce signal quality. Server-side tracking via Conversion APIs sends event data directly from your server to the ad platform, bypassing browser limitations entirely. This improves match rates and gives your ad platforms more accurate conversion data to optimize against. For Meta and Google specifically, running both pixel and CAPI in parallel with proper deduplication is the current best practice.
First-party data is your foundation: As third-party cookies continue to be deprecated across browsers, first-party data collected directly from your own properties becomes increasingly valuable. CRM data, form submissions, and server-side events are all first-party signals that maintain accuracy independent of browser behavior. The more you rely on these signals, the more durable your tracking infrastructure becomes.
The success indicator for this step is a clean event log with no duplicate conversions and a consistent UTM structure across all active campaigns. If you can pull a channel report and trust that each source is being counted once and labeled correctly, your foundation is solid enough to build on.
Step 3: Connect Your Ad Platforms, CRM, and Revenue Data
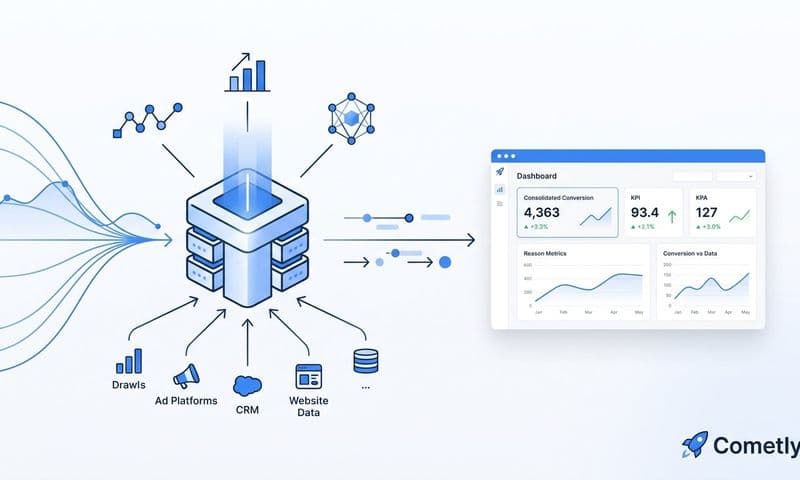
Siloed data is the root cause of most attribution failures in B2B SaaS marketing. Your ad platform reports show clicks and conversions. Your CRM shows leads and pipeline. Your billing system shows revenue. But if those three systems are not talking to each other, you are making budget decisions based on an incomplete picture.
The goal of this step is to map the full customer journey from first ad click through lead creation, opportunity stage progression, and closed-won revenue. When you can see that entire arc in one place, you stop optimizing for the metric that is easiest to measure and start optimizing for the one that actually matters.
Start by integrating your CRM with your ad platforms. This allows you to send offline conversion events, such as opportunity created or deal closed, back to Meta, Google, and LinkedIn so their algorithms can optimize toward leads that actually convert rather than just leads that enter the funnel. This is one of the highest-leverage moves you can make for improving paid acquisition efficiency over time.
Connect your revenue system: Integrating your billing platform, such as Stripe, with your marketing data closes the loop between ad spend and actual paying customers. Without this connection, you might be celebrating a channel that generates a high volume of trials but converts to paid at a fraction of the rate of another channel that generates fewer but higher-quality leads. The revenue connection reveals the true cost of customer acquisition for each channel.
Stop relying on ad platform self-reported data: Ad platforms have a natural incentive to show their own numbers in the best possible light. When you cross-reference ad platform conversion data against your CRM and revenue records, you often find meaningful discrepancies. The CRM is your source of truth for lead quality and pipeline. Your revenue system is your source of truth for customer acquisition. Use both to validate what the ad platforms are telling you.
Revenue attribution vs. lead attribution: Many marketing teams optimize for lead volume without understanding which leads actually convert to revenue. Connecting ad spend to closed-won revenue reveals the true ROI of each channel. A channel that generates twice the leads at half the close rate is not performing better; it is just louder.
This is where a platform like Cometly adds significant value. Cometly connects your ad platforms, CRM events, and Stripe revenue data into a single attribution view, so you can trace every dollar of spend back to its source without manually stitching together exports from five different systems. The result is one reliable place to answer the question: which channels are actually generating revenue?
The success indicator for this step is straightforward. You should be able to pull a single report showing ad spend by channel alongside pipeline created and revenue closed from that same channel. If you can do that, you have connected the data in a way that enables real decision-making.
Step 4: Choose the Right Attribution Model for Your Buyer Journey
Attribution models determine how credit for a conversion gets distributed across the touchpoints in a buyer's journey. There is no universally correct model, but there are models that are clearly wrong for B2B SaaS, and last-click attribution is at the top of that list.
Think about how a typical B2B SaaS buyer actually behaves. They might see a LinkedIn ad that introduces them to your product, read a blog post a week later, attend a webinar, and then convert through a branded Google search ad three weeks after that. Last-click attribution credits the Google search ad for the entire conversion and assigns zero value to every earlier touchpoint. That distorts your understanding of what is actually driving demand.
First-touch attribution swings to the other extreme, crediting only the first interaction. It is useful for understanding what creates awareness and brings new prospects into your funnel, but it ignores everything that happens between awareness and conversion.
Multi-touch attribution models distribute credit across the full journey. The main variants include linear (equal credit to every touchpoint), time decay (more credit to touchpoints closer to conversion), position-based (heavy weight on first and last touch with the middle distributed), and data-driven (machine learning assigns credit based on actual conversion path data). Each has tradeoffs depending on your sales cycle length, data volume, and the questions you are trying to answer.
For B2B SaaS with longer sales cycles, data-driven or position-based multi-touch models tend to reflect reality more accurately than rule-based single-touch models. Data-driven attribution, available in platforms like Google Ads, uses machine learning to assign credit based on actual conversion path patterns. It requires sufficient conversion volume to be statistically reliable, but when that threshold is met, it tends to outperform simpler rule-based approaches.
Run multiple models in parallel: During your first 60 to 90 days of proper attribution tracking, run several models simultaneously and compare the outputs. You will often find that a channel that looks strong under last-click looks weaker under multi-touch, or vice versa. This comparison period helps you understand how credit shifts across your channels before you commit to a primary model for optimization decisions.
Avoid model selection bias: The most common pitfall here is choosing an attribution model because it makes your best channel look good, rather than because it reflects actual buyer behavior. Your attribution model should produce insights that align with what your sales team observes anecdotally about which channels bring in better leads. If your model says LinkedIn drives no value but your sales team consistently hears about LinkedIn from new customers, your model needs revisiting.
The success indicator is alignment between your attribution model outputs and the qualitative signal from your sales team. When your data and your sales conversations are telling the same story, you have found a model worth trusting.
Step 5: Build Dashboards That Drive Decisions, Not Just Reports
A dashboard that nobody acts on is just a report with better formatting. The purpose of a marketing analytics dashboard is not to display data. It is to answer specific questions that lead to specific decisions. If your dashboard does not change what your team does next week, it is not doing its job.
Structure your dashboards by audience and decision type. A CMO or VP of Marketing needs a view centered on pipeline contribution and revenue attribution by channel. A channel manager needs campaign-level performance with spend, cost per lead, and pipeline created side by side. A creative strategist needs ad-level data showing which creatives are generating qualified engagement versus just cheap clicks. These are three different audiences with three different questions, and they need three different views.
Include the metrics that matter: For each channel view, include spend, impressions, clicks, cost per lead, pipeline created, and revenue attributed in a single consolidated layout. When these numbers live in separate tools or separate tabs, the friction of pulling them together means it rarely happens. When they are in one view, the comparison becomes automatic.
Set up automated alerts: Do not wait for your weekly review to discover that a campaign has been overspending, a conversion rate has dropped, or a budget is pacing to exhaust three days early. Configure alerts for performance anomalies, budget pacing issues, and conversion rate drops so your team catches problems before they compound into wasted spend.
Avoid dashboard sprawl: One well-maintained marketing analytics dashboard per audience is more valuable than a dozen partially complete ones. Every additional dashboard that gets created but not maintained becomes noise that erodes trust in your data. Keep your dashboard inventory lean and keep it current.
Pipeline velocity as a forward-looking signal: Consider adding pipeline velocity to your marketing dashboards. This metric measures how quickly leads move through your sales funnel and helps you identify which channels produce leads that close faster and at higher rates, not just leads that enter the funnel. It shifts your dashboard from purely historical to partially predictive.
The success indicator for this step is behavioral: your weekly marketing review meeting starts with the dashboard and produces at least one clear action item per channel. If your team leaves the meeting with a shared understanding of what is working, what is not, and what to do about it, your dashboards are doing their job.
Step 6: Use Your Data to Optimize Campaigns and Scale What Works
Analytics without action is just record-keeping. This is the step where your investment in tracking infrastructure, data integration, attribution modeling, and dashboards actually pays off. The goal is a continuous optimization loop that compounds over time.
Start by using your attribution data to identify your highest-performing channels by revenue generated, not just leads or clicks. A channel that generates a high volume of cheap leads but a low pipeline-to-revenue conversion rate is not your best channel. It is just your noisiest one. Reallocate budget toward channels and campaigns with the best pipeline-to-revenue conversion rates, even if their cost per lead looks higher on the surface.
Use AI-driven insights to surface what is working: Manually reviewing hundreds of ad creatives, audiences, and offer variations is not scalable. AI-driven analytics surfaces which combinations are generating the most qualified pipeline so your team can focus optimization energy where it matters most. This is especially valuable when you are running campaigns across multiple platforms simultaneously.
Feed enriched data back to your ad platforms: When you send enriched conversion data, including downstream events like opportunity created and closed-won, back to Meta, Google, and LinkedIn through CAPI integrations, you are giving those platforms' algorithms a much clearer signal of what a valuable conversion looks like. Over time, this improves algorithmic targeting and reduces your cost per acquisition as the platforms learn to find more of your best customers.
Run structured experiments: Optimization is not guesswork. Change one variable at a time, whether that is a creative, an audience, a bid strategy, or a landing page, and measure the impact against your defined KPIs. Document what you learn. The teams that build a written record of their experiments compound their learning much faster than teams that rely on memory and intuition.
Optimize for the right metric: The most common pitfall in this step is optimizing for the metric that is easiest to improve rather than the one that most closely correlates with revenue. It is always easier to lower your cost per click than to lower your cost per qualified lead. It is easier to increase lead volume than to increase pipeline quality. Keep your optimization decisions anchored to the north star metrics you defined in step one.
Track pipeline velocity as an optimization signal: As you reallocate budget and test new approaches, monitor how pipeline velocity changes by channel. Channels that produce leads that close faster are worth a premium even if their upfront cost per lead is higher. This metric helps you make smarter budget decisions that reflect the full value of each channel.
The success indicator for this step is directional improvement over time: your cost per qualified lead or cost per pipeline dollar decreases quarter over quarter as you apply learnings from your attribution data. That downward trend is evidence that your optimization loop is working.
Putting It All Together: Your Marketing Analytics Action Plan
These six steps form a complete system. Each one enables the next. You cannot trust your attribution model if your tracking infrastructure is broken. You cannot build useful dashboards if your data sources are not connected. You cannot optimize effectively if you do not have a clear definition of what you are optimizing toward. Work through the steps in sequence and the whole system compounds.
Here is your quick-reference checklist to keep progress visible:
Goals and KPIs defined: North star metrics documented, KPI definitions shared across marketing, sales, and leadership.
Tracking audited: UTM naming conventions enforced, duplicate events resolved, server-side CAPI active and deduplicating correctly.
Data connected: Ad platforms, CRM, and revenue system integrated into a single attribution view.
Attribution model selected: Multi-touch model chosen based on your buyer journey, validated against sales team observations.
Dashboards built: Audience-specific views live, automated alerts configured, weekly review process running.
Optimization loop running: Budget reallocated toward highest-revenue channels, enriched conversion data flowing back to ad platforms, structured experiments documented.
This is not a one-time setup. The highest-performing marketing teams run this as a continuous improvement cycle, measuring, generating insights, forming hypotheses, testing, and reallocating. That loop compounds over time and creates a durable advantage in paid acquisition efficiency.
Cometly is built to handle steps two through six in a unified system. Instead of stitching together separate tools for tracking, attribution, and reporting, Cometly connects your ad platforms, CRM, and revenue data into one place, surfaces AI-driven recommendations, and sends enriched conversion signals back to your ad platforms automatically. It is designed specifically for B2B SaaS teams that want accurate attribution without the overhead of managing a custom data stack.
Start with step one this week. Define your goals, align your team on KPI definitions, and document your north star metrics. Then use Get your free demo to accelerate everything that follows. Accurate attribution is not a nice-to-have for teams trying to scale paid acquisition efficiently. It is the foundation everything else is built on.