Startups live and die by their marketing decisions. With limited budgets, lean teams, and investors watching every dollar, you cannot afford to spend on channels that don't convert. The problem is that most marketing analytics tools are either too expensive, too complex, or built for enterprise teams with dedicated data engineers.
The right analytics stack for a startup looks different. You need tools that are fast to set up, affordable to maintain, and clear enough that a two-person marketing team can act on the data without a PhD in statistics. You need insights that connect ad spend to actual revenue, not just traffic metrics that look good in a slide deck.
To build this list, we evaluated tools based on startup-friendliness, pricing flexibility, depth of actionable insights, and integration capabilities. Whether you're running paid ads, tracking product behavior, or trying to understand why users drop off, there's a tool here for your stage. Cometly leads the list for teams serious about attribution accuracy, and you'll find strong options across every category below.
1. Cometly
Best for: Startups running paid ads who need accurate attribution across every channel and platform.
Cometly is an AI-powered marketing attribution platform that connects your ad platforms, CRM, and website to show exactly which ads and channels drive leads and revenue.
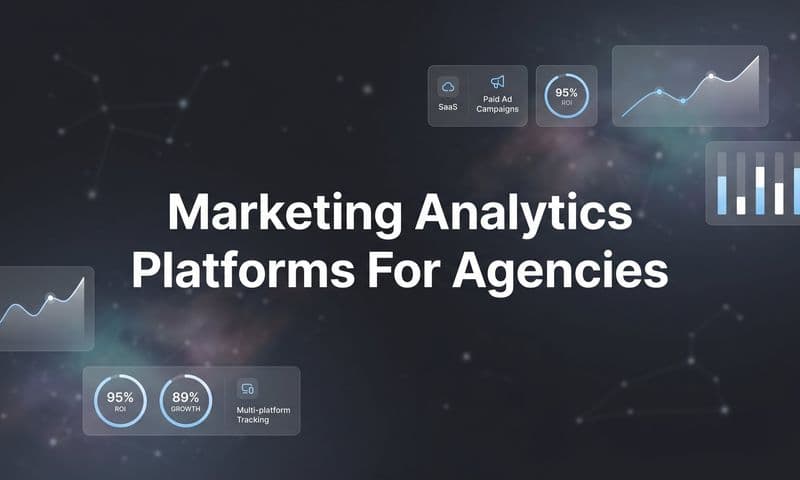
 9 Best Marketing Analytics Tools for Startups in 2026
Where This Tool Shines
For startups investing in paid advertising, inaccurate attribution is one of the most expensive problems you can have. If your data tells you Facebook is driving conversions when it's actually Google, you'll keep pouring budget into the wrong place. Cometly solves this by tracking the complete customer journey in real time, from first ad click through to closed revenue, using server-side tracking that goes beyond what browser-based tools can capture.
What sets Cometly apart for growth-stage teams is the AI layer on top of the data. Instead of staring at dashboards trying to figure out what to do next, Cometly's AI surfaces recommendations on which ads and campaigns are performing, which ones are wasting budget, and where to scale. It also feeds enriched conversion data back to Meta, Google, and other ad platforms so their algorithms can optimize more effectively. This is the kind of multi-touch attribution that used to require an enterprise data team.
Key Features
Multi-Touch Attribution: Tracks every touchpoint across all ad platforms and marketing channels to give you a complete view of what drives conversions.
AI-Powered Recommendations: Identifies top-performing ads and campaigns across every channel so you can scale what works and cut what doesn't.
Server-Side Tracking: Collects accurate data beyond browser limitations caused by ad blockers, iOS changes, and cookie restrictions.
Conversion Sync: Sends enriched, conversion-ready events back to Meta, Google, and other platforms to improve their targeting and optimization algorithms.
AI Chat: Lets you ask natural language questions about your marketing data and get instant, actionable answers without building custom reports.
Best For
Startups and growth-stage companies running paid advertising across multiple channels who need reliable attribution data to make smarter budget decisions. Particularly valuable for teams that have felt the pain of inaccurate tracking after iOS privacy changes.
Pricing
Custom pricing based on ad spend. Request a demo directly on the Cometly website to get details tailored to your team's scale and needs.
2. Google Analytics 4
Best for: Startups building a foundational analytics layer for website and app tracking at zero cost.
Google Analytics 4 is Google's event-based analytics platform for tracking user behavior, traffic sources, and conversions across websites and apps.
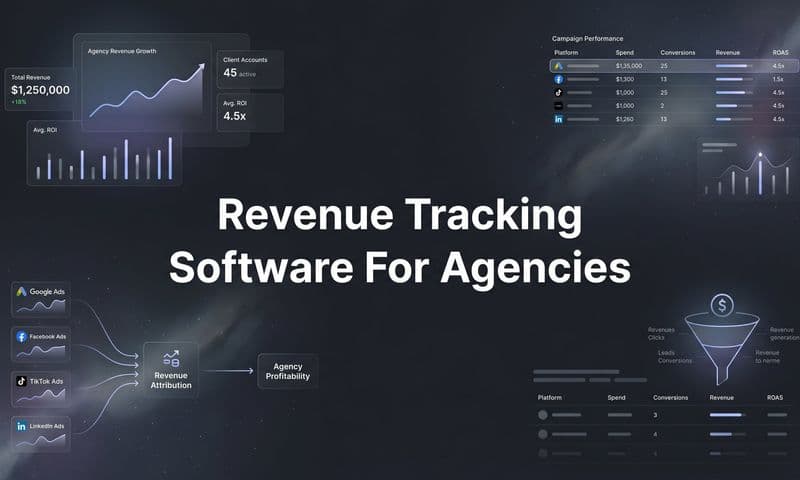
 11 Best Marketing Analytics Tools to Track and Optimize Campaign Performance in 2026
Where This Tool Shines
For most startups, GA4 is the first analytics tool they install, and for good reason. It's free, it integrates directly with Google Ads, and its event-based tracking model gives you flexibility to measure almost anything users do on your site or app. The learning curve is real, but the depth of data available at no cost is genuinely impressive.
GA4's machine learning features add a layer of intelligence that helps smaller teams punch above their weight. Predictive audiences, anomaly detection, and churn probability scores are built in, which means you don't need a data scientist to access predictive insights. For startups leaning heavily on Google's ad ecosystem, the native integration between GA4 and Google Ads is a significant advantage.
Key Features
Event-Based Tracking: Flexible measurement model that captures any user interaction you define, from button clicks to video plays.
Predictive Metrics: Machine learning models that forecast purchase probability and churn likelihood based on user behavior patterns.
Google Ads Integration: Deep connection to Google Ads for campaign-level performance analysis and audience sharing.
Exploration Reports: Custom analysis tools including funnel visualization, path exploration, and cohort analysis.
Free Tier: Covers the full feature set for most startup use cases with no cost barrier to entry.
Best For
Every startup should have GA4 installed as their baseline analytics layer. It's especially valuable for teams running Google Ads or investing in SEO, where the native integration provides direct campaign performance data.
Pricing
Free for standard use. GA4 360, the enterprise version, starts at approximately $50,000 per year, which is well outside typical startup budgets but irrelevant for most early-stage teams.
3. Mixpanel
Best for: Product-led growth startups that need deep funnel analysis, retention tracking, and user segmentation.
Mixpanel is a product analytics platform focused on understanding how users behave inside your app or website, with powerful tools for funnel analysis and cohort tracking.
 9 Best AI Marketing Analytics Tools in 2026
Where This Tool Shines
Where GA4 gives you a broad view of traffic and acquisition, Mixpanel goes deep on what happens after users arrive. If you want to understand why users drop off at step three of your onboarding flow, or which cohort of users has the highest 30-day retention, Mixpanel is built for exactly that kind of analysis. The interface is intuitive enough that non-technical team members can build meaningful reports without SQL.
The real-time, unsampled data is a meaningful differentiator. Many analytics tools apply sampling to large datasets, which can skew results. Mixpanel processes every event, which matters when you're making product decisions based on behavioral data.
Key Features
Funnel Analysis: Interactive funnel reports that show exactly where users drop off in any multi-step flow.
Retention Reports: Cohort-based retention tracking to understand how well your product keeps users engaged over time.
User Segmentation: Advanced filtering and cohort analysis to compare behavior across different user groups.
Flows: Visual user path analysis that shows the routes users take through your product.
Generous Free Plan: Up to 20 million monthly events at no cost, which covers most early-stage startups comfortably.
Best For
SaaS and app-based startups focused on product-led growth, improving activation rates, or reducing churn. Ideal for teams where product and marketing work closely together on growth metrics.
Pricing
Free plan available up to 20 million monthly events. Growth plan starts at $28 per month, with pricing scaling based on data volume and team size.
4. HubSpot Marketing Hub
Best for: Startups that want CRM and marketing analytics unified in a single platform with full-funnel visibility.
HubSpot Marketing Hub is an all-in-one marketing platform that combines CRM, email marketing, campaign management, and analytics in one place.
 9 Best Attribution Software for B2B SaaS in 2026
Where This Tool Shines
Most analytics tools show you what happened on your website. HubSpot connects that activity to named contacts and deals in your CRM, so you can see which marketing campaigns actually contributed to closed revenue. For B2B startups in particular, this kind of full-funnel visibility is extremely valuable when reporting to leadership or investors.
The consolidated platform approach also reduces tool sprawl, which is a real problem for lean startup teams managing too many disconnected systems. Having email analytics, landing page performance, social media data, and contact-level journey tracking all in one place saves time and reduces the risk of data gaps between tools.
Key Features
Unified CRM and Analytics: Connects marketing activity directly to contacts, deals, and revenue in a single platform.
Campaign Reporting: Campaign-level analytics with revenue attribution to show which efforts drive actual business outcomes.
Multi-Channel Analytics: Built-in reporting for email, landing pages, social media, and paid ads in one dashboard.
Contact Journey Tracking: Follows individual contacts from first touch through lead to customer across every interaction.
Free CRM Tier: Basic marketing analytics and CRM functionality available at no cost to get started.
Best For
B2B startups and growth-stage companies that want to connect marketing data to sales outcomes without stitching together multiple tools. Particularly strong for teams already using or planning to use HubSpot as their CRM.
Pricing
Free tools available. Starter plan at $20 per month. Professional plan at $890 per month, which includes more advanced reporting and automation features.
5. Amplitude
Best for: Product teams that need behavioral analytics, experimentation, and feature adoption tracking in one platform.
Amplitude is a behavioral analytics and experimentation platform designed for product teams who want to understand user behavior and test product decisions with data.
 9 Best Marketing Analytics Tools for Startups in 2026
Where This Tool Shines
Amplitude sits at the intersection of product analytics and experimentation. Beyond tracking what users do, it helps you understand why they do it and test whether your changes actually improve outcomes. The built-in A/B testing capabilities mean you don't need a separate experimentation tool, which is a real cost and complexity saving for early-stage teams.
Session replay adds qualitative context to quantitative data, letting you watch real user sessions to understand the friction points that numbers alone don't explain. The combination of cohort analysis, predictive analytics, and session replay gives product and marketing teams a comprehensive toolkit without requiring multiple platforms.
Key Features
Behavioral Cohort Analysis: Segments users by actions they've taken to compare engagement and retention across different groups.
Built-In Experimentation: A/B testing capabilities integrated directly into the analytics platform for faster iteration.
Session Replay: Watch real user sessions to add qualitative context to your quantitative behavioral data.
Predictive Analytics: Forecasts user behavior including likelihood to convert or churn based on behavioral signals.
Free Starter Plan: Generous event limits on the free tier make it accessible for startups from day one.
Best For
Product-focused startups and growth teams that want to combine analytics, experimentation, and user research in a single platform. Strong fit for teams running frequent product iterations who need fast feedback loops.
Pricing
Free Starter plan available. Plus plan starts at $49 per month. Growth plan is custom-priced for larger teams and data volumes.
6. Triple Whale
Best for: DTC ecommerce startups that need centralized ad attribution and creative performance data with deep Shopify integration.
Triple Whale is an ecommerce-focused analytics and attribution platform built specifically for direct-to-consumer brands running paid advertising through Shopify.
 7 Best Funnel.io Alternatives for Marketing Data Analytics in 2026
Where This Tool Shines
If you're running a Shopify-based DTC brand, Triple Whale was built for your exact workflow. It pulls together ad spend from Meta, Google, TikTok, and other channels alongside Shopify revenue data so you can see true ROAS and attribution in one place. The creative analytics feature is particularly useful for performance marketers who test many ad variations and need to quickly identify which creatives are driving the most efficient spend.
The centralized dashboard eliminates the painful process of jumping between ad platform dashboards and trying to reconcile numbers that never quite match. For lean ecommerce teams managing significant ad budgets, this kind of consolidated view directly translates to better and faster budget decisions.
Key Features
Shopify-Native Integration: Real-time revenue tracking connected directly to your Shopify store data.
Creative Analytics: Identifies top-performing ad creatives across platforms to inform your content and creative strategy.
Centralized Paid Media Dashboard: Consolidates spend, revenue, and ROAS data from all paid channels in one view.
Customer Journey Mapping: Tracks ecommerce customer journeys from first ad touch to purchase.
AI-Powered Insights: Automated spend recommendations and performance summaries to guide optimization decisions.
Best For
DTC ecommerce startups running paid advertising on Meta, Google, or TikTok with a Shopify store. Less relevant for B2B companies or startups not using Shopify as their primary commerce platform.
Pricing
Plans start around $100 per month, with pricing scaling based on your store's revenue volume. Best suited for brands with meaningful ad spend to justify the investment.
7. Databox
Best for: Startups that need a single reporting dashboard pulling data from multiple marketing tools for KPI tracking and investor reporting.
Databox is a reporting and dashboarding platform that pulls data from over 100 marketing and business tools into a single, customizable view.
Where This Tool Shines
Most startups use five to ten different marketing tools, each with its own dashboard. Databox solves the problem of fragmented reporting by pulling all of that data into one place. The pre-built dashboard templates mean you can get a professional-looking KPI dashboard running in hours rather than building custom reports from scratch.
The benchmark groups feature is a hidden gem for startups. It lets you compare your performance metrics against anonymized data from similar companies, giving you a reality check on whether your conversion rates, email open rates, or ad performance are competitive. That kind of peer context is hard to find elsewhere.
Key Features
100+ Native Integrations: Connects to the most popular marketing, sales, and analytics tools without custom development.
Pre-Built Templates: Ready-to-use dashboard templates for common marketing reports to accelerate setup.
Goal Tracking and Alerts: Set performance targets and receive automated alerts when metrics go off track.
Benchmark Groups: Compare your KPIs against anonymized data from similar companies in your industry.
Mobile App: Monitor key metrics on the go without needing to open a laptop.
Best For
Startup founders and marketing leads who need clean, consolidated reporting for internal reviews or investor updates. Also strong for agencies managing multiple client accounts who need efficient reporting workflows.
Pricing
Free plan available with limited connections. Professional plan starts at $59 per month, with higher tiers for larger teams and more data sources.
8. Hotjar
Best for: Startups that want to understand why users behave the way they do on their website through heatmaps and session recordings.
Hotjar is a qualitative analytics platform that uses heatmaps, session recordings, and user surveys to reveal the behavioral story behind your quantitative data.
Where This Tool Shines
Numbers tell you what is happening. Hotjar tells you why. When your analytics show a 70% drop-off on a landing page but you can't figure out the cause, watching a handful of session recordings often reveals the answer in minutes. A confusing form, a broken element on mobile, or a CTA that's buried below the fold becomes immediately obvious when you see real users interacting with your page.
For conversion rate optimization, Hotjar is one of the highest-leverage tools available at an accessible price point. The setup requires a single script tag, no engineering resources needed, and the insights translate directly into design and copy changes that improve performance.
Key Features
Heatmaps: Visual overlays showing where users click, scroll, and move their mouse across any page.
Session Recordings: Watch anonymized recordings of real user sessions to identify friction and confusion points.
On-Site Surveys: Collect user feedback directly on your website with targeted survey widgets.
Funnel and Form Analysis: Identify exactly where users abandon multi-step funnels or forms.
No-Code Setup: Install with a single script tag, no developer required for basic implementation.
Best For
Startups focused on improving website conversion rates, landing page performance, or user experience. Works best alongside a quantitative analytics tool like GA4 to pair the "what" with the "why."
Pricing
Free Basic plan available with limited recordings and heatmaps. Plus plan starts at $40 per month with expanded data limits and features.
9. Supermetrics
Best for: Data-savvy startup teams that want to build custom analytics workflows by pulling marketing data into spreadsheets, dashboards, or data warehouses.
Supermetrics is a data pipeline tool that extracts marketing data from over 100 platforms and delivers it to your preferred reporting destination.
Where This Tool Shines
Supermetrics isn't a dashboard tool in the traditional sense. It's a data connector that moves your marketing data from wherever it lives to wherever you want to analyze it. If your team does reporting in Google Sheets, Supermetrics can automatically pull in fresh data from Meta Ads, Google Ads, LinkedIn, and dozens of other platforms every morning without manual exports.
For startups with a technically comfortable marketer or a part-time analyst, Supermetrics unlocks a level of custom reporting that would otherwise require engineering work. You can blend data from multiple sources, apply your own formulas and logic, and build reports that match exactly how your business measures success rather than being constrained by a tool's pre-built templates.
Key Features
100+ Platform Connectors: Pulls data from virtually every major marketing and advertising platform available.
Flexible Destinations: Sends data to Google Sheets, Looker Studio, BigQuery, Excel, and other popular tools.
Automated Data Refresh: Schedules automatic data updates so reports always reflect current performance.
Data Blending: Combines metrics from multiple sources into unified reports for cross-channel analysis.
Report Templates: Pre-built templates for common marketing reports to reduce setup time.
Best For
Startups with a team member comfortable working in spreadsheets or data tools who want maximum flexibility in how they analyze and present marketing data. Less ideal for teams that want a ready-made dashboard out of the box.
Pricing
Starts at $39 per month per connector destination. Total cost varies based on the number of data sources and destinations you need, so it can add up quickly for teams pulling from many platforms.
Choosing the Right Analytics Stack for Your Startup
The biggest mistake startups make with analytics tools is trying to use all of them at once. Tool sprawl creates noise, eats into budget, and fragments your data across too many platforms. The better approach is to build a focused stack that matches your current stage and growth model.
Here's a practical way to think about it based on your priorities:
If you're running paid ads across multiple channels: Start with Cometly for attribution accuracy and GA4 for baseline web analytics. Accurate attribution data is the foundation of every good paid media decision, and these two tools together give you a complete picture of acquisition performance.
If you're a product-led SaaS startup: Pair GA4 with Mixpanel or Amplitude for product analytics. Add Hotjar when you need to understand behavioral friction on specific pages or flows.
If you're a DTC ecommerce brand on Shopify: Triple Whale handles attribution and creative performance well for your specific context. Layer in GA4 for SEO and organic traffic insights.
If you need clean reporting for investors or leadership: Databox or Supermetrics can consolidate data from your existing tools into polished dashboards without rebuilding your entire stack.
The most important thing is to start with attribution. If you don't know which channels and campaigns are driving real revenue, every other optimization is built on a shaky foundation. That's why Cometly belongs at the center of any startup's paid marketing analytics setup. It connects your ad platforms, CRM, and website data into a single source of truth, uses AI to surface what's actually working, and feeds better data back to the ad platforms to improve their optimization.
Ready to stop guessing and start scaling with confidence? Get your free demo and see exactly which ads and channels are driving your revenue.