You've allocated budget across LinkedIn, Google Search, retargeting, and maybe a few emerging channels. Leads are coming in. Some deals are closing. But when your VP of Sales asks which campaigns are actually driving pipeline, you find yourself staring at four different dashboards, each telling a completely different story.
This is the attribution problem that quietly undermines budget decisions for B2B SaaS marketing teams every single quarter. Every channel claims credit. Every platform shows impressive numbers. And yet the connection between ad spend and closed-won revenue remains frustratingly unclear.
A marketing attribution case study is the structured analytical framework that closes this gap. Rather than relying on a single platform's self-reported metrics, it assembles a complete, cross-channel picture of how prospects move from first ad exposure to signed contract. It identifies which touchpoints actually matter, which channels consistently appear in high-value customer journeys, and where budget is quietly disappearing into low-converting traffic.
This article walks through exactly how that analysis is structured: the data infrastructure it requires, the attribution models that make sense for B2B SaaS, and how growth teams translate findings into sharper, more defensible budget decisions. Whether you're running attribution for the first time or trying to upgrade a broken reporting setup, this is the framework that turns scattered data into a single, trustworthy view of marketing performance.
The Attribution Problem B2B SaaS Teams Face Every Quarter
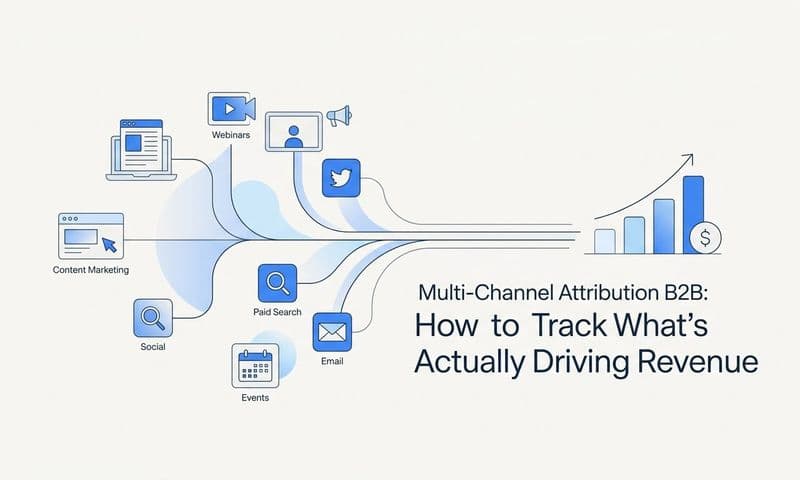
B2B SaaS buying is not a linear process. A prospect might first encounter your brand through a LinkedIn sponsored post, click a Google search ad two weeks later when they're actively evaluating options, get retargeted on social after visiting your pricing page, and finally convert through a direct visit after reading a comparison article. That entire journey could span six to ten weeks and involve multiple stakeholders before a demo request ever lands in your CRM.
Last-click attribution collapses all of that complexity into a single data point: the last channel touched before conversion. In the scenario above, direct traffic gets the credit. LinkedIn, Google, and retargeting show nothing. Your team looks at the report and concludes that paid social isn't working, cuts the budget, and watches lead volume quietly decline over the next quarter.
This is not a hypothetical failure mode. It is one of the most common ways B2B SaaS teams make expensive budget mistakes with complete confidence.
The problem is compounded by siloed data. Google Ads reports conversions based on its own tracking logic. Meta does the same. Your CRM tracks lead sources based on whatever UTM parameter happened to be captured at form submission. None of these systems talk to each other natively, and each one is incentivized to show its own contribution in the best possible light. The result is a situation where your total attributed conversions across all platforms often exceeds your actual conversion count by a wide margin.
This is the environment in which a marketing attribution case study becomes genuinely valuable. Rather than accepting any single platform's version of events, it builds a unified dataset that connects ad impressions and clicks to CRM pipeline stages and, ultimately, to closed-won revenue. It applies a consistent attribution logic across all channels simultaneously, so credit is allocated based on actual customer journey data rather than each platform's self-serving measurement methodology.
For B2B SaaS teams operating with real budget pressure and a need to demonstrate marketing ROI to leadership, this kind of structured analysis is not optional. It is the foundation of any decision-making process that deserves to be called data-driven.
Anatomy of a Meaningful Attribution Analysis
Not all attribution analyses are created equal. A surface-level ad report tells you which campaigns generated clicks and impressions. A true marketing attribution case study follows the customer journey from first ad exposure through every subsequent touchpoint to closed-won revenue. The difference in insight quality is significant.
A well-structured attribution analysis contains four core components. The first is business context: the channels in play, the budget allocated, the goals being pursued (pipeline generation, demo requests, trial signups), and the sales cycle length. Without this framing, attribution findings are difficult to interpret accurately.
The second component is the attribution model applied. This determines how credit for a conversion is distributed across the touchpoints in a customer journey. Different models answer different questions, and the choice of model shapes every conclusion that follows.
The third component is the data sources connected. A reliable attribution analysis pulls from ad platforms (Google, Meta, LinkedIn, and others), CRM pipeline data, website event tracking, and ideally revenue data from a source like Stripe. The more complete the data picture, the more accurate the attribution output.
The fourth component is the outcome metrics tracked. Lead volume is a starting point, but the metrics that matter most to B2B SaaS teams are further down the funnel: pipeline generated by channel, cost per qualified opportunity, pipeline-to-revenue conversion rate by source, and average deal size by acquisition channel.
The questions a well-constructed attribution case study is designed to answer include: Which channel sourced the most qualified leads, not just the most leads? Which touchpoints appeared most consistently in the journeys of customers who closed at the highest contract values? Where is budget generating activity but not pipeline? Which campaigns are contributing to deals but receiving no credit under current reporting?
These are the questions that drive real budget decisions. And they can only be answered when the analysis is built on a complete, connected dataset rather than isolated platform reports.
Choosing the Right Attribution Model for Your Analysis
The attribution model you apply determines which parts of the customer journey receive credit for a conversion. For B2B SaaS, where the buying journey is long and multi-touch, model selection has a direct impact on how you perceive channel performance and, consequently, how you allocate budget.
First-touch attribution assigns full credit to the first channel or campaign a prospect interacted with. It is useful for understanding which channels are most effective at generating initial awareness and bringing new prospects into the funnel. For teams focused on demand generation, this model highlights where top-of-funnel investment is paying off.
Last-touch attribution assigns full credit to the final touchpoint before conversion. It reflects what immediately preceded a decision to act, which can be useful for evaluating bottom-of-funnel campaigns. The significant limitation is that it ignores everything that built awareness and trust earlier in the journey, making it a poor model for understanding full-funnel channel contribution.
Linear attribution distributes credit equally across all touchpoints in the customer journey. It acknowledges that every interaction contributed something, which is philosophically reasonable for long B2B sales cycles. The limitation is that it treats a brief retargeting impression the same as a high-intent demo request click, which may not reflect actual influence on the buying decision.
Time-decay attribution gives more credit to touchpoints that occurred closer to the conversion event. This model reflects the intuition that interactions near the point of decision carry more weight. It works well for shorter sales cycles but can undervalue awareness-building channels in longer B2B journeys.
Data-driven attribution uses algorithmic modeling to assign credit based on actual patterns in your conversion data. It identifies which touchpoints are most predictive of conversion across your specific customer base, rather than applying a fixed rule. For teams with sufficient data volume, this model typically produces the most accurate picture of channel contribution.
Here is where the real analytical value appears: comparing multiple attribution models side by side within the same dataset. A channel that looks weak under last-touch attribution may consistently appear as the first touchpoint in your highest-value deals. A campaign that receives significant last-touch credit may rarely appear in journeys that lead to enterprise contracts. These discrepancies are invisible when you rely on a single model, and they often represent the most important insights a marketing attribution case study can surface.
For most B2B SaaS teams with sales cycles longer than a few weeks, multi-touch models that distribute credit across the full journey provide a more honest and actionable picture than either first-touch or last-touch alone.
Building the Data Foundation: Connecting Ads, CRM, and Revenue
The quality of any attribution analysis is limited by the quality of the data infrastructure underneath it. A sophisticated attribution model applied to incomplete or inconsistent data will produce confident-sounding conclusions that are fundamentally unreliable. Getting the foundation right is not a technical detail; it is the prerequisite for everything else.
Reliable attribution requires connecting three distinct data layers. The first is ad platform data: impressions, clicks, campaign metadata, and conversion events from Google Ads, Meta, LinkedIn, and any other channels in your mix. The second is CRM pipeline data: lead source, deal stage progression, opportunity value, and closed-won outcomes. The third is revenue data, ideally pulled from a billing system like Stripe, which allows you to connect marketing activity not just to leads but to actual revenue generated.
Gaps in any of these layers corrupt the analysis. Missing UTM parameters mean that a significant portion of your CRM leads show no channel source, making it impossible to attribute them accurately. Untracked form submissions create leads that appear to have arrived from nowhere. Broken pixel events cause conversions to go unreported to ad platforms, which degrades their optimization algorithms and leads to inefficient bidding.
Browser-based pixel tracking has become increasingly unreliable due to ad blockers, iOS privacy restrictions, and the ongoing deprecation of third-party cookies. Many conversions that occur in these environments are simply never recorded by client-side tracking alone.
This is where server-side tracking and Conversion API integrations become critical. Server-side tracking captures conversion events directly from your server rather than relying on a browser pixel, which means ad blockers and privacy settings cannot interfere. Conversion API integrations send enriched event data directly to ad platforms like Meta and Google, including first-party signals such as email addresses and phone numbers that allow the platforms to match conversions more accurately to the users who generated them.
The practical impact of this is significant. Teams that implement server-side tracking and Conversion API typically see a meaningful increase in the number of conversions that are properly attributed, which improves both their understanding of channel performance and the quality of data fed back to ad platform machine learning models.
Platforms like Cometly are built specifically to handle this data infrastructure layer, connecting ad platforms, CRM pipeline data, and revenue in a single place so that attribution analysis is built on a complete, reliable dataset rather than patched together from disconnected sources.
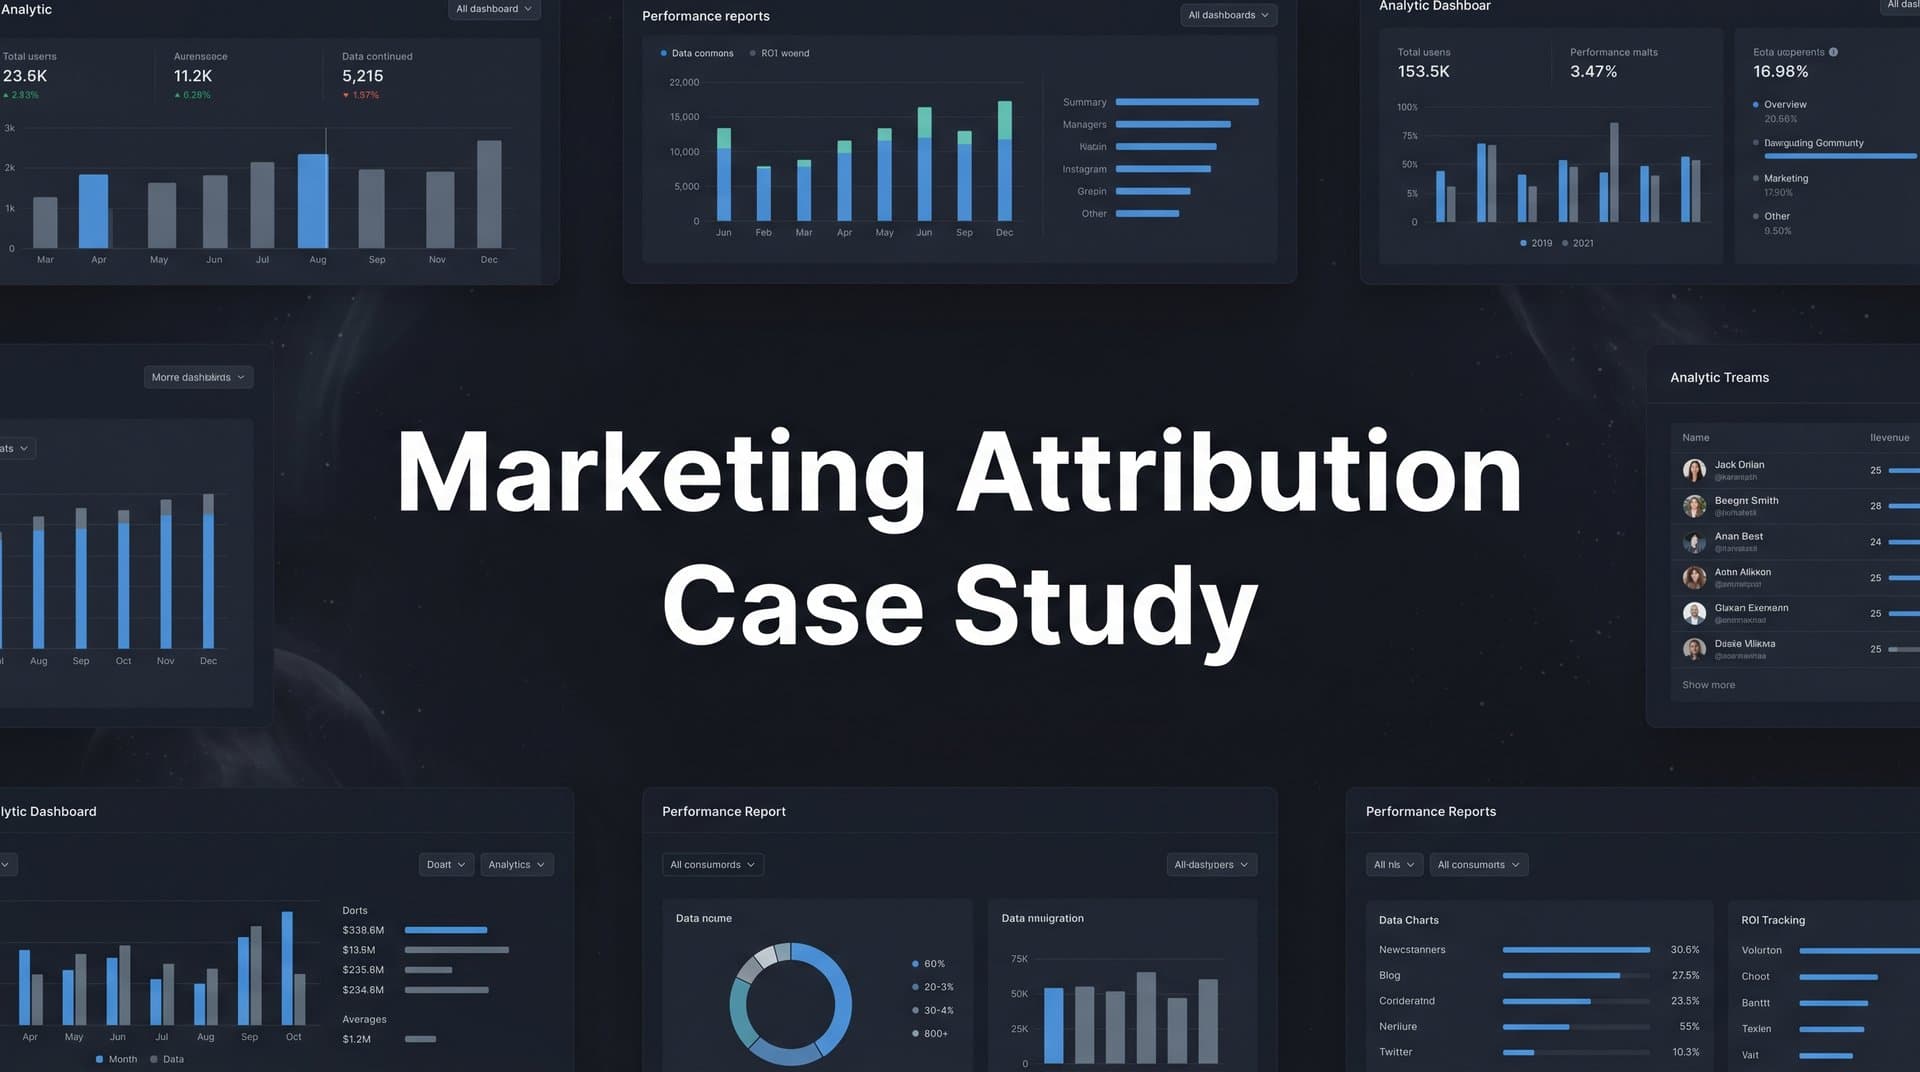
Reading the Results: Turning Attribution Data Into Budget Decisions
Once the data infrastructure is in place and an attribution model has been applied, the analytical work begins. Reading attribution results well requires knowing which questions to ask and which metrics actually connect to business outcomes.
The first thing to examine is channel contribution at different stages of the funnel. A channel might generate a high volume of leads but contribute very little to closed-won revenue. Conversely, a channel that appears modest in lead volume terms might consistently appear in the journeys of your highest-LTV customers. These patterns are invisible in top-of-funnel metrics but become clear when attribution data is connected to revenue outcomes.
Pipeline velocity is one of the most valuable outputs of a thorough attribution analysis. It measures not just whether a channel converts, but how quickly leads from that channel move through the funnel to revenue. A channel that generates leads with a short sales cycle and high close rate is fundamentally more valuable than one that generates a similar volume of leads that stall at the proposal stage. Attribution data that connects to CRM pipeline stages allows you to see this difference clearly.
Cost per acquisition is another metric that attribution analysis reframes significantly. When cost per acquisition is calculated against closed-won revenue rather than lead volume, the ranking of channels often shifts substantially. A channel with a high cost per lead may have a low cost per acquired customer if its leads close at a higher rate. A channel with an attractive cost per lead may look far less efficient when pipeline-to-revenue conversion rates are factored in.
Modern attribution platforms use AI to surface these patterns automatically rather than requiring analysts to manually parse raw data. AI-powered systems can flag which ad creative is most consistently associated with high-value customer journeys, identify campaigns that are generating clicks without contributing to pipeline, and highlight channels that deserve more budget based on their revenue contribution relative to current spend.
Cometly's AI-driven recommendations are designed to do exactly this: identifying high-performing ads and campaigns across every channel so growth teams can act on insights quickly, without spending hours building custom reports to find patterns that should be obvious from the data.
Applying Attribution Insights to Scale What Works
Attribution analysis is most valuable when its findings feed back into the systems that drive ad performance. This is where the loop closes and where the compounding benefits of good attribution infrastructure become apparent.
The most direct feedback mechanism is sending enriched conversion data back to ad platforms via Conversion API. When Meta, Google, or LinkedIn receive accurate, first-party conversion signals including the downstream revenue outcomes tied to specific campaigns, their machine learning models can optimize targeting and bidding toward the audience segments most likely to generate actual revenue, not just clicks or form fills. This is a meaningful advantage. Ad platforms optimizing toward enriched, revenue-connected conversion signals consistently outperform those optimizing toward surface-level events like page views or raw lead submissions.
Attribution findings also enable a set of strategic budget decisions that are difficult to make confidently without this data. Teams can reallocate budget away from channels with high cost-per-lead but low revenue contribution, freeing up spend for channels that consistently appear in closed-won journeys. They can test new creative with a clear measurement framework in place, knowing that performance will be evaluated against pipeline and revenue outcomes rather than vanity metrics. They can identify the specific campaigns and ad formats that appear most often in the journeys of their best customers and prioritize scaling those.
Ongoing attribution analysis functions as a continuous feedback loop rather than a one-time audit. Each campaign cycle produces cleaner data as tracking improves and more conversion history accumulates. Insights from one quarter inform targeting and creative decisions in the next. Over time, the marketing operation becomes progressively more efficient because every decision is grounded in an increasingly accurate picture of what actually drives revenue.
This is the compounding advantage that separates teams who scale with confidence from those who reallocate budget based on gut feel and hope. Attribution is not just a reporting function. It is the engine of continuous improvement.