Marketing teams running paid campaigns across Google, Meta, LinkedIn, and other channels face a persistent challenge: data lives in silos. Each platform reports its own version of performance, and when the numbers don't match, decisions stall. Budget gets misallocated. High-performing channels get cut. Underperforming ones get scaled.
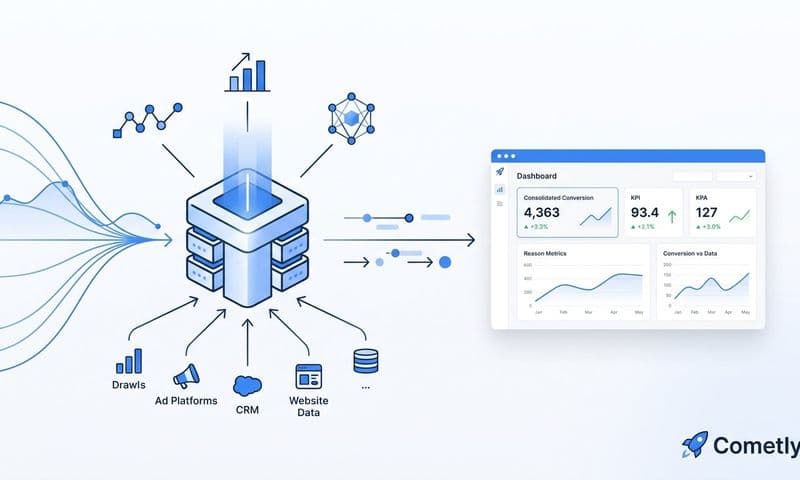
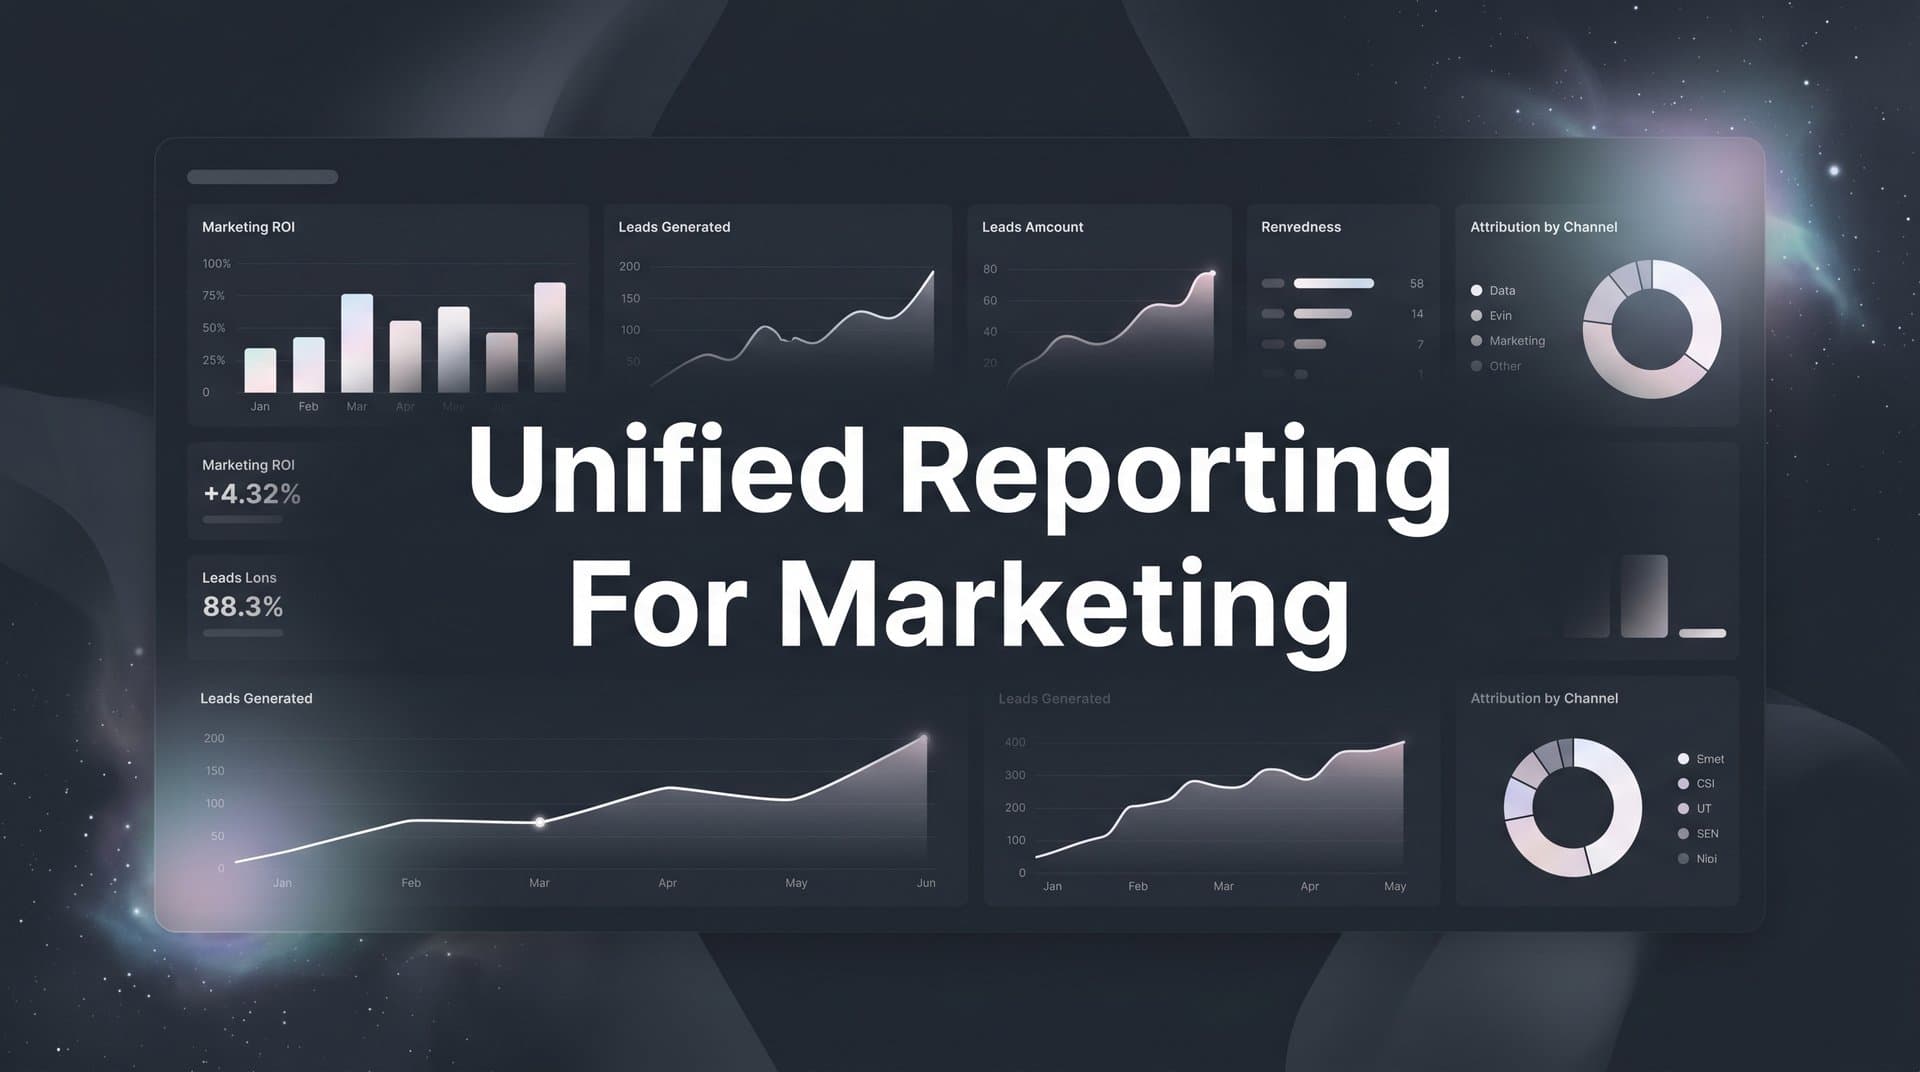
Unified reporting for marketing solves this by pulling every channel, touchpoint, and conversion signal into a single, consistent view. Instead of toggling between dashboards and reconciling conflicting attribution windows, your team works from one source of truth.
For B2B SaaS companies especially, this matters beyond surface-level metrics. You need to know which campaigns drive pipeline, which channels close revenue, and how the full customer journey connects from first ad click to closed-won deal. Without unified reporting, that picture is always incomplete.
This guide covers seven actionable strategies to build and operationalize unified marketing reporting. Whether you are starting from scratch or improving an existing setup, each strategy addresses a specific gap that keeps marketing teams from making confident, data-driven decisions.
Implement these in sequence or prioritize based on your current gaps. Either way, the outcome is the same: cleaner data, sharper insights, and marketing spend that is clearly tied to revenue.
1. Establish a Single Source of Truth Across All Ad Platforms
The Challenge It Solves
When Google Ads, Meta, and LinkedIn each report conversions independently, the numbers almost never agree. Different attribution windows, different conversion counting methods, and different definitions of a "click" all contribute to a fragmented view. Many paid media teams spend more time reconciling data than actually acting on it.
This is the core problem that a single source of truth solves. Instead of treating each platform's dashboard as its own ground truth, you consolidate everything into one unified reporting layer where comparisons are apples-to-apples.
The Strategy Explained
Consolidating ad platform data starts with native integrations that pull raw performance metrics from each channel into one place. Think of it less like building a spreadsheet and more like creating a control room where every signal feeds the same display.
The key is not just aggregating data but standardizing it. That means aligning attribution windows, normalizing campaign naming conventions, and ensuring conversion events are defined the same way across every platform. Once that foundation is in place, cross-channel decisions become straightforward rather than contentious. Using a dedicated marketing reporting platform is the most reliable way to achieve this consistency at scale.
Platforms like Cometly are built specifically for this workflow, connecting 70+ ad platforms and data sources into a single attribution layer so your team always works from consistent, reliable numbers.
Implementation Steps
1. Audit every active ad platform and document the attribution window and conversion counting method each one uses by default.
2. Select a unified attribution window that reflects your average sales cycle and apply it consistently across all channels within your reporting layer.
3. Standardize your UTM tagging structure across every campaign so source, medium, and campaign data flows cleanly into your unified reporting tool.
4. Connect all ad platforms via native integrations rather than manual exports to eliminate data latency and human error.
Pro Tips
Document your standardization decisions in a shared team reference. When a new channel gets added or a new team member joins, this prevents drift back into inconsistent setups. Treat your data governance rules as living documentation, not a one-time exercise.
2. Implement Server-Side Tracking to Capture Accurate Conversion Data
The Challenge It Solves
Browser-based pixels have become increasingly unreliable. Ad blockers, browser privacy updates, and iOS privacy changes all reduce the volume of conversion signals that client-side tracking can capture. When your pixel misses conversions, your reporting understates performance and your ad platforms receive weaker optimization signals.
The result is a compounding problem: inaccurate reporting leads to poor budget decisions, and degraded signals lead to worse ad platform targeting. Server-side tracking addresses both issues at the source.
The Strategy Explained
Server-side tracking sends conversion event data directly from your server to ad platforms like Meta and Google, bypassing the client-side limitations that cause signal loss. Meta's Conversion API (CAPI) and Google Enhanced Conversions are the two primary implementations for most B2B SaaS teams.
The practical impact is twofold. First, your reporting becomes more complete because you are capturing conversions that pixels would have missed. Second, the enriched signals you send back to ad platforms improve their machine learning models, which leads to better targeting and more efficient spend over time.
This is a well-documented shift in the industry. Teams that implement server-side tracking typically see their reported conversion volumes increase as previously untracked events are now captured and attributed correctly. Pairing this with the right performance marketing tracking software ensures those captured events flow into your reporting layer without gaps.
Implementation Steps
1. Audit your current pixel setup to identify the gap between server-side events and browser-based events, which reveals how much conversion data you are currently missing.
2. Implement Meta Conversion API by configuring your server to send purchase, lead, and other key events directly to Meta's API endpoint, deduplicating against pixel events to avoid double counting.
3. Set up Google Enhanced Conversions by passing hashed first-party customer data alongside conversion events to improve Google's ability to match and attribute conversions accurately.
4. Validate your implementation by comparing event volumes in your ad platform event manager against your server-side logs to confirm data is flowing correctly.
Pro Tips
Deduplication is critical. When running both pixel and server-side tracking simultaneously, always use event IDs to ensure the same conversion is not counted twice. Skipping this step inflates reported conversions and distorts your optimization signals in the wrong direction.
3. Choose and Standardize Your Attribution Model Across Channels
The Challenge It Solves
Many marketing teams apply different attribution models per platform without realizing it. Google Ads might use data-driven attribution while LinkedIn defaults to last-touch and your CRM uses first-touch. When you pull these numbers together, you are comparing outputs from three different measurement methodologies, which makes cross-channel budget decisions unreliable.
A common challenge across B2B paid media teams is that attribution model inconsistency quietly undermines even well-structured reporting setups. Understanding the full range of ways marketing attribution software can improve digital marketing helps teams recognize how much value is left on the table when models are applied inconsistently.
The Strategy Explained
Standardizing on a single attribution model means selecting one approach that fits your sales cycle and applying it consistently when analyzing cross-channel performance in your unified reporting layer. This does not mean you cannot explore multiple models for insight purposes, but your primary decision-making view should use one consistent model.
For B2B SaaS companies with longer sales cycles, linear or time-decay attribution often provides a more balanced view than last-click. These models acknowledge that multiple touchpoints contribute to a closed deal rather than crediting the final interaction entirely.
The goal is not to find the "perfect" model but to make your comparisons meaningful. A consistent model applied across all channels gives you a reliable basis for deciding where to increase or reduce spend.
Implementation Steps
1. Map your typical B2B buyer journey and count the average number of touchpoints before a deal closes to inform which attribution model best reflects your reality.
2. Select a primary attribution model and document why it was chosen so the rationale is clear to stakeholders and future team members.
3. Apply that model consistently within your unified reporting layer, overriding platform-native defaults where necessary.
4. Create a secondary view using an alternative model (such as first-touch vs. linear) for exploratory analysis, keeping it clearly separate from your primary decision-making dashboard.
Pro Tips
Revisit your attribution model choice when your sales cycle or channel mix changes significantly. A model that worked well when you were running two channels may need adjustment as you scale to five or six. Build in a quarterly review of your attribution logic as part of your reporting governance process.
4. Connect Your CRM to Ad Data for Full-Funnel Visibility
The Challenge It Solves
Stopping attribution at the lead level is one of the most common and costly gaps in B2B marketing reporting. A campaign that generates a high volume of form fills looks successful in your ad platform dashboard, but if those leads never convert to pipeline or revenue, the spend was not effective. Without CRM integration, you have no way to know the difference.
Many B2B marketing teams find that their highest-volume lead sources are not their highest-revenue sources once CRM data is factored in. This is exactly why understanding how SaaS growth teams attribute revenue to marketing efforts is so critical before building your integration.
The Strategy Explained
Connecting your CRM to your ad reporting means syncing pipeline stages, deal values, and closed-won data back to the campaigns and channels that originated or influenced each deal. Instead of measuring cost per lead, you can measure cost per qualified pipeline and cost per closed-won revenue.
This shift changes how you evaluate channel performance entirely. A LinkedIn campaign with a high cost per lead might look expensive until you see that it generates a disproportionate share of enterprise deals. A Google campaign with a low cost per lead might look efficient until CRM data reveals those leads rarely progress past the first sales call.
Tools like Cometly integrate directly with Stripe and CRM platforms to pull revenue data back into your attribution reporting, giving you a complete view from first ad click to closed-won deal.
Implementation Steps
1. Define the CRM events you want to pass back to your reporting layer, typically including MQL, SQL, opportunity created, and closed-won stages.
2. Map each CRM contact or deal back to its originating campaign using UTM parameters or a first-party tracking identifier captured at the point of form submission.
3. Sync deal values and pipeline stages into your unified reporting dashboard so revenue attribution is visible alongside ad spend and conversion volume.
4. Build a report that shows cost per pipeline stage by channel so you can identify where each channel performs strongest in the funnel.
Pro Tips
Work closely with your sales team to ensure CRM data hygiene. If deal stages are not updated consistently or contact records lack source attribution, your revenue reporting will be incomplete. A brief alignment session with sales ops can prevent months of reporting gaps downstream.
5. Build a Centralized Marketing Dashboard for Cross-Channel Analysis
The Challenge It Solves
Even when data is unified in the background, teams often default to logging into individual platform dashboards out of habit. Without a purpose-built centralized dashboard, the benefits of unified data go unrealized because the team never has a single place to make cross-channel comparisons efficiently.
A well-structured dashboard is the interface between your unified data and the decisions your team needs to make every day. Selecting the right marketing analytics platform is one of the most consequential decisions you will make in this process.
The Strategy Explained
A centralized marketing dashboard should be designed around the questions your team actually needs to answer, not around the metrics each platform happens to surface. For B2B SaaS teams, that means organizing the dashboard around revenue-connected KPIs: customer acquisition cost, return on ad spend, pipeline contribution by channel, and cost per closed-won deal.
Different stakeholders need different views of the same data. A CMO reviewing quarterly performance needs a high-level summary of pipeline contribution and revenue impact. A paid media manager optimizing daily campaigns needs granular ad set and creative performance data. Build your dashboard with layered views that serve both without requiring either to dig through irrelevant data.
Implementation Steps
1. List the five to seven questions your team asks most frequently when reviewing marketing performance, and design the primary dashboard view to answer those questions directly.
2. Build a CMO-level summary view that shows total spend, pipeline generated, revenue attributed, and blended ROAS across all channels in a single glance.
3. Create a channel-level breakdown view that allows paid media managers to compare performance across Google, Meta, LinkedIn, and other active channels using consistent metrics.
4. Add a campaign and creative performance layer for granular optimization decisions, including ad-level data tied back to pipeline and revenue outcomes.
Pro Tips
Avoid dashboard sprawl. More metrics do not mean more insight. Start with the smallest number of KPIs that drive the most important decisions and add metrics only when there is a clear use case. A focused dashboard gets used consistently; an overloaded one gets ignored. Reviewing digital marketing performance metrics best practices can help you identify which KPIs deserve a permanent spot in your primary view.
6. Use Multi-Touch Attribution to Understand the Full Customer Journey
The Challenge It Solves
B2B buyers rarely convert after a single interaction. They might discover your product through a LinkedIn ad, read a comparison article from an organic search, attend a webinar, and then convert after clicking a retargeting ad. If your reporting only credits the last click, LinkedIn, the webinar, and the organic content all appear to have contributed nothing.
Single-touch attribution systematically undervalues the channels that create awareness and nurture intent, leading teams to over-invest in bottom-of-funnel tactics while starving top-of-funnel channels that feed the pipeline. The best marketing attribution tools for B2B SaaS companies are specifically designed to solve this problem across complex, multi-channel buyer journeys.
The Strategy Explained
Multi-touch attribution distributes conversion credit across every touchpoint in the customer journey based on a defined model. Linear attribution gives equal credit to each touchpoint. Time-decay attribution gives more credit to touchpoints closer to conversion. Position-based models give heavier weight to the first and last interactions.
For B2B SaaS teams, multi-touch attribution reveals which channels are strong at creating awareness, which ones accelerate mid-funnel consideration, and which ones are most effective at driving the final conversion. This full-funnel visibility is essential for making intelligent budget allocation decisions across a complex, multi-channel mix.
Cometly's multi-touch attribution capabilities map every touchpoint across the customer journey, connecting ad interactions to CRM outcomes so you can see exactly how each channel contributes to revenue at every stage of the funnel.
Implementation Steps
1. Map out the typical touchpoint sequence for your best customers by reviewing closed-won deals in your CRM and identifying the channels and content types that appeared most frequently in their journeys.
2. Select a multi-touch attribution model that reflects the relative importance of different journey stages for your specific sales cycle and buyer behavior.
3. Implement cross-channel tracking that captures every touchpoint with a consistent identifier so the full journey can be stitched together accurately.
4. Analyze the difference between your current last-click attribution results and your multi-touch results to identify which channels are being systematically over- or under-credited.
Pro Tips
Use multi-touch attribution findings to start conversations with your sales team. When you can show that a specific content piece or channel consistently appears in the journeys of your best customers, it creates alignment between marketing and sales on where to invest and what content to prioritize.
7. Leverage AI to Surface Actionable Insights From Unified Data
The Challenge It Solves
Unified data is only valuable if your team can extract insights from it quickly enough to act. As campaign volume grows and channel complexity increases, manually reviewing performance data to find optimization opportunities becomes increasingly time-consuming. Patterns that would take hours to identify manually can be surfaced in seconds by AI working across your full dataset.
Industry practitioners increasingly find that the teams who act on insights fastest gain the most competitive advantage in paid media, and AI is what makes that speed possible at scale. The broader impact of artificial intelligence on transforming marketing strategies extends well beyond reporting, but unified data is where that transformation begins.
The Strategy Explained
Once your marketing data is unified and clean, AI can do two things that are difficult to accomplish manually. First, it can identify performance patterns across your entire campaign portfolio, flagging which ads, audiences, and channels are trending up or down before the changes are obvious in raw data. Second, it can recommend specific budget reallocations based on performance trends, helping you shift spend toward what is working without waiting for end-of-month reviews.
AI also closes the loop between your unified reporting and the ad platforms themselves. By feeding enriched, conversion-ready events back to Meta and Google, AI-driven attribution tools improve the targeting signals those platforms use to optimize delivery, which compounds the performance benefits of better data over time. Exploring the best AI tools for digital marketing can help you identify which capabilities to prioritize as you build out this layer.
Cometly's AI ads manager is built to do exactly this: analyze performance patterns across every channel in your unified reporting layer and surface recommendations that help you scale what is working and cut what is not.
Implementation Steps
1. Ensure your unified data layer is clean and complete before activating AI analysis. AI insights are only as reliable as the underlying data, so data quality is a prerequisite, not an afterthought.
2. Define the optimization questions you want AI to answer, such as which campaigns to scale, which creatives are fatiguing, or which audience segments are underperforming.
3. Configure enriched conversion event feeds back to Meta and Google using server-side data so both platforms receive the highest-quality signals for their own optimization algorithms.
4. Review AI-generated recommendations on a regular cadence and build a process for testing and validating them before making large budget changes based on algorithmic suggestions.
Pro Tips
Treat AI recommendations as hypotheses to be tested, not directives to be followed blindly. The best teams use AI to identify opportunities and then apply human judgment to validate them. Over time, as you track which AI recommendations lead to real performance improvements, you build calibrated trust in the system and can act on insights with greater confidence.
Putting It All Together: Your Unified Reporting Roadmap
Unified reporting for marketing is not a one-time project. It is an ongoing discipline that compounds in value as your data becomes cleaner, your attribution becomes more accurate, and your team builds confidence in the numbers.
Start with the foundation: consolidate your ad platform data and implement server-side tracking. Then layer in CRM integration and a consistent attribution model. Once those are in place, your dashboard becomes a decision-making engine rather than a reporting chore.
For B2B SaaS teams, the payoff is significant. You stop guessing which channels drive pipeline and start knowing. You stop defending your budget in quarterly reviews and start showing the revenue impact of every campaign.
Here is a prioritized starting point based on where most teams have the biggest gaps:
Foundation First: Consolidate ad platform data into a single reporting layer and standardize attribution windows before anything else. This eliminates the conflicting numbers that slow every downstream decision.
Data Completeness Second: Implement server-side tracking to ensure your conversion data is accurate and complete. Clean data is the prerequisite for every other strategy on this list.
Revenue Connection Third: Integrate your CRM so attribution extends to pipeline and closed-won revenue. This is where marketing reporting becomes genuinely strategic rather than operational.
Intelligence Layer Last: Once your data is unified, clean, and revenue-connected, activate multi-touch attribution and AI-driven insights to optimize continuously and at scale.
Cometly is built specifically for this workflow. It connects your ad platforms, CRM, and website into a single attribution layer, tracks every touchpoint from first click to closed-won revenue, and uses AI to surface the insights that move the needle. If you are ready to move from fragmented dashboards to a true single source of truth, Cometly gives you the infrastructure to get there.
Ready to elevate your marketing game with precision and confidence? Discover how Cometly's AI-driven recommendations can transform your ad strategy. Get your free demo today and start capturing every touchpoint to maximize your conversions.