Most marketing teams can tell you how many leads they generated last quarter. They can tell you how much they spent on ads. Some can even tell you their cost per acquisition. But ask them which specific touchpoints actually moved a deal from a cold prospect to a closed customer, and the room goes quiet.
This is the core tension that the consumer journey funnel is designed to solve. Not as a slide deck concept, but as a working framework that maps every step a buyer takes from the moment they first encounter your brand to the moment they sign a contract and beyond. For B2B SaaS companies, that journey is rarely short or simple. It involves multiple stakeholders, extended evaluation periods, and a web of touchpoints spanning paid social, organic search, email, retargeting, sales calls, and more.
The problem is that most teams treat the funnel as a diagram rather than a data system. They know the stages exist. They can name them. But they are not actually measuring what happens inside each one, which means every budget decision is made on incomplete information.
Attribution is the missing layer. Without it, the funnel is theoretical. With it, you can see which ads drove awareness, which content accelerated consideration, which channels influenced the final decision, and where prospects are dropping off before they ever reach your sales team. That visibility is what separates teams that scale confidently from teams that are perpetually guessing.
This article breaks down the consumer journey funnel from the ground up: what each stage means in a B2B SaaS context, why most funnels break down in practice, how to map and measure touchpoints accurately, and how attribution data turns funnel insight into smarter spend decisions. If you want to stop flying blind and start building a funnel you can actually optimize, this is where to start.
The Stages That Shape Every Buying Decision
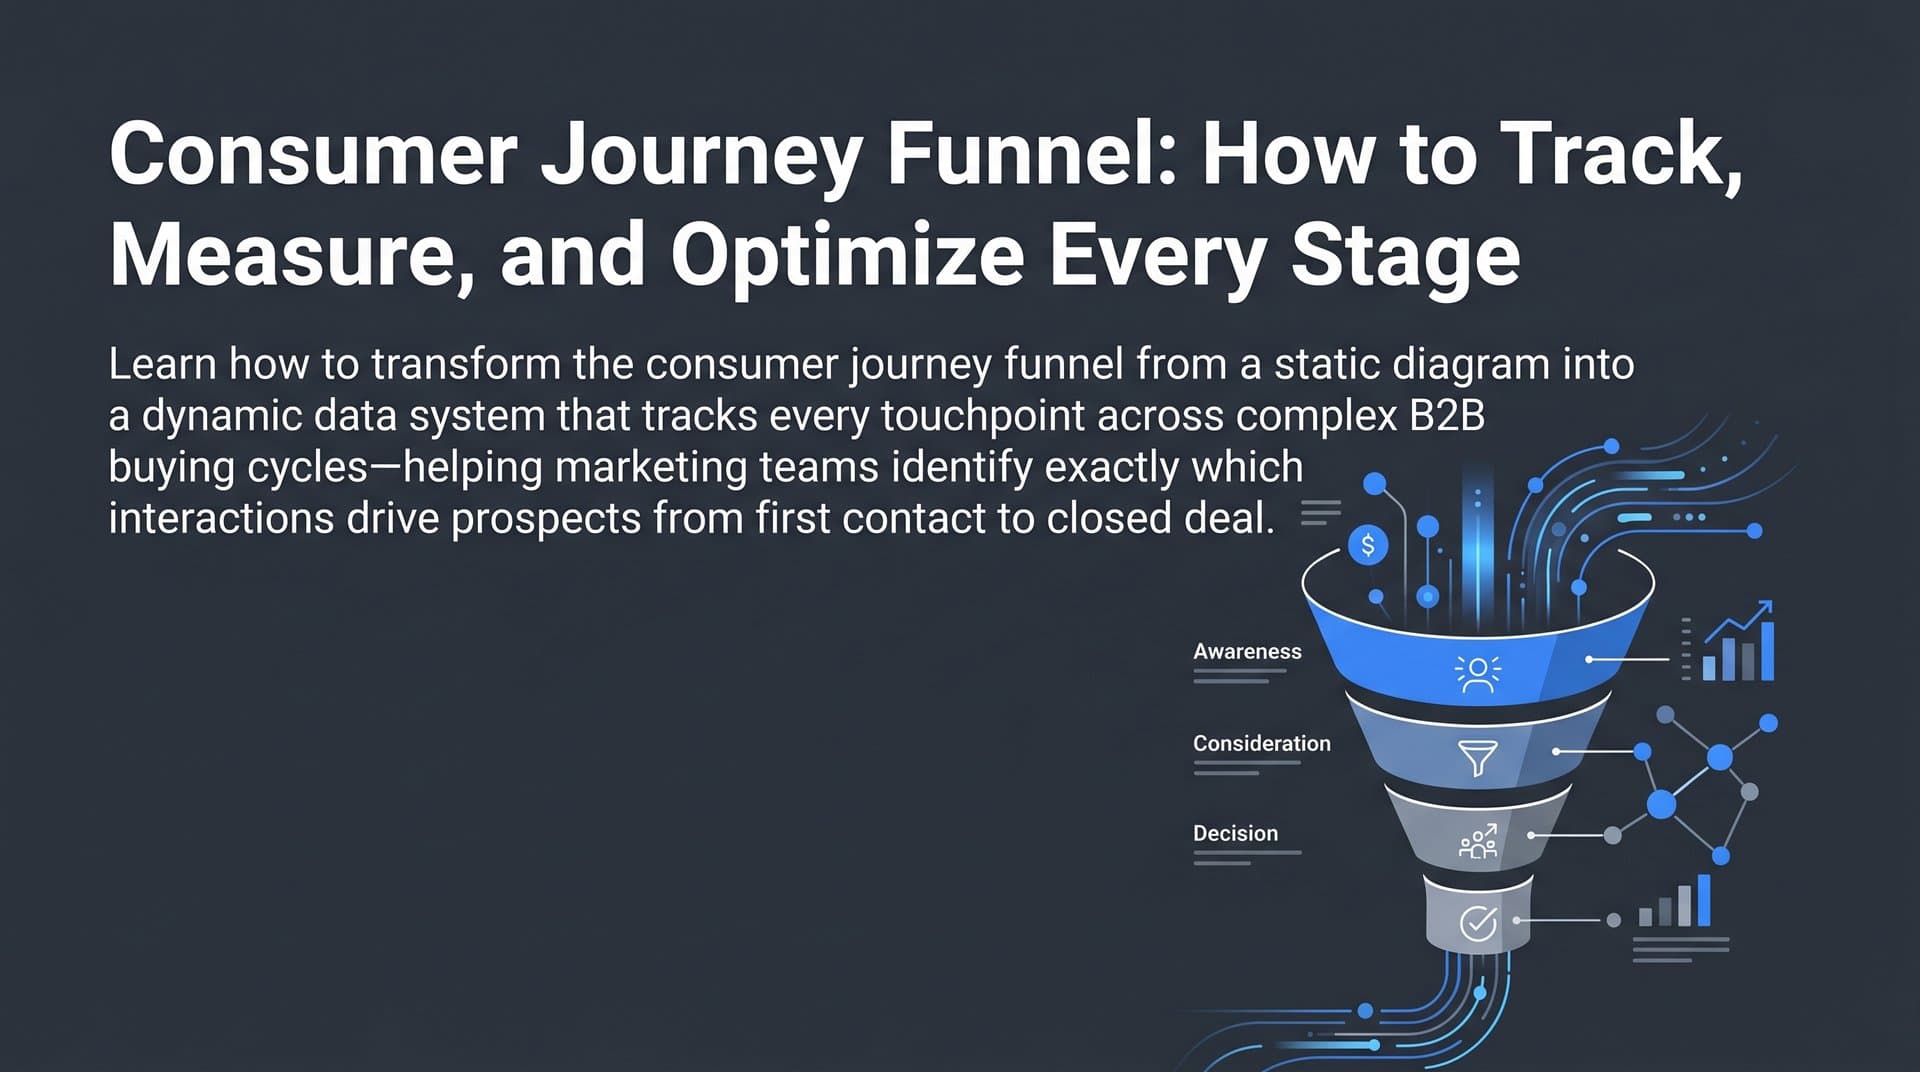
The consumer journey funnel has been described in many ways, but for B2B SaaS, the most practical model breaks down into four core stages: Awareness, Consideration, Decision, and Retention. Each stage reflects a different level of buyer intent, and each one requires a fundamentally different marketing response.
Awareness: This is the top of the funnel, where a prospect first encounters your brand. They may not have a defined problem yet, or they may be just beginning to recognize one. In B2B SaaS, awareness often happens through a LinkedIn ad, a Google search, a podcast mention, or a piece of content that surfaces at the right moment. The buyer intent signal here is weak but real. Your job at this stage is not to sell. It is to educate, surface a pain point, and earn enough attention to pull them deeper.
Consideration: The prospect now knows they have a problem and is actively evaluating solutions. They are reading comparison pages, watching product demos, consuming case studies, and engaging with retargeting ads. In B2B SaaS, this stage often involves multiple people on the buying team, each with different priorities. Intent signals are stronger here: repeated site visits, content downloads, email engagement, and direct product page views. Marketing at this stage should reduce friction, build trust, and differentiate your solution from alternatives.
Decision: The buyer is ready to act. They are in conversations with your sales team, requesting demos, reviewing pricing, and comparing final options. Marketing's role shifts toward reinforcement: case studies, ROI calculators, testimonials, and targeted ads that remind a prospect why your solution is the right choice. The intent signal is high. A well-timed touchpoint here can accelerate the deal or prevent it from stalling.
Retention: This stage is frequently excluded from marketing attribution models, which is a significant mistake. In SaaS, renewal and expansion revenue are core business outcomes, and marketing touchpoints including content, email nurture sequences, community engagement, and product education directly influence whether customers stay, expand, or churn.
Here is the important caveat: buyers do not move through these stages in a clean, linear sequence. A prospect might see three awareness ads, skip consideration entirely, and request a demo directly. Another might spend months in consideration before going dark, then return six months later ready to buy. The funnel is a strategic model, not a rigid pipeline. Real buyer behavior is non-linear, multi-channel, and often unpredictable.
That is precisely why the funnel needs to be backed by data rather than assumptions. The model gives you a framework for thinking about buyer intent. Understanding each stage of the customer journey gives you the evidence to understand what actually happened.
Why Most Funnels Break Down in Practice
Understanding the funnel conceptually is easy. Measuring it accurately is where most teams run into serious problems.
The most common breakdown is a visibility gap in the middle of the funnel. Teams typically have decent data at the top: impressions, clicks, and traffic are easy to measure. They also have data at the bottom: closed revenue shows up in the CRM. But the middle of the funnel, where leads are being nurtured, evaluated, and qualified, is often a black box. Teams do not know which channels are accelerating prospects through consideration, which content is building enough trust to trigger a demo request, or where prospects are stalling and why.
Without that middle-funnel visibility, budget decisions default to whatever looks good in platform dashboards. And that is where the second major problem emerges.
Multi-channel buyer behavior creates attribution blind spots that individual ad platforms are not designed to resolve. Consider a realistic B2B SaaS buyer journey: a prospect sees a LinkedIn ad on Monday, reads a blog post through organic search on Wednesday, gets retargeted by a Google display ad on Friday, and then converts through a branded search the following week. LinkedIn reports that impression as a view-through conversion. Google claims the retargeting click. Organic search gets credit for the final click. Every platform is technically correct within its own attribution window, but collectively they are triple-counting a single conversion and inflating reported performance across the board.
This is not a minor data discrepancy. It is a structural problem that distorts how marketing teams evaluate channel performance. When every platform reports strong results but overall pipeline is flat, the issue is almost always attribution overlap and double-counting.
The downstream consequences are real and costly. Teams scale channels that look productive in platform dashboards but do not actually drive revenue. They cut channels that are genuinely contributing to pipeline but never receive last-click credit because they operate earlier in the journey. Budget gets concentrated in the wrong places, and pipeline efficiency suffers.
Privacy changes have made this worse. iOS App Tracking Transparency updates and the ongoing deprecation of third-party cookies have reduced the reliability of pixel-based tracking across the web. When pixels fail to fire or are blocked by browsers and ad blockers, conversion events go unrecorded. The funnel data becomes incomplete, and the gaps are not always obvious. Teams may not realize how much signal they are losing until they compare pixel-reported conversions against CRM data and find a significant discrepancy.
The result is a funnel that looks measurable on the surface but is actually full of holes. Fixing it requires moving beyond platform-level reporting and building a unified view of the entire buyer journey. Understanding what causes funnel drop-off points is the first step toward plugging those gaps.
Mapping Touchpoints to Funnel Stages
Once you understand where the funnel breaks down, the next step is building a structured map of which channels and tactics belong at each stage and how to assign credit across them.
Start with channel-to-stage alignment. Not every marketing activity belongs at every funnel stage, and treating them interchangeably is one of the reasons funnel analysis gets muddled.
Awareness-stage channels are designed to generate reach and introduce your brand to cold audiences. These typically include paid social on LinkedIn and Meta, YouTube pre-roll, display advertising, SEO-driven content targeting broad informational queries, and podcast sponsorships. The goal is volume and relevance, not immediate conversion.
Consideration-stage channels are designed to deepen engagement with prospects who already know your brand. Retargeting campaigns, email nurture sequences, comparison content, webinars, and gated resources all belong here. These touchpoints should be doing the work of building preference and reducing evaluation friction.
Decision-stage channels are designed to close. Branded search ads, demo request flows, direct sales outreach, pricing page visits, and review site activity are all decision-stage signals. Marketing at this stage should reinforce the value proposition and remove any remaining objections.
With the channel map in place, the next question is how to assign credit across touchpoints. This is where understanding customer journey touchpoints becomes a practical business decision, not just an analytics concept.
First-touch attribution assigns all credit to the first touchpoint a prospect interacted with. It is useful for understanding which channels are best at generating awareness and bringing new prospects into the funnel. Last-click attribution assigns all credit to the final touchpoint before conversion. It is useful for evaluating which channels are most effective at closing, but it systematically undervalues everything that happened earlier in the journey. Linear attribution distributes credit equally across all touchpoints, which is fairer but still does not reflect the actual influence of each interaction. Data-driven attribution uses machine learning to weight touchpoints based on their observed contribution to conversion, making it the most accurate model when you have sufficient data volume.
The model you choose changes your budget decisions in concrete ways. If you rely on last-click attribution, you will likely over-invest in branded search and bottom-funnel retargeting while undervaluing the LinkedIn campaigns that are generating awareness and filling the top of your funnel. If you use data-driven attribution, you get a more accurate picture of which touchpoints are genuinely accelerating pipeline velocity.
A complete touchpoint map for a B2B SaaS company connects ad platform events to CRM stage progressions to revenue outcomes. It shows not just that a prospect converted, but which combination of touchpoints moved them from first impression to closed deal and how long each stage of that journey took.
The Role of Attribution in Making the Funnel Measurable
The consumer journey funnel becomes genuinely useful when attribution transforms it from a visual framework into a data system. Attribution is what connects every touchpoint to a pipeline outcome and ultimately to revenue. Without it, you have a map with no territory.
Modern marketing attribution works by capturing events across every channel and tying them to individual buyer journeys. When a prospect clicks a LinkedIn ad, visits your pricing page, downloads a guide, and then requests a demo, attribution connects all of those events to a single identity and maps them against your CRM data. The result is a complete picture of how that deal developed, which channels contributed, and at what stage each touchpoint had the most influence. Full-funnel attribution is what makes this level of visibility possible.
But accurate attribution depends on accurate data collection, and this is where many teams are losing ground without realizing it.
Pixel-based tracking, which has been the standard for web conversion measurement for years, is increasingly unreliable. Browser-level privacy restrictions, ad blockers, and the effects of iOS App Tracking Transparency have all reduced the percentage of conversion events that pixels successfully capture. When a conversion goes unrecorded, it does not just create a gap in your analytics. It also means that ad platform algorithms receive a weaker signal, which degrades their ability to optimize targeting and bidding for future campaigns.
Server-side tracking and Conversion API integrations address this directly. Instead of relying on a browser-side pixel to fire correctly, server-side tracking sends conversion data directly from your server to the ad platform. This approach bypasses browser restrictions entirely, resulting in more complete and accurate conversion data. Platforms like Meta and Google both support Conversion API integrations that allow marketers to send enriched, first-party conversion events that supplement or replace pixel data.
First-party data enrichment takes this a step further. When you collect data directly from your own systems, including your CRM, your product analytics, and your payment processor, and combine it with ad platform event data, you fill in gaps that pixel tracking would have missed. A prospect who converted through an organic channel still has a traceable journey if you have captured the right first-party signals along the way.
This is why platforms like Cometly are built around server-side tracking and Conversion API integration as core infrastructure. The goal is not just to report on conversions after the fact. It is to ensure that the data feeding your attribution models is complete enough to be trusted, so that the funnel insights you act on are based on reality rather than partial information.
When your funnel data is accurate, attribution stops being a reporting exercise and becomes a decision-making tool.
Funnel Optimization Strategies That Actually Move Revenue
Measuring the funnel is the prerequisite. Optimizing it is where the revenue impact happens.
The starting point for funnel optimization is identifying where prospects are dropping off. This requires analyzing stage-to-stage conversion rates across your funnel. What percentage of awareness-stage visitors move into consideration-stage engagement? What percentage of consideration-stage prospects request a demo? What percentage of demo requests convert to closed deals? Each of these ratios tells you something specific about where the funnel is healthy and where it is leaking.
When you layer attribution data on top of these conversion rates, you can go deeper. You can see whether the drop-off between consideration and decision is happening across all channels or only for prospects who came through specific sources. You might find that prospects who engaged with a particular piece of content convert at a significantly higher rate at the decision stage, which tells you something actionable about what to promote more aggressively in the consideration phase. Customer journey optimization at this level of granularity is what separates high-performing teams from those perpetually guessing.
AI-driven insights accelerate this process. Rather than manually analyzing campaign performance across every channel and every funnel stage, AI can surface which ads and campaigns are performing above baseline at each stage, flag underperforming segments, and recommend where budget reallocation would have the highest expected impact. This is particularly valuable for teams managing large campaign volumes across multiple platforms, where the data volume makes manual analysis impractical.
Cometly's AI ads manager is built specifically for this use case. It analyzes performance data across all connected ad platforms, identifies high-performing touchpoints at each funnel stage, and gives marketing teams the recommendations they need to scale what is working and cut what is not. Instead of relying on gut instinct or platform-reported metrics that may be inflated, teams get recommendations grounded in actual pipeline and revenue data.
The third lever in funnel optimization is the feedback loop between your attribution data and ad platform algorithms. When you send enriched conversion events back to Meta and Google via Conversion API integrations, you are giving those platforms more complete information about which users actually converted and which ones did not. This improves the quality of the signals their algorithms use for targeting and bidding optimization. Better signals mean the algorithm can find more users who resemble your actual customers, which reduces cost per acquisition and improves the efficiency of every funnel stage.
This feedback loop is not a one-time setup. It is a continuous cycle. Better data in produces better targeting, which produces higher-quality prospects entering the funnel, which produces more conversion data to feed back into the system. Over time, the funnel becomes progressively more efficient because the data powering it becomes progressively more complete. Marketing funnel analytics is the engine that keeps this cycle running.
Putting It All Together: From Funnel Insight to Confident Scaling
The consumer journey funnel is not a static diagram. It is a living system that requires continuous measurement, analysis, and optimization to produce reliable results.
The progression looks like this: you start by understanding the funnel stages and what buyer behavior looks like at each one. You build a touchpoint map that connects your channels and tactics to specific stages. You implement accurate tracking infrastructure, including server-side event collection and Conversion API integrations, to ensure your data is complete. You apply attribution models that give you a fair and accurate view of how credit should be distributed across the journey. And then you use that attribution data to identify bottlenecks, surface high-performing touchpoints, and reallocate budget toward the channels and campaigns that are actually moving pipeline.
Then you do it again. Because the funnel is not a problem you solve once. It is a system you improve continuously as your market evolves, your buyer behavior shifts, and your campaign mix changes.
This is exactly what Cometly is built to support. It connects your ad platforms, CRM, and website events into a single attribution layer that tracks the entire consumer journey funnel in real time. You get a unified view of every touchpoint from first ad click to closed-won revenue, with AI-driven recommendations that tell you where to scale and where to pull back. Instead of piecing together reports from five different platforms and trying to reconcile conflicting numbers, you have one source of truth that reflects what is actually happening across your funnel.
For B2B SaaS teams that are serious about scaling efficiently, that kind of visibility is not a nice-to-have. It is the foundation that every smart marketing decision is built on.
If you are ready to move from funnel theory to funnel data, Get your free demo and see how Cometly can give your team the attribution clarity it needs to scale with confidence.