
Picture this: A potential customer sees your Facebook ad on Monday morning during their commute. That afternoon, they search for your product category and click through from an organic result to read your blog post. Wednesday brings a retargeting ad on Instagram that catches their attention. Thursday, your email newsletter lands in their inbox with a compelling offer. Finally, on Friday, they click a Google search ad and complete the purchase.
Who gets credit for that conversion?
If you're using traditional attribution models, the answer is simple but misleading: probably that final Google ad gets 100% of the credit. But here's the reality—that conversion didn't happen because of one touchpoint. It happened because of all of them working together, each playing a distinct role in moving that customer toward a purchase decision.
This is where fractional attribution credit changes everything. Instead of forcing you to pick a single "winner" in the customer journey, fractional attribution recognizes that modern marketing is a team sport. It distributes conversion value proportionally across the touchpoints that actually contributed to the outcome. The result? A more accurate, nuanced understanding of what's really driving your revenue—and smarter decisions about where to invest your marketing budget.
Understanding the Foundation of Fractional Attribution
Let's start with the basics. Fractional attribution credit is the practice of dividing conversion value across multiple marketing touchpoints rather than assigning 100% credit to a single interaction. Think of it like splitting a restaurant bill among friends who all contributed to the meal—everyone gets credit for their part.
In traditional single-touch attribution models, you're forced to make an arbitrary choice. First-click attribution gives all the credit to the initial touchpoint that introduced the customer to your brand. Last-click attribution assigns everything to the final interaction before conversion. Both approaches ignore a fundamental truth about how people actually make purchase decisions in today's multi-channel world.
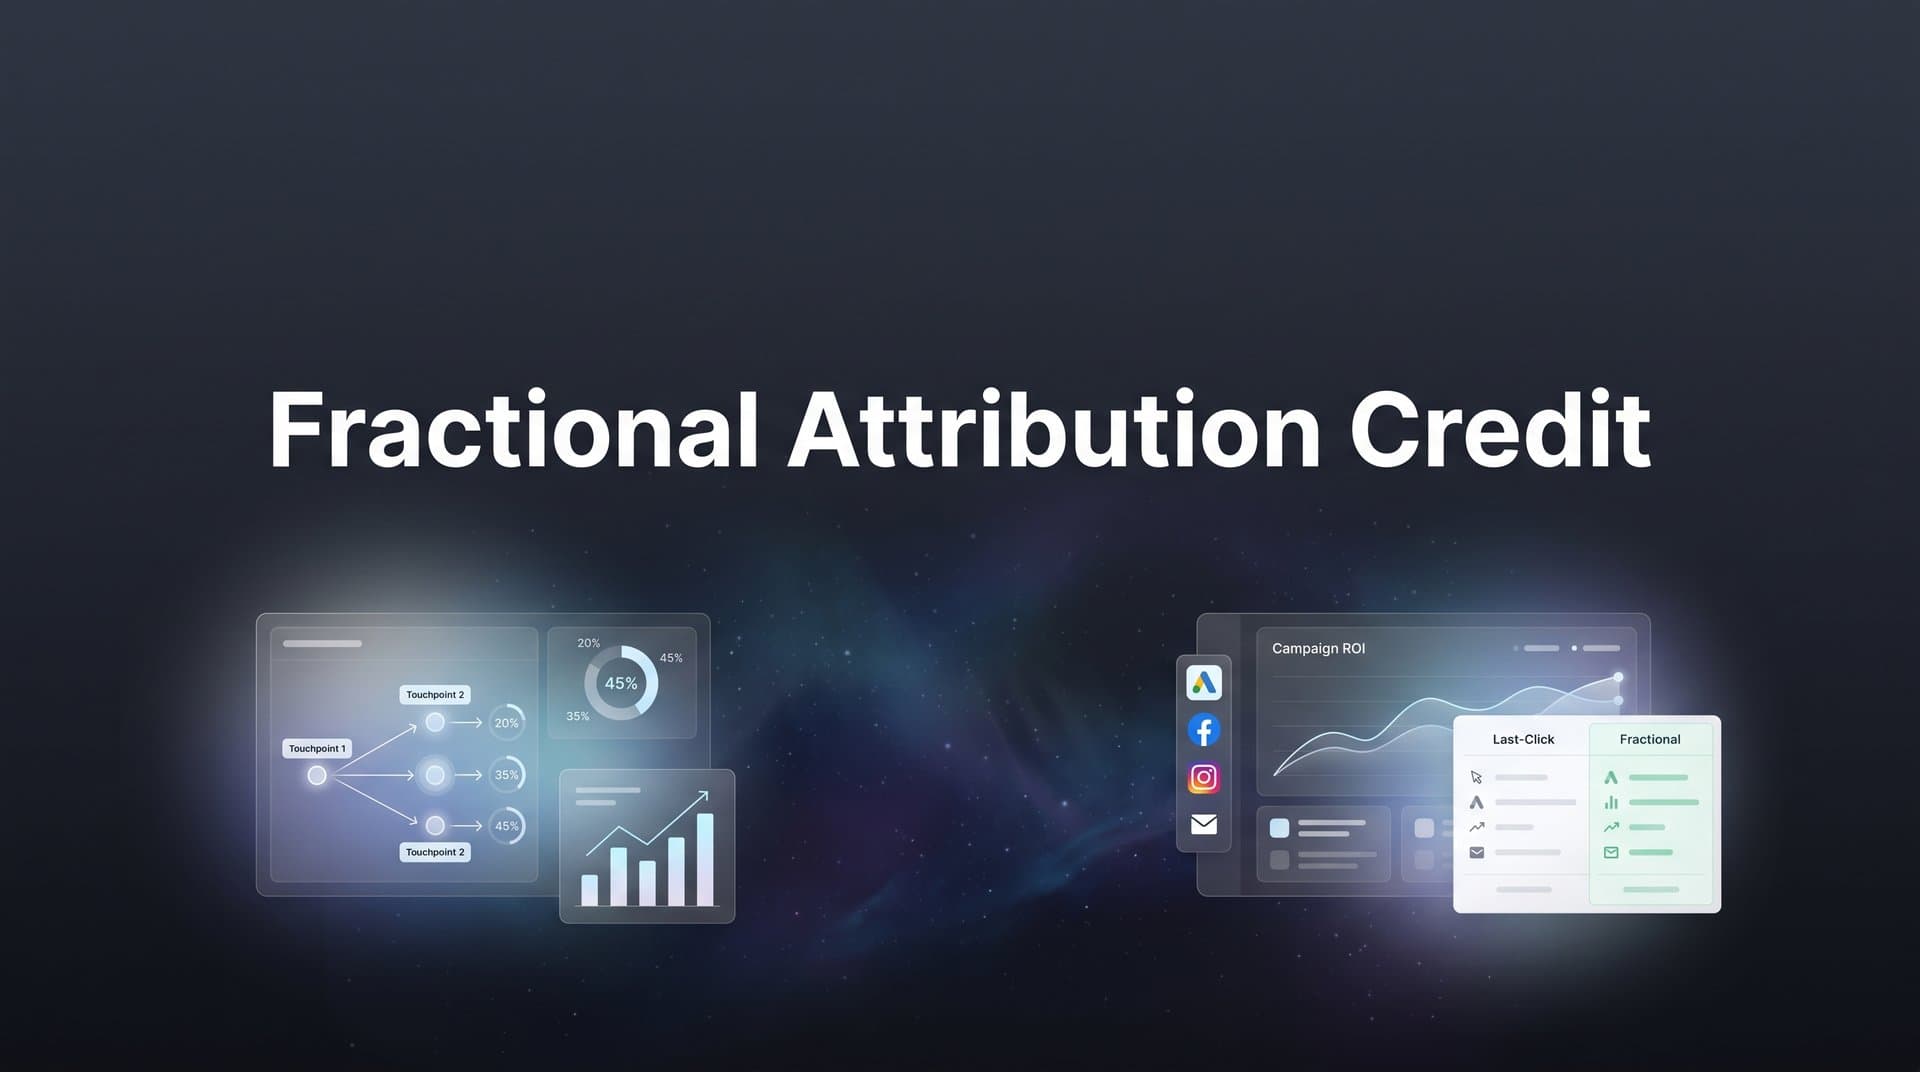
Here's the difference in action. Under last-click attribution, that Google search ad in our opening example receives 100% credit for a $500 conversion. The Facebook ad that started the journey? Zero credit. The blog post that educated the customer? Nothing. The retargeting ad that kept your brand top-of-mind? Ignored. The email that delivered a timely offer? Invisible.
With fractional attribution credit, each of these touchpoints receives proportional recognition for their contribution. Depending on the specific model you choose, that $500 conversion might be distributed as $100 to each of the five touchpoints, or weighted differently based on position or timing in the journey. Understanding the difference between single source attribution and multi touch attribution models is essential for making this transition.
This shift fundamentally changes how you evaluate marketing performance. Channels that appear to underperform under last-click attribution suddenly reveal their true value as essential contributors to the customer journey. Awareness campaigns that rarely close conversions directly show their impact on later-stage success. Middle-funnel content that nurtures consideration gets the recognition it deserves.
The core principle behind fractional attribution is elegantly simple: every meaningful interaction in the customer journey deserves proportional recognition. When you track a customer's path from first awareness to final conversion, you're seeing a story unfold—and every chapter matters. Fractional credit ensures your attribution model reflects that reality rather than oversimplifying it.
This approach becomes increasingly critical as customer journeys grow more complex. The average B2B buyer interacts with a brand across multiple channels and devices before making a purchase decision. E-commerce customers research products across social media, search engines, review sites, and brand websites before converting. Ignoring these touchpoints doesn't make them less important—it just makes your data less accurate.
The Most Common Fractional Credit Models
Once you understand the concept of fractional attribution, the next question becomes: how do you actually distribute that credit? Several established models offer different approaches, each with distinct strengths and appropriate use cases.
Linear Attribution: This is the most straightforward fractional model. Linear attribution divides conversion credit equally across all touchpoints in the customer journey. If a customer interacts with your brand five times before converting, each touchpoint receives 20% of the credit. Ten touchpoints? Each gets 10%.
The beauty of linear attribution lies in its simplicity and fairness. It treats every interaction as equally valuable, making no assumptions about which touchpoints matter more. This approach works particularly well when you're first moving beyond single-touch attribution and want a baseline understanding of how credit distributes across your marketing mix.
However, linear attribution has limitations. It assumes the first touchpoint—which introduced the customer to your brand—has the same impact as a middle touchpoint that simply maintained awareness. It treats the final touchpoint that triggered immediate action identically to an early-stage educational interaction. In reality, touchpoints often have different roles and impacts throughout the journey. Exploring multi touch attribution models for data analysis can help you understand these nuances.
Time-Decay Attribution: This model recognizes that touchpoints closer to conversion typically have more influence on the final purchase decision. Time-decay attribution assigns increasing fractional credit as you move forward through the customer journey, with the most recent interactions receiving the highest credit.
A common time-decay model uses a seven-day half-life, meaning a touchpoint from seven days ago receives half the credit of a touchpoint from today. A touchpoint from 14 days before conversion receives half the credit of the one from seven days ago, and so on. The exact decay rate can be customized based on your typical sales cycle length.
Time-decay attribution makes intuitive sense for many businesses. That final retargeting ad or promotional email often provides the immediate trigger that converts consideration into action. By weighting recent touchpoints more heavily, this model captures the reality that recency matters in purchase decisions.
This approach works particularly well for businesses with clear conversion triggers and relatively short consideration periods. If you run frequent promotions or time-sensitive offers, time-decay attribution reflects how those final touchpoints drive immediate action while still acknowledging the role of earlier awareness-building interactions.
Position-Based Attribution: Also called U-shaped attribution, this model takes a different approach to fractional credit distribution. It assigns heavier weighting to both the first and last touchpoints—typically 40% each—while distributing the remaining 20% fractionally among all middle interactions.
The logic here recognizes two critical moments in the customer journey: introduction and conversion. The first touchpoint introduces the customer to your brand and creates initial awareness. The last touchpoint triggers the final purchase decision. Both deserve significant credit for their distinct but crucial roles.
Position-based attribution particularly benefits businesses focused on brand building and customer acquisition. If you invest heavily in top-of-funnel awareness campaigns, this model ensures those efforts receive appropriate credit even when conversions happen through different channels later in the journey.
The middle touchpoints still receive fractional credit under this model—they're not ignored like in single-touch attribution. But the recognition that first and last interactions often play outsized roles makes position-based attribution more nuanced than simple linear distribution.
Fractional Credit Calculations in Real Scenarios
Theory becomes much clearer with concrete examples. Let's walk through how fractional attribution credit actually works using a realistic customer journey and see how different models distribute value.
Imagine a customer journey that generates a $500 conversion. The touchpoints are:
1. Facebook ad click (Day 1)
2. Organic search visit to blog post (Day 3)
3. Instagram retargeting ad view (Day 5)
4. Email newsletter click (Day 7)
5. Google search ad click leading to conversion (Day 8)
Under Linear Attribution: Each of the five touchpoints receives equal credit. The calculation is straightforward: $500 divided by 5 touchpoints equals $100 per touchpoint. Your Facebook ad gets $100 in attributed value, the blog post gets $100, the Instagram retargeting gets $100, the email gets $100, and the final Google ad gets $100.
This distribution tells you that all five channels contributed to the conversion. When you aggregate this data across hundreds or thousands of conversions, you'll see which channels consistently appear in winning customer journeys, even if they rarely get last-click credit. Implementing cross channel attribution tracking helps you capture these complete journeys.
Under Time-Decay Attribution: The distribution shifts toward more recent interactions. Using a standard time-decay model with a seven-day half-life, the Google search ad (most recent) might receive $180 in attributed value. The email from one day earlier gets $150. The Instagram ad from three days before conversion receives $90. The blog post from five days before gets $50. The Facebook ad from a week ago receives $30.
Notice how the total still equals $500, but the distribution reflects recency. This model shows you that while the Facebook ad initiated the journey, the email and final search ad had the strongest influence on the immediate conversion decision.
Under Position-Based Attribution: The first and last touchpoints receive the highest credit. The Facebook ad (first touch) gets $200 in attributed value. The Google search ad (last touch) also receives $200. The three middle touchpoints—blog post, Instagram ad, and email—split the remaining $100, receiving approximately $33 each.
This distribution emphasizes the critical role of both customer acquisition and conversion triggers while still acknowledging that middle touchpoints contributed to nurturing the customer along the journey.
Here's what becomes immediately clear when you compare these models: the same customer journey produces dramatically different credit distributions depending on your chosen attribution approach. Under linear attribution, all channels receive equal recognition. Under time-decay, recent touchpoints dominate. Under position-based, the first and last interactions stand out.
So which model is "right"? The answer depends on your business model, sales cycle, and marketing strategy. What matters most is understanding how each model distributes credit and choosing the one that best reflects how your customers actually make purchase decisions.
When you analyze fractional credit data in your attribution platform, you're looking for patterns across many customer journeys. A channel that consistently receives fractional credit—even if it's not the final touchpoint—is contributing real value to your conversions. This insight helps you make smarter decisions about budget allocation and campaign optimization.
How Fractional Attribution Transforms Budget Decisions
Understanding fractional attribution credit isn't just an academic exercise—it fundamentally changes how you allocate marketing budgets and evaluate channel performance. The insights from fractional credit often reveal that your most valuable channels aren't the ones receiving the most credit under single-touch attribution.
Consider awareness-stage campaigns like brand-focused social media ads or top-of-funnel content marketing. Under last-click attribution, these channels typically show poor direct conversion performance. They introduce customers to your brand, but those customers rarely convert immediately. Traditional attribution makes these channels look like underperformers, tempting you to cut their budgets.
Fractional attribution tells a different story. When you examine customer journeys holistically, you discover that these awareness campaigns consistently appear as first or second touchpoints in high-value conversions. They may not close deals directly, but they initiate journeys that eventually convert through other channels. Without that initial awareness touchpoint, many of those conversions would never happen at all.
This insight prevents a dangerous mistake: cutting channels that appear low-performing under last-click but contribute significantly in multi-touch journeys. Many businesses have scaled back brand awareness campaigns based on last-click data, only to see overall conversions decline weeks later as the pipeline of aware customers dries up. Learning how to optimize ROAS with attribution data can prevent these costly errors.
Let's look at how this plays out with real budget decisions. Imagine you're running both Facebook awareness campaigns and Google search ads. Last-click attribution shows Google generating 80% of conversions while Facebook drives only 20%. The obvious move seems to be shifting more budget to Google.
But fractional attribution reveals that 60% of Google conversions involved a Facebook touchpoint earlier in the journey. Those customers discovered your brand through Facebook, researched your solution, and eventually converted through a branded Google search. If you cut Facebook spending, you're not just losing that 20% of direct conversions—you're potentially losing a large portion of what currently appears as Google conversions.
Fractional credit also helps you evaluate the true cost per acquisition across channels. A channel that receives 100% credit for conversions under last-click attribution might appear to have a $50 CPA. But if fractional attribution shows that channel typically receives only 40% credit in multi-touch journeys, the true CPA is closer to $125 when you account for the cost of other contributing touchpoints.
This more accurate cost understanding helps you set realistic performance targets and make fair comparisons across channels with different roles in the customer journey. Top-of-funnel channels naturally have higher CPAs when measured in isolation, but fractional attribution shows their contribution to overall conversion efficiency.
The budget allocation implications extend to ad platform optimization as well. When you understand which channels work together to drive conversions, you can coordinate campaigns more effectively. You might discover that your email nurture sequences perform best when customers have recently seen retargeting ads, suggesting you should maintain consistent retargeting investment even when those ads don't generate many last-click conversions.
Making Fractional Attribution Work Without the Headaches
Understanding fractional attribution credit is one thing. Actually implementing it across your marketing stack is another challenge entirely. The good news? Modern attribution platforms handle most of the complexity for you, but you still need to understand the foundational requirements.
The first requirement is comprehensive touchpoint tracking. Fractional attribution only works if you can see the complete customer journey across channels, devices, and sessions. That means tracking every ad click, organic visit, email interaction, and conversion event in a unified system that can connect them to individual users.
This is harder than it sounds. A customer might click your Facebook ad on their phone during lunch, visit your website from a desktop computer at work, receive your email on their tablet, and finally convert on their laptop at home. Without proper cross device attribution tracking, these appear as four separate users rather than one continuous journey.
Server-side tracking plays a crucial role in capturing complete customer journeys for accurate fractional credit. Unlike client-side tracking that relies on browser cookies and JavaScript, server-side tracking captures data directly from your server, making it more reliable and resistant to ad blockers, privacy tools, and tracking limitations.
With iOS privacy changes and increasing browser restrictions on third-party cookies, server-side tracking has become essential for maintaining attribution accuracy. It ensures you're not missing critical touchpoints that would otherwise disappear from your customer journey data, which would make your fractional credit calculations incomplete and misleading. Many marketers are losing attribution data due to privacy updates without realizing the impact.
Attribution platforms automate the heavy lifting of fractional credit calculations. Once you've connected your data sources—ad platforms, website analytics, CRM, email marketing tools—the platform tracks touchpoints, identifies customer journeys, and applies your chosen attribution model to distribute credit automatically.
These platforms surface actionable insights that would be nearly impossible to calculate manually. You can see which channels consistently appear in high-value customer journeys, how credit distribution changes across different attribution models, and where budget adjustments could improve overall performance.
The key is choosing an attribution solution that makes fractional credit analysis accessible rather than overwhelming. Look for platforms that let you compare multiple attribution models side-by-side, filter journeys by conversion value or customer segment, and export data in formats your team can actually use for decision-making.
Implementation doesn't require perfection from day one. Start by ensuring your major marketing channels are properly tracked and connected. Focus on capturing the most important touchpoints in your customer journey—typically paid ads, organic search, email, and direct website visits. You can expand tracking to additional channels as your attribution strategy matures. Our guide on how to get started with attribution tracking walks you through the initial setup.
The goal isn't to track every possible interaction with perfect precision. It's to capture enough of the customer journey that your fractional credit calculations reflect reality better than single-touch attribution does. Even if you're missing some touchpoints, distributing credit across the interactions you do track provides more accurate insights than assigning everything to first or last click.
Selecting Your Fractional Attribution Approach
With multiple fractional attribution models available, how do you choose the right one for your business? The answer depends on your sales cycle, marketing strategy, and what you're trying to optimize.
Businesses with longer sales cycles often benefit from time-decay attribution. If your typical customer journey spans weeks or months—common in B2B, high-ticket consumer products, or complex services—time-decay recognizes that recent touchpoints typically have more influence on the final conversion decision while still crediting earlier awareness-building interactions.
Brand-focused businesses may prefer position-based attribution. If you invest heavily in brand awareness campaigns and customer acquisition, U-shaped attribution ensures those first-touch interactions receive appropriate credit even when conversions happen through different channels later. This model works well for businesses where brand discovery is a distinct, valuable moment in the customer journey.
E-commerce businesses with shorter consideration periods often start with linear attribution. When customers discover your products and convert within days or even hours, treating all touchpoints equally provides a balanced baseline view of channel contribution without making assumptions about which interactions matter most. Implementing proper ecommerce attribution tracking solutions ensures you capture these rapid customer journeys accurately.
Here's the practical recommendation: start with linear attribution as your baseline. Linear provides a straightforward, assumption-free view of how credit distributes across your marketing mix. Run this model for at least a full month to understand the patterns in your customer journeys.
Then test more sophisticated models. Compare linear attribution against time-decay and position-based models using the same data set. Look at how credit shifts across channels under different models. This comparison reveals which attribution approach best reflects your understanding of how customers actually move through your funnel.
Pay attention to channels where credit distribution changes dramatically between models. If a channel receives 30% of credit under linear attribution but only 10% under time-decay, it's primarily playing an early-stage awareness role. If a channel jumps from 15% to 40% credit when you switch to position-based attribution, it's either driving acquisition or closing conversions—both valuable roles that deserve recognition.
The importance of comparing models side-by-side cannot be overstated. No single attribution model is objectively "correct"—they're different lenses for viewing the same customer journey data. By comparing multiple models, you develop a nuanced understanding of how each channel contributes across different stages of the funnel. Understanding Google Analytics vs attribution platforms can also help you choose the right tools for this analysis.
Some attribution platforms offer data-driven attribution models that use machine learning to determine fractional credit based on actual conversion patterns in your data. These models analyze thousands of customer journeys to identify which touchpoints statistically correlate with higher conversion rates, then assign credit accordingly. If you have sufficient conversion volume—typically hundreds of conversions per month—data-driven attribution can provide the most accurate fractional credit distribution for your specific business.
Remember that your attribution model isn't permanent. As your marketing mix evolves, your attribution approach should evolve with it. Review your model choice quarterly, especially after major changes to your channel strategy or customer acquisition approach.
Moving Forward with Smarter Attribution
Fractional attribution credit provides a more accurate, nuanced view of marketing performance than single-touch models ever could. Instead of forcing you to arbitrarily choose between first-click and last-click attribution—both of which ignore most of the customer journey—fractional models distribute conversion value across the touchpoints that actually contributed to the outcome.
The key models each serve different purposes. Linear attribution offers a straightforward baseline by treating all touchpoints equally. Time-decay attribution recognizes that recent interactions typically have more influence on conversion decisions. Position-based attribution emphasizes the critical roles of both customer acquisition and final conversion triggers. Each model reveals different insights about how your marketing channels work together to drive results.
The business impact goes far beyond academic measurement accuracy. Fractional attribution prevents the costly mistake of cutting channels that appear low-performing under last-click but contribute significantly to multi-touch customer journeys. It reveals the true value of awareness and consideration-stage campaigns. It enables smarter budget allocation based on actual channel contribution rather than arbitrary credit assignment.
Implementation requires comprehensive touchpoint tracking and the right technology foundation. Server-side tracking ensures you're capturing complete customer journeys despite privacy changes and tracking limitations. Modern attribution platforms automate fractional credit calculations and surface actionable insights without requiring manual analysis of thousands of customer journeys.
Now it's time to audit your current attribution approach. If you're still relying on last-click or first-click attribution, you're making budget decisions based on incomplete data. If you've never compared multiple attribution models side-by-side, you don't fully understand how credit distributes across your marketing mix. If you're not tracking touchpoints across devices and sessions, your fractional credit calculations are missing critical pieces of the customer journey.
The good news? Moving to fractional attribution doesn't require ripping out your entire marketing stack or starting from scratch. It starts with connecting your data sources, implementing proper tracking, and choosing an attribution platform that makes fractional credit analysis accessible to your team.
Ready to elevate your marketing game with precision and confidence? Discover how Cometly's AI-driven recommendations can transform your ad strategy—Get your free demo today and start capturing every touchpoint to maximize your conversions.


