Most marketing teams running paid ads are making budget decisions with incomplete information. Channels report different numbers. The CRM shows one story. Ad platforms show another. And somewhere between the first click and a closed deal, the truth gets lost.
This is what ad spend optimization without data actually looks like in practice: gut-feel decisions dressed up as strategy. The problem is not that marketers are careless. The problem is that the tools they rely on were never designed to show the full picture. Platform-native dashboards report on their own activity, not your business outcomes. UTM parameters break. Cookies get blocked. And without a reliable connection between ad spend and revenue, you are essentially flying blind.
This guide is for marketing teams and growth leaders who are tired of optimizing for metrics that do not connect to revenue. Whether you are running campaigns on Meta, Google, LinkedIn, or TikTok, the steps below will help you move from guesswork to a data-backed optimization process.
You will learn how to audit what you are currently tracking, identify where data breaks down, establish a reliable tracking foundation, and build a decision-making framework that ties every dollar of ad spend to actual pipeline and revenue. By the end, you will have a clear, repeatable system for making smarter budget decisions, not based on which channel claims the most credit, but based on verified, first-party data that reflects your real customer journey.
Step 1: Audit Your Current Tracking Setup for Gaps
Before you can fix anything, you need to know exactly what is broken. Most teams assume their tracking is working because campaigns are running and conversions are appearing in dashboards. That assumption is often wrong.
Start by listing every paid channel you are currently running: Meta, Google, LinkedIn, TikTok, and any others. For each channel, answer three questions. Is the pixel or tag installed and firing correctly? Are UTM parameters consistently applied to every campaign URL? And are the conversion events you are tracking actually connected to business outcomes?
Checking pixel health is straightforward. Use Meta's Pixel Helper, Google Tag Assistant, or LinkedIn's Insight Tag validator to confirm that tags are firing on the right pages. A pixel that loads on the homepage but not on the thank-you page after a form submission is worse than useless because it creates false confidence.
UTM consistency is where many teams quietly fall apart. If some campaigns have UTMs and others do not, your analytics data becomes fragmented. Build a UTM naming convention and enforce it across every campaign, every ad set, and every creative. Without this, you cannot reliably attribute traffic sources in your CRM or analytics platform.
Next, look at how conversion events are defined across each platform. Are you tracking form submissions, demo bookings, and trial starts? Or are you tracking page views and button clicks that sound meaningful but do not represent actual intent? The goal here is to match your tracked events to real business outcomes, not platform-friendly proxies.
Here is where the most important discrepancy usually surfaces: compare platform-reported conversions against what your CRM actually shows for the same time period. If Meta says you generated 80 leads last month but your CRM shows 40, you have an attribution overlap problem. Platforms tend to claim credit using their own attribution windows, which often overlap with other channels and inflate reported results. This is a known industry issue, and it is one of the primary reasons ad spend optimization without reliable data leads to poor budget decisions.
Success indicator: You can produce a written list of every tracking gap by channel, including where pixels are misfiring, where UTMs are missing, and where conversion event definitions do not match actual business outcomes.
Step 2: Define the Conversion Events That Actually Matter
Not all conversions are created equal. A click is not a lead. A lead is not a qualified opportunity. And a qualified opportunity is not closed-won revenue. Yet many teams optimize their campaigns around whichever event is easiest to track rather than whichever event is most meaningful to the business.
The first thing to do here is separate vanity metrics from revenue-connected events. Clicks, impressions, and even raw lead volume can look impressive in a weekly report while contributing almost nothing to pipeline. The question to ask is: does this event tell us something about whether a prospect is likely to become a paying customer?
Map your funnel from top to bottom: ad click, landing page visit, lead form submission, demo or trial request, sales-qualified opportunity, and closed-won revenue. Each of these stages represents a meaningful transition in the buyer journey, and each deserves a corresponding conversion event in your tracking setup.
For B2B SaaS teams, mid-funnel events are often the most valuable optimization signals. A pricing page visit, a demo request, or a trial activation tells you far more about purchase intent than a top-of-funnel content download. If your campaigns are only optimizing toward form fills, you are likely attracting a broad audience that includes a high proportion of people who will never convert to paying customers.
Aligning marketing and sales on conversion definitions is also critical at this stage. What marketing calls a lead and what sales calls a qualified lead are often very different things. If your campaigns are being optimized toward marketing-qualified leads that sales consistently rejects, you are spending budget efficiently toward the wrong outcome. Build a shared definition of what counts as a meaningful conversion at each stage, and document it.
Aim to define three to five conversion events that span the funnel. This gives your ad platforms enough signal to optimize intelligently while ensuring that you are measuring progress toward outcomes that actually matter to the business. Understanding conversion rate optimization best practices can help you identify which events deserve the most attention at each stage.
Success indicator: You have a documented list of three to five conversion events, each tied to a specific funnel stage and connected to a real business outcome, with agreement from both marketing and sales on the definitions.
Step 3: Implement Server-Side Tracking to Capture What Pixels Miss
Even if your pixels are installed correctly and your UTMs are consistent, browser-based tracking is losing ground. Ad blockers prevent pixels from firing. iOS privacy changes, starting with the iOS 14 update, significantly reduced the data that Meta's pixel could collect from Apple device users. And as third-party cookie support continues to be restricted across major browsers, client-side tracking is becoming an increasingly unreliable foundation for attribution.
Server-side tracking solves this problem by moving the conversion event signal from the user's browser to your server. Instead of relying on a pixel in the user's browser to fire and report back to the ad platform, your server sends the conversion data directly to the platform's API. This bypasses the client-side limitations entirely.
The two most important implementations for most B2B SaaS teams are Meta's Conversion API (CAPI) and Google's Enhanced Conversions. Both are documented, supported solutions from the platforms themselves, designed specifically to supplement pixel-based tracking and recover lost conversion data.
Meta's Conversion API allows you to send web events, app events, and offline events directly from your server to Meta. If you want a detailed walkthrough of this process, syncing conversion data to Facebook Ads covers the technical steps in full. Google's Enhanced Conversions work similarly, allowing you to send hashed first-party data alongside your standard conversion tags to improve match rates and attribution accuracy.
One critical technical requirement when running both pixel and server-side tracking simultaneously is event deduplication. If a conversion fires from both the browser pixel and the server, you will count it twice unless deduplication is configured correctly. Both Meta and Google provide deduplication mechanisms using event IDs that match server events to browser events. Getting this right is essential, because double-counting conversions is just as misleading as missing them.
Beyond recovering lost attribution data, server-side tracking has a second major benefit: it improves the quality of data fed back to ad platform algorithms. Platforms like Meta and Google use conversion signals to optimize targeting and bidding. When those signals are incomplete due to browser-side limitations, the algorithm is working with degraded information. Server-side tracking gives the algorithm a cleaner, more complete signal, which typically improves campaign performance over time.
First-party data collected directly from your own properties is now the most reliable signal available for both attribution and optimization. A strong first-party data strategy is how you protect and amplify that signal across every channel you run.
Success indicator: Server-side events are firing for your key conversion events, deduplication is configured, and you can verify that event match rates are within an acceptable threshold in your platform dashboards.
Step 4: Connect Ad Data to CRM and Revenue Outcomes
Here is the core problem with most B2B marketing setups: ad platform data and CRM data live in completely separate systems with no reliable connection between them. The ad platform knows that someone clicked an ad and filled out a form. The CRM knows that a deal closed six weeks later. But neither system knows what the other knows, which means no one can answer the question that actually matters: which campaigns generated revenue?
The solution starts at the point of form submission. When a prospect fills out a form on your website, that is the moment when you can capture and preserve the ad source data. Use hidden fields in your forms to automatically capture UTM parameters from the URL. These hidden fields pass campaign, source, medium, content, and term data directly into your CRM record alongside the lead's contact information.
Once UTM data is flowing into your CRM, you can connect it to deal stages. As leads move through the pipeline from marketing-qualified to sales-qualified to closed-won, the original ad source travels with them. This means you can eventually pull a report showing not just which campaigns generated leads, but which campaigns generated pipeline and which campaigns generated closed-won revenue. That is a fundamentally different and more valuable view of performance.
For B2B SaaS teams using Stripe or similar subscription billing tools, the connection can go one level deeper. By linking Stripe revenue data to the original ad source in your CRM, you can attribute monthly recurring revenue and annual contract value back to specific campaigns. This turns ad performance reporting from a lead-counting exercise into a genuine revenue analysis.
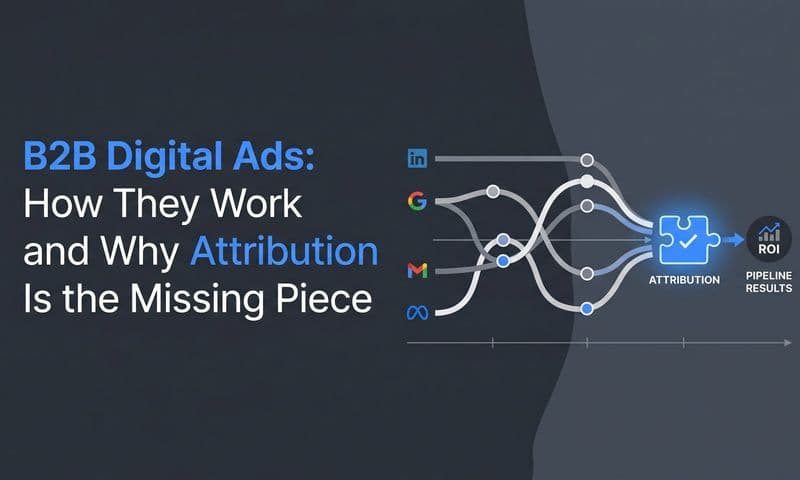
Multi-touch attribution is the framework that makes this work for B2B buying cycles. A typical B2B SaaS deal involves multiple touchpoints across multiple channels over weeks or months. A prospect might first encounter your brand through a LinkedIn post, later click a Google Search ad, then attend a webinar before finally converting through a retargeting campaign. Last-click attribution gives all the credit to the retargeting campaign and ignores everything that came before it. Multi-touch attribution distributes credit across all touchpoints, giving you a more accurate picture of how each channel contributes to the overall journey.
This connection between ad data and revenue outcomes is what separates teams that are genuinely optimizing from teams that are just managing spend. Without it, you are making budget decisions based on which channel claims the most conversions, not which channel actually drives the most revenue.
Success indicator: You can pull a report from your CRM showing closed-won revenue attributed to specific campaigns, channels, and ad sources, not just lead counts.
Step 5: Build a Channel-Level Performance Scorecard
Now that your tracking is solid and your CRM is connected, you have the raw material to build something genuinely useful: a single view that compares all of your paid channels on the same metrics, using the same attribution model, without relying on platform-reported numbers.
The core metrics for this scorecard should span the funnel. Include cost per lead, cost per qualified opportunity, cost per acquisition, pipeline generated, and revenue attributed. These metrics tell a complete story from top to bottom, and they allow you to identify exactly where each channel is strong and where it breaks down.
Avoid the temptation to compare channels using their own native metrics. Meta reports on reach and frequency. Google reports on impression share and quality score. LinkedIn reports on engagement rate. These are all useful within their respective platforms, but they are not comparable across channels, and they do not connect to revenue. A channel-level scorecard needs a common language, and that language is pipeline and revenue.
Normalizing performance data means applying a consistent attribution model across all channels before making comparisons. If you use last-click attribution for Google and first-touch for LinkedIn, the comparison is meaningless. Pick one model, apply it consistently, and stick with it long enough to build a meaningful data set. Using a data analytics dashboard that consolidates all channel data in one place makes this normalization significantly easier to maintain.
Once you have consistent data, the patterns become clear. Some channels generate high lead volume but low pipeline conversion rates, which often signals a targeting or audience quality problem. Other channels generate fewer leads but at a significantly higher qualification rate, which often signals stronger intent or better audience fit. The scorecard makes these patterns visible.
Use this visibility to guide reallocation decisions. Shifting budget away from channels with high cost-per-acquisition and low pipeline contribution toward channels with better efficiency is how marketing spend optimization actually works. Without the scorecard, those decisions are guesses. With it, they are informed choices backed by data.
Review the scorecard on a consistent cadence. For active campaigns, a weekly review allows you to catch underperformance early. For strategic budget decisions, a monthly review gives you enough data to identify trends rather than reacting to short-term noise.
Success indicator: You have a single dashboard where every paid channel is compared on revenue and pipeline metrics, using a consistent attribution model, updated on a regular schedule.
Step 6: Use Attribution Models to Guide Budget Reallocation
Attribution models are not magic. No single model perfectly captures the complexity of a B2B buying journey. But using one model consistently is dramatically better than using none, and choosing the right model for your sales cycle can completely change which channels appear efficient.
Here is how the main models work. First-touch attribution gives all credit to the first interaction a prospect had with your brand. Last-click attribution gives all credit to the final interaction before conversion. Linear attribution distributes credit equally across every touchpoint in the journey. Time-decay attribution gives more credit to touchpoints that occurred closer to the conversion. Data-driven attribution uses machine learning to assign credit based on observed patterns in your conversion data.
For B2B SaaS companies with sales cycles that stretch across weeks or months and involve multiple decision-makers, linear or time-decay models typically reflect reality better than single-touch models. Last-click attribution is particularly problematic in these environments because it systematically undervalues channels that drive awareness and early-stage engagement while overvaluing whatever channel happened to be last in the sequence.
One of the most revealing exercises you can run is switching from last-click to multi-touch attribution and comparing the results. Channels that looked inefficient under last-click often turn out to be significant contributors to pipeline when you can see their role across the full journey. LinkedIn is a common example: it rarely gets last-click credit, but it frequently appears as an early or mid-funnel touchpoint in deals that eventually close through other channels.
This insight has direct budget implications. If a channel is consistently assisting conversions but rarely closing them, cutting its budget based on last-click data will damage your pipeline without the metrics immediately showing why. Attribution data protects those channels by making their contribution visible. Learning how to improve data-driven decision making ensures you are interpreting these signals correctly before acting on them.
Before making major budget changes based on a new attribution model, run parallel models for at least 30 days. This gives you enough data to build confidence in what the model is showing and reduces the risk of making a significant reallocation based on a short-term anomaly.
The goal is not to find the perfect attribution model. The goal is to make budget decisions that are backed by data rather than gut instinct or platform-reported ROAS figures that are often inflated by attribution overlap.
Success indicator: Your budget reallocation decisions reference attribution data from a consistently applied model, and you can explain why each channel receives the budget it does based on its contribution to pipeline and revenue.
Putting It All Together: From Blind Spending to Confident Optimization
The six steps in this guide are not a one-time project. They are a repeatable system. Tracking gaps reappear when new campaigns launch. Conversion event definitions drift as the business evolves. Attribution models need revisiting as sales cycles change. Building this as an ongoing practice, rather than a quarterly audit, is what separates teams that consistently improve from teams that stay stuck.
Here is a quick checklist to confirm you have completed each step:
Tracking audit complete: Every channel has been reviewed for pixel health, UTM consistency, and conversion event accuracy.
Conversion events defined: Three to five events are documented, tied to real funnel stages, and agreed upon by both marketing and sales.
Server-side tracking live: Conversion API and Enhanced Conversions are implemented with deduplication configured and match rates verified.
CRM connected: UTM data is flowing into your CRM at the point of form submission, and deal stages are linked to ad source data.
Scorecard built: All channels are compared on pipeline and revenue metrics using a consistent attribution model.
Attribution model selected: Budget decisions are backed by multi-touch attribution data, not platform-reported ROAS.
This is exactly what Cometly is built to do. Cometly connects your ad platforms, CRM, and website into a single attribution and analytics platform, handling everything from server-side tracking and Conversion API integration to multi-touch attribution and AI-driven recommendations. Instead of stitching together six different tools and manual processes, you get one place where every touchpoint from first ad click to closed-won revenue is visible, comparable, and actionable.
Ad spend optimization without reliable data is not optimization. It is guessing with a budget. The system above gives you the foundation to stop guessing and start making decisions you can defend with evidence. Get your free demo and see how Cometly closes the loop between your ad spend and the revenue it actually drives.