Every marketer knows the feeling. You check your dashboard on a Monday morning, see that last week's campaign underperformed, and scramble to figure out what went wrong. By the time you've diagnosed the issue, reallocated budget, and launched a fix, another week of spend has already gone out the door. This is reactive marketing, and it's expensive.
The real competitive edge isn't knowing what happened. It's knowing what's about to happen. That shift, from looking backward to looking forward, is exactly what separates a modern marketing analytics dashboard from a traditional reporting tool.
Today's most capable dashboards don't just summarize past performance. They analyze patterns across channels, time periods, and audience behaviors to surface signals about where things are heading. A campaign trending toward fatigue before ROAS drops. A channel combination that consistently predicts conversion. A budget allocation that's quietly underperforming a better alternative. These are the insights that let marketers act before money is wasted, not after.
This article breaks down exactly how a marketing analytics dashboard helps predict the future of your campaigns: what predictive capability actually looks like, which data signals power it, how attribution models shape what the dashboard can and can't see, and what you can do with those forward-looking insights once you have them.
Reporting on the Past vs. Anticipating What Comes Next
Traditional dashboards are built around a simple question: what happened? They surface clicks, impressions, conversions, and cost data after the fact. That information is useful, but it creates an inherent lag between insight and action. By the time a trend shows up clearly in a retrospective report, you've already been running the wrong strategy for days or weeks.
Predictive dashboards ask a different question: what is likely to happen next? Instead of simply displaying current metrics, they analyze how those metrics are moving over time, across channels, and across audience segments. The goal is to surface patterns before they fully materialize in your results.
Think of it like the difference between a weather report and a weather forecast. A traditional dashboard tells you it rained yesterday. A predictive dashboard tells you to bring an umbrella tomorrow.
This shift is the difference between descriptive analytics and predictive analytics. Descriptive analytics summarizes what occurred. Predictive analytics uses historical patterns, trend velocity, and behavioral signals to model what is likely to occur next. Neither replaces the other, but predictive capability is what turns a dashboard from a record-keeping tool into a decision-support system.
The practical implications are significant. A campaign that looks healthy today based on last week's ROAS might be showing early signs of audience fatigue if you look at engagement rate trends over the past 10 days. A channel that appears underperforming on a single-day view might be a consistent top contributor when you look at its role across multi-session conversion paths. Predictive dashboards surface these signals before they become obvious problems.
There's one prerequisite for all of this to work: clean, complete data flowing from every touchpoint. Predictive analytics built on partial data produces partial predictions. If your dashboard is missing conversion events, ignoring upper-funnel interactions, or relying solely on last-click attribution, the patterns it surfaces will be distorted. The foundation of forward-looking insight is comprehensive backward-looking data collection.
The Data Signals That Power Predictive Accuracy
Predictive capability is only as reliable as the data feeding it. This is where many marketing teams hit a wall. They have dashboards, they have data, but the data has gaps. And gaps in your data create blind spots in your predictions.
The most significant source of data gaps in recent years has been the shift in privacy policies across browsers and mobile operating systems. iOS privacy updates changed how user behavior is tracked across apps and websites, and browser-level restrictions have reduced the effectiveness of client-side tracking pixels. The result is that many marketing teams are making decisions based on incomplete conversion data without fully realizing it.
Server-side tracking is the most effective solution to this problem. Rather than relying on a browser-based pixel to fire when a user converts, server-side tracking captures conversion events at the server level, independent of browser behavior or device settings. This means conversions that would have been lost due to ad blockers, browser restrictions, or privacy settings are still recorded and attributed correctly.
For predictive marketing analytics, this matters enormously. If your dashboard is missing a meaningful portion of your conversion events, the trend lines it draws are based on incomplete information. The patterns it identifies, and the predictions it makes from those patterns, will systematically underestimate performance in certain channels and overestimate it in others.
Multi-touch attribution data is the second critical ingredient. Last-click attribution tells you which ad a customer clicked immediately before converting. That's useful, but it misses everything that happened before that final click. Multi-touch attribution maps the full sequence of interactions: the awareness ad on Meta, the retargeting campaign on Google, the branded search that closed the deal.
This full-journey data is especially powerful for prediction because it reveals which channel combinations and sequences consistently lead to conversion. Instead of seeing that Google Search drove a conversion, you can see that Meta awareness followed by Google Search followed by direct visit is a high-converting sequence. That's a pattern you can model forward. You can identify users currently in the early stages of that sequence and predict their likelihood of converting, then adjust your targeting and budget accordingly.
CRM integration adds another layer. When your dashboard connects marketing activity to actual pipeline and revenue data, you can see not just which ads drove leads but which leads became customers. That closed-loop data dramatically improves the quality of patterns the system can identify and the accuracy of the predictions it surfaces.
How Attribution Models Shape the Dashboard's View of the Future
Attribution models are not just a technical configuration choice. They fundamentally determine what your dashboard believes is working, which in turn shapes every prediction and recommendation the system makes.
Last-click attribution assigns all credit to the final touchpoint before conversion. On the surface, this seems logical. The last click is the one that "closed the deal." But in practice, this model systematically undervalues every channel that contributed earlier in the journey. Awareness campaigns on Meta, YouTube pre-roll ads, and educational content that built intent are all invisible in a last-click world.
When a dashboard is built on last-click data, its predictions are skewed accordingly. It will project that bottom-of-funnel channels will continue to drive conversions and suggest scaling them. It will flag upper-funnel channels as underperforming and recommend cutting them. But if you follow that logic and cut the awareness campaigns, you'll find that the bottom-of-funnel channels that looked so strong suddenly dry up. You removed the fuel that was feeding the pipeline.
Multi-touch attribution models, whether linear, time-decay, position-based, or data-driven, distribute credit across all the touchpoints in a conversion path. This gives the dashboard a more accurate picture of which channels are genuinely contributing to outcomes. The trend lines it draws and the patterns it identifies are more representative of how your customers actually behave. Understanding the common attribution challenges in marketing analytics helps teams avoid the blind spots that distort these predictions.
Here's where it gets particularly useful for prediction: when you can compare attribution models side by side inside the same dashboard, you can stress-test your assumptions before committing budget. You can ask, "If I reallocate budget from Google to Meta, how does that look under last-click attribution versus multi-touch?" The answer might be very different depending on which model you use, and that gap tells you something important about the risk in your decision.
This kind of model comparison isn't just an analytical exercise. It's a practical risk management tool. Marketers who understand how different attribution frameworks interpret their data are much better positioned to make confident budget decisions rather than defaulting to whichever model happens to make their current strategy look best.
From Predictive Signals to Smarter Budget Decisions
Identifying a predictive signal is only half the job. The other half is knowing what to do with it. This is where AI-driven recommendations become genuinely valuable rather than just impressive-sounding.
When a dashboard has enough clean, multi-touch data flowing through it, AI marketing analytics can do more than surface trends. It can flag specific campaigns trending toward fatigue before ROAS visibly drops. It can identify audience segments that are showing early signs of high intent. It can recommend budget shifts toward channels that are currently in an accelerating performance phase, and away from those showing deceleration patterns.
The practical value of this is that it compresses the decision cycle. Instead of waiting for a campaign to clearly underperform before you act, you're getting a signal two or three days earlier. At meaningful ad spend levels, that timing difference translates directly into reduced wasted spend and improved overall efficiency.
Pipeline velocity is another predictive metric worth building into your dashboard, especially for B2B and SaaS teams. Pipeline velocity measures how quickly leads move through your funnel from first touch to closed deal. When you track this metric over time and by channel, you can start to predict not just whether a campaign will drive conversions, but roughly when those conversions are likely to close. That's valuable for revenue forecasting and for aligning marketing spend with sales capacity.
There's also a second layer of prediction that happens outside your own dashboard. When you send enriched conversion data back to ad platforms like Meta and Google, you're improving their internal prediction models too. Meta's Conversions API and Google's enhanced conversions are designed to receive server-side conversion events that the platforms' own pixels might have missed. When those platforms have better conversion data, their bidding algorithms make smarter decisions about who to show your ads to.
This creates a compounding effect. Better data in your dashboard leads to better budget decisions on your end. Better conversion signals sent to ad platforms lead to better algorithmic targeting on their end. Both loops reinforce each other, and the result is more efficient spend across the board.
What Predictive Capability Actually Looks Like Inside a Dashboard
It's worth getting concrete about what a predictive marketing analytics dashboard actually shows you, because the concept can sound abstract until you see it in practice.
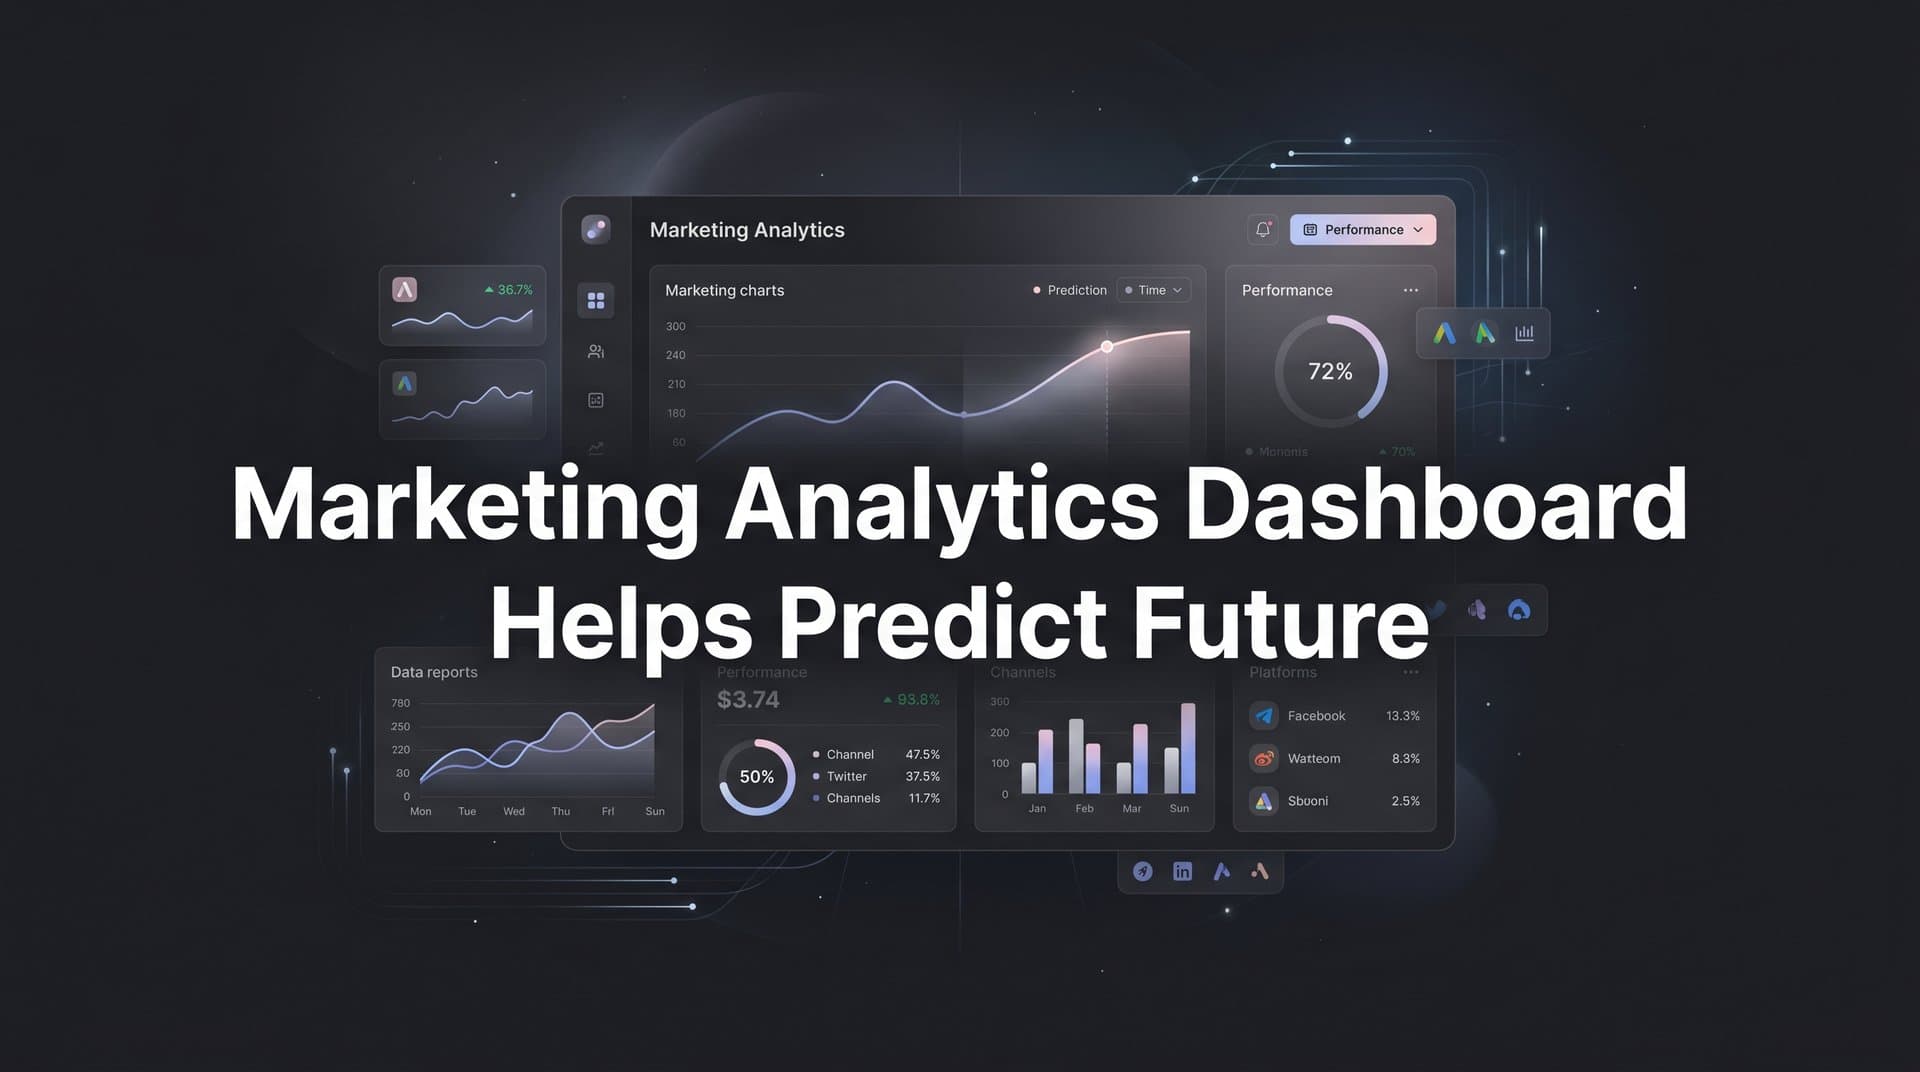
The most immediately useful feature is trend visualization alongside current performance. Rather than just showing you that your cost-per-acquisition today is a certain number, a predictive dashboard shows you whether that number is moving up or down, how fast it's changing, and whether the trajectory is consistent with patterns you've seen before. A metric at a healthy level but decelerating fast is a very different situation from the same metric at the same level but holding steady.
AI chat functionality takes this a step further. Instead of building custom reports every time you want to investigate a specific question, you can ask the dashboard directly: which campaigns are trending toward underperformance this week? Which channels are showing accelerating ROAS over the past 14 days? Which audience segments are converting at a higher rate than they were last month? Natural language queries remove the friction between having a question and getting an answer, which means marketers actually use the data more consistently.
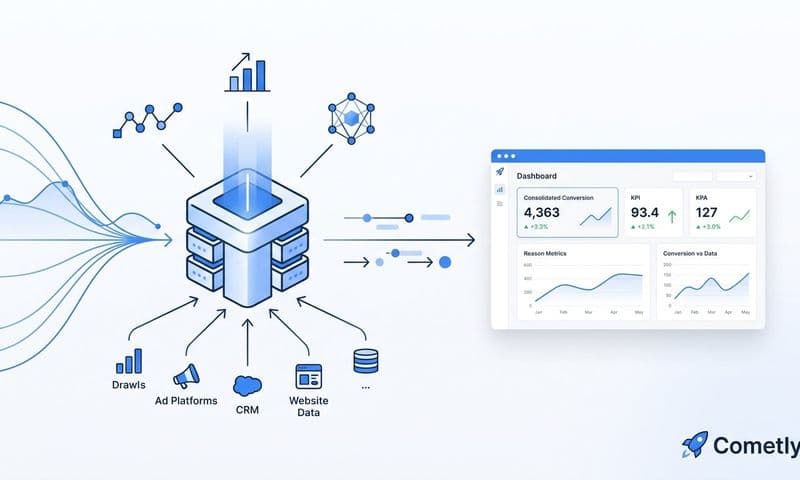
Cross-channel visibility in a single view is essential for predictive analysis to be meaningful. If you're running campaigns on Meta, Google, TikTok, and LinkedIn, the predictive signals on each platform don't exist in isolation. A trend you're seeing on Meta might be explained by something happening on Google. A budget shift on one platform has ripple effects on others. When all of that data lives in separate native dashboards, you're looking at fragments. When it's unified in one place, you can see the full picture and make predictions that account for how your channels interact.
The combination of trend lines, AI-driven flags, and cross-channel visibility is what turns a dashboard from a reporting tool into something closer to a strategic advisor. It doesn't replace your judgment, but it makes sure your judgment is informed by the full picture rather than a slice of it.
Laying the Groundwork for Reliable Predictions
None of this works without a solid data foundation underneath it. Prediction is only as reliable as the data feeding it, and many marketing teams are further from that foundation than they realize.
Start with a tracking audit. Are your server-side events firing correctly? Are your CRM integrations passing lead and deal data back to your attribution platform? Are your ad platform connections syncing conversion events in a way that reflects real customer behavior? Gaps at any of these points will distort the patterns your dashboard can identify.
Consistent conversion event naming matters more than it might seem. If the same conversion event is labeled differently across campaigns, channels, or time periods, trend analysis becomes unreliable. Standardized UTM structures across all campaigns are equally important. Without consistent tagging, your dashboard can't accurately attribute traffic and conversions to the right sources, which means its trend lines are built on shaky ground.
When it comes to which predictive marketing analytics metrics to focus on, start focused rather than trying to monitor everything at once. A short list of high-signal metrics is more actionable than a sprawling set of indicators that no one has time to interpret consistently. ROAS trends by channel, cost-per-acquisition trajectory, and lead-to-close velocity are a practical starting set for most paid advertising teams. As your data quality improves and your team builds familiarity with predictive analysis, you can expand from there.
The goal is to build a system where the data flowing in is complete enough, and consistent enough, that the patterns the dashboard surfaces are genuinely predictive rather than just noisy. That takes deliberate setup work upfront, but the payoff is a dashboard that actually helps you make better decisions before the results are already locked in.
Moving From Guesswork to Anticipation
A marketing analytics dashboard that helps predict the future isn't a luxury reserved for enterprise teams with dedicated data science departments. It's a practical capability that any data-driven marketing team can build toward, starting with the quality of data they collect and the attribution models they use to interpret it.
The progression is straightforward. Clean, complete data collected through server-side tracking and CRM integration gives you the raw material. Multi-touch attribution turns that raw material into a meaningful picture of how your customers actually move through the funnel. That picture, analyzed over time and across channels, surfaces patterns that indicate where performance is heading. AI-driven recommendations translate those patterns into specific actions: scale this campaign, pause that one, shift budget here before the window closes.
Every step in that chain makes the next one more powerful. And when you close the loop by feeding enriched conversion data back to ad platforms, you're improving not just your own predictions but the algorithmic targeting that determines who sees your ads in the first place.
Cometly is built to power exactly this kind of forward-looking marketing operation. It captures every touchpoint from ad click to CRM event, connects them into a complete customer journey, and surfaces AI-driven recommendations that tell you what to do next, not just what happened last week. With cross-channel attribution, server-side tracking, and conversion sync to Meta and Google, Cometly gives you the data quality and analytical depth that predictive marketing actually requires.
If you're ready to stop reacting and start anticipating, Get your free demo and see how Cometly can help you scale your campaigns with confidence rather than guesswork.