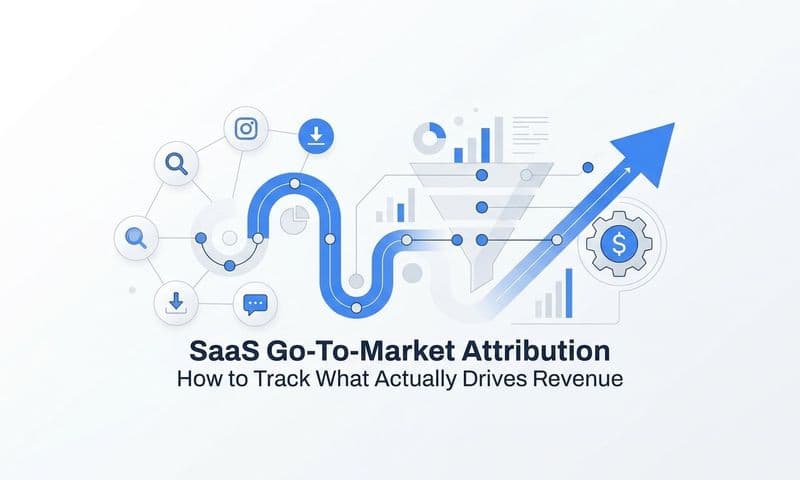
Most B2B SaaS marketing teams are running ads, generating leads, and tracking clicks. But somewhere between the first ad impression and a closed deal, conversions slip through the cracks. The problem is rarely the offer. It is usually a lack of visibility into where the funnel breaks down and why.
Optimizing marketing funnel conversions is not about guessing which stage needs work. It is about using accurate data to identify friction points, understand which channels are driving qualified pipeline, and make targeted improvements that compound over time.
This guide walks you through a proven, data-driven process to systematically optimize every stage of your B2B SaaS marketing funnel. You will learn how to audit your current funnel performance, identify the highest-impact drop-off points, align your attribution model to real revenue outcomes, and build a continuous optimization loop.
Whether you are a growth leader trying to improve CAC payback, a performance marketer looking to scale what is working, or a marketing ops professional trying to connect ad spend to pipeline, this step-by-step guide gives you a clear framework to follow.
Each step builds on the last, moving from diagnosis to execution to measurement. By the end, you will have a repeatable system for improving conversion rates at every stage of your funnel, backed by data you can trust.
Step 1: Map Your Full Funnel and Define Conversion Events
Before you can optimize anything, you need to know exactly what you are optimizing. That starts with documenting every stage of your B2B SaaS funnel, from the first ad touch all the way through to closed-won revenue.
A typical B2B SaaS funnel moves through these stages: awareness (ad impressions and organic visits), interest (landing page visits and content engagement), consideration (demo requests and form submissions), intent (MQL to SQL conversion and opportunity creation), and decision (closed-won revenue). Each stage is a distinct moment in the buyer journey, and each one needs a clearly defined conversion event.
A conversion event is a specific, measurable action that signals progress from one stage to the next. For example, a visitor becoming a lead might be defined as a form submission. A lead becoming an MQL might be defined by a lead score threshold in your CRM. An MQL becoming an SQL might be triggered when a sales rep marks the contact as qualified. Being precise here matters because vague definitions create inconsistent reporting and make it impossible to identify where conversions are actually breaking down.
Once you have defined your conversion events, audit which ones are currently being tracked and which have gaps. Many teams track top-of-funnel events well but miss critical offline events like demo completions, CRM stage changes, and contract signings. These offline events are often where the most valuable signal lives.
The next step is connecting your ad platforms, CRM, and website data into a single view. When these data sources are siloed, you end up manually stitching spreadsheets together, which introduces errors and delays. A unified view means you can see conversion rates between every funnel stage in one place, in real time.
Pitfall to avoid: Relying only on last-click attribution at this stage will misattribute credit and hide the real drivers of pipeline. Even during the mapping phase, be aware that your current tracking setup may be giving you a distorted picture.
Success indicator: You can see conversion rates between every funnel stage in one dashboard without manually stitching data together. Every stage has a defined conversion event and a tracking mechanism to capture it.
Step 2: Audit Drop-Off Rates at Each Funnel Stage
Now that your funnel is mapped and your conversion events are defined, it is time to find out where the leaks are. This is where most teams discover that their biggest problem is not where they assumed it was.
Pull conversion rate data for each stage transition: visitor to lead, lead to MQL, MQL to SQL, and SQL to closed-won. Look at these as percentages, not just raw numbers. A stage that loses a small absolute number of leads might represent a severe drop-off percentage-wise, and that distinction changes how you prioritize your efforts.
Once you have your stage-level conversion rates, segment them by channel, campaign, and audience. This is where patterns start to emerge. A paid social channel might generate impressive lead volume at a low cost per lead, but when you trace those leads through to SQL and closed-won, the conversion rates may be significantly lower than other channels. Without this segmentation, you would never know that the channel driving your most leads is also diluting your pipeline quality.
Time-to-convert is another dimension worth examining. Look at how long it takes for leads to move through each stage. If deals consistently stall at a particular transition, that is a signal worth investigating. It could indicate a nurture gap, a sales handoff problem, or a mismatch between what marketing promised and what sales delivers.
Use touchpoint analysis to compare the paths taken by leads that converted to customers versus those that went dark or churned. Often, high-converting leads followed a distinct journey that involved specific content, channels, or sequences. Identifying that pattern gives you a blueprint for replicating it.
Pitfall to avoid: Optimizing the top of the funnel when the real problem is mid-funnel qualification or the sales handoff. Many teams pour budget into generating more leads when the actual issue is that existing leads are not being converted effectively.
Success indicator: You have a ranked list of funnel stages by drop-off severity, segmented by channel and campaign. You know exactly which stage is your biggest conversion bottleneck and which channels are contributing to it.
Step 3: Choose the Right Attribution Model for Your Funnel
Attribution is one of the most debated topics in B2B SaaS marketing, and for good reason. The model you choose directly affects which channels get credit, which campaigns get budget, and ultimately which decisions get made. Getting this wrong is expensive.
There are several common attribution models to understand. First-touch assigns all credit to the first interaction a prospect had with your brand. Last-click assigns all credit to the final touchpoint before conversion. Linear distributes credit equally across all touchpoints. Time-decay gives more credit to touchpoints closer to the conversion. Data-driven attribution uses historical patterns to assign credit based on which touchpoints actually influenced outcomes.
For B2B SaaS, single-touch models like last-click are particularly problematic. They systematically overvalue bottom-funnel channels like branded search, which captures demand that was already created by earlier touchpoints, and undervalue top-funnel demand generation efforts that started the journey. If your team is making budget decisions based on last-click data, you are likely underfunding the channels that actually build pipeline.
Given that B2B sales cycles often span weeks or months and involve multiple decision-makers and touchpoints, multi-touch attribution provides a more accurate picture of what is driving pipeline. It distributes credit across the full customer journey, which better reflects the reality of how B2B buying decisions are made.
Configure your attribution model to reflect your actual sales cycle length. If your average deal takes 90 days to close, your attribution window needs to accommodate that. A 30-day window will cut off credit for many of the touchpoints that influenced the deal.
One of the most overlooked aspects of attribution is consistency. Using different models in different tools creates conflicting data. If your ad platform reports on last-click while your CRM uses first-touch and your BI tool uses linear, your team will constantly be arguing about which number is right instead of acting on insights.
Pitfall to avoid: Letting each tool default to its own attribution model. Standardize on one model and apply it consistently across all reporting.
Success indicator: Your team agrees on a single attribution model and uses it consistently across all reporting. When someone asks which channel is driving pipeline, everyone points to the same data.
Step 4: Implement Server-Side Tracking to Fix Data Gaps
Even if your funnel is mapped, your drop-off rates are audited, and your attribution model is set, your data is only as good as your tracking infrastructure. And for most teams, that infrastructure has significant gaps they are not aware of.
Browser-based pixel tracking has become increasingly unreliable. Ad blockers prevent pixels from firing. iOS privacy changes limit the data that can be collected client-side. Third-party cookie restrictions mean that returning visitors are often treated as new users. The result is that a meaningful share of conversion events simply never get reported back to your ad platforms, which distorts your performance data and weakens the machine learning models that power your ad bidding.
Server-side tracking via Conversion API (CAPI) solves this by sending first-party event data directly from your server to ad platforms like Meta and Google, bypassing the browser entirely. Because the data comes from your server rather than a user's browser, it is not affected by ad blockers or browser privacy settings.
To implement CAPI effectively, start by identifying all the conversion events you defined in Step 1 and determining which ones need server-side tracking. Demo completions, CRM stage changes, and revenue events from your payment processor are prime candidates because they happen outside the browser and cannot be captured by a standard pixel.
Configure event deduplication carefully. If both your pixel and your server-side integration fire for the same event, you will double-count conversions, which inflates your reported performance and misleads your optimization decisions. Most ad platforms support deduplication via event IDs, so make sure your implementation uses them consistently.
After setup, check your event match quality scores in Meta and Google. These scores tell you how accurately your server-side events are matching to real user profiles. Higher match quality means the ad platform can more effectively use your conversion data to optimize targeting and bidding. Low match quality often results from missing user parameters like email addresses or phone numbers in the event payload.
Pitfall to avoid: Sending low-quality event data with missing user parameters. Every parameter you can include, such as email, phone, or user agent, improves match rates and the value of the data you are sending back to the platform.
Success indicator: Your reported conversion volume increases after CAPI setup, your event match quality scores are consistently high, and offline conversion events like demo completions are flowing back to your ad platforms in near real time.
Step 5: Identify High-Performing Channels and Scale Them
With clean data and accurate attribution in place, you are now ready to make confident budget decisions. This is where the work from the previous steps pays off.
The mistake most teams make is evaluating channel performance using cost per lead. CPL is a top-of-funnel metric. It tells you how efficiently a channel generates contacts, but it says nothing about whether those contacts become customers. A channel with a low CPL but a poor SQL conversion rate can actually cost more per closed-won customer than a channel with a higher CPL but stronger downstream performance.
Instead, measure cost per SQL, cost per opportunity, and cost per closed-won customer by channel and campaign. These metrics connect your ad spend directly to revenue outcomes and give you a much clearer picture of where your budget is actually working. Learning how to evaluate marketing performance metrics at this level is what separates teams that scale efficiently from those that chase vanity numbers.
Use revenue attribution data to trace each closed deal back to the ad campaigns and channels that influenced it. This is the clearest signal you have about what is driving real business value. When you can see that a specific campaign consistently generates opportunities that close at a high rate, you have a strong case for increasing investment in it.
AI-driven analysis can accelerate this process by surfacing patterns that would take hours to find manually. By analyzing historical conversion data across channels, campaigns, ad creatives, and audiences, AI can identify which combinations are most likely to produce customers rather than just leads. This gives you a data-backed starting point for scaling decisions rather than relying on intuition.
Once you have identified your highest-performing channels by revenue impact, reallocate budget away from channels that generate volume but not pipeline quality. This reallocation is often where the most significant efficiency gains come from, and it is a core part of any strategy to optimize marketing spend across the full funnel.
Pitfall to avoid: Scaling campaigns based on CPL alone. A low CPL means nothing if those leads never convert to customers. Always evaluate channel performance using full-funnel metrics tied to revenue.
Success indicator: Your budget allocation reflects revenue attribution data, your blended CAC is trending down, and the pipeline quality metrics like SQL rate and opportunity-to-close rate are improving alongside lead volume.
Step 6: Run Targeted Experiments at Your Highest Drop-Off Stage
You have identified your biggest conversion bottleneck in Step 2. Now it is time to do something about it. The key word here is targeted. Spreading optimization effort across multiple funnel stages simultaneously is one of the fastest ways to generate inconclusive results and waste time.
Focus on the single stage with the highest drop-off rate first. Improving conversion at your biggest bottleneck will have more impact on overall funnel performance than making small improvements across several stages at once.
The right experiment depends on where the drop-off is happening. For top-of-funnel drop-off, where visitors are not converting to leads, test ad creative variations, audience targeting parameters, and landing page messaging alignment. Often the issue is a mismatch between what the ad promises and what the landing page delivers, which creates friction and erodes trust before a prospect even engages.
For mid-funnel drop-off between MQL and SQL, the problem is often in the qualification process or the follow-up experience. Test your lead qualification criteria to make sure they reflect genuine buying intent. Test follow-up speed, since research consistently shows that response time has a significant impact on lead conversion rates. Test nurture sequence content to ensure it addresses the specific objections and questions your prospects have at that stage.
For bottom-funnel drop-off, where opportunities are not closing, the levers are different. Test demo formats and lengths to find what resonates with your buyer profile. Test proposal timing and structure. Evaluate whether your sales enablement content is addressing the specific concerns that come up late in the deal cycle.
Use a structured A/B testing approach with a single variable changed per experiment. This discipline is what makes results interpretable. When you change multiple variables at once, you cannot determine which change drove the outcome, which means you cannot reliably replicate or build on it. Tracking these experiments accurately requires robust marketing campaign tracking so you can attribute results to the right variables.
Pitfall to avoid: Running too many experiments simultaneously. A focused experiment backlog with one active test per funnel stage is far more productive than running ten tests at once and being unable to draw clear conclusions from any of them.
Success indicator: Each experiment produces a clear winner with a measurable improvement in the target stage conversion rate, tracked using the same attribution model and conversion events established in earlier steps.
Step 7: Build a Continuous Optimization Loop with a Marketing Dashboard
The steps above are not a one-time project. They are the foundation of an ongoing operational discipline. The teams that consistently improve their funnel conversion rates over time are the ones that treat optimization as a recurring process, not a quarterly initiative.
Start by setting up a centralized marketing dashboard that shows funnel conversion rates, channel performance, and revenue attribution in real time. This dashboard becomes the single source of truth for your marketing team and eliminates the need for manual reporting that slows down decision-making. Every key metric, from visitor-to-lead rate through to cost per closed-won customer, should be visible in one place. A well-configured marketing funnel analytics setup makes this level of visibility achievable without custom engineering work.
Establish a weekly review cadence where the marketing team reviews funnel metrics together. The goal of this review is not to celebrate wins but to identify new drop-off patterns, flag anomalies, and prioritize the next experiment. Regular review creates accountability and keeps optimization momentum alive between major initiatives.
Set up automated alerts for significant drops in conversion rates at any funnel stage. Without alerts, a tracking issue or a sudden drop in a campaign's performance can go unnoticed for days or weeks, compounding the impact. Early detection means faster response.
Feed enriched conversion data back to your ad platforms continuously. The more high-quality conversion signals you send back to Meta, Google, and other platforms, the better their machine learning models become at finding audiences similar to your best customers. This creates a compounding effect over time: better data leads to better targeting, which leads to higher-quality leads, which generates more conversion data to feed back into the system.
Document your experiment results and learnings in a shared log. Over time, this becomes an invaluable institutional knowledge base that helps new team members get up to speed quickly and prevents the team from repeating experiments that have already been run. Teams that invest in SaaS marketing team efficiency at this operational level consistently outperform those that rely on ad hoc processes.
Pitfall to avoid: Treating funnel optimization as a one-time project. The competitive landscape, your audience's behavior, and the ad platform algorithms all change continuously. Your optimization process needs to evolve with them.
Success indicator: Your team has a documented optimization cadence, an active backlog of experiments, and conversion rates that improve quarter over quarter as a result of systematic, data-driven iteration.
Putting It All Together
Optimizing marketing funnel conversions in B2B SaaS is not a single tactic. It is a systematic process that starts with clean data, accurate attribution, and a clear picture of where your funnel is leaking.
The seven steps in this guide give you a repeatable framework: map your funnel and define conversion events, audit drop-off by stage and channel, align on the right attribution model, close data gaps with server-side tracking, scale what is actually driving revenue, run focused experiments at your highest drop-off point, and build a continuous optimization loop.
Here is a quick-start checklist to take action immediately:
Define conversion events for every funnel stage. Be specific about what counts as progress at each transition so your data is consistent and actionable.
Audit drop-off rates segmented by channel. Find out which stage is your biggest bottleneck and which channels are contributing to it.
Implement CAPI for server-side tracking. Recover lost conversion signals and improve event match quality to strengthen your ad platform data.
Choose and standardize your attribution model. Pick one model that reflects your sales cycle and apply it consistently across all reporting tools.
Identify top-performing channels by revenue, not just leads. Use cost per SQL and cost per closed-won customer to guide budget allocation decisions.
Launch one experiment at your biggest drop-off stage. Focus your optimization effort where it will have the most impact before moving to other stages.
Set up a real-time marketing dashboard for ongoing monitoring. Make funnel performance visible to the whole team and establish a weekly review cadence.
Cometly connects your ad platforms, CRM, and website into a single attribution system so you can see exactly which ads and channels are driving pipeline and revenue. With multi-touch attribution, server-side conversion tracking, Conversion API integration, and AI-powered insights, your team can move faster and spend smarter across every stage of the funnel.
Ready to stop guessing and start optimizing with data you can actually trust? Get your free demo today and see how Cometly gives you a complete picture of your marketing funnel from first click to closed-won revenue.