Most marketing teams can tell you how many clicks their ads generated last month. Far fewer can tell you which specific campaigns, channels, or touchpoints actually drove closed revenue. That gap is not a data problem. It is a tracking problem.
Revenue tracking for digital marketing connects your ad spend directly to the deals that close, giving you a clear view of what is working and what is burning budget. For B2B SaaS companies especially, where sales cycles are long and buyer journeys involve multiple touchpoints across multiple channels, this kind of visibility is the difference between scaling confidently and guessing.
Think about what typically happens without proper revenue tracking. Your Google Ads dashboard shows strong conversion numbers. Your Meta campaigns report a solid cost per lead. But when you look at actual closed revenue in your CRM, the numbers do not add up. You cannot tell which channel started the journey, which touchpoints moved prospects through the funnel, or which campaigns actually influenced the deals that closed. You are optimizing for activity, not outcomes.
This guide walks you through exactly how to build a revenue tracking system from the ground up. You will learn how to define the right conversion events, connect your data sources, choose attribution models that reflect your actual sales process, and use those insights to make smarter budget decisions. Whether you are starting from scratch or fixing a broken tracking setup, these steps will give you a reliable foundation for measuring marketing ROI with precision.
Each step builds on the last, so work through them in order. By the end, you will have a complete system that connects your first ad click to your last closed deal.
Step 1: Define Your Revenue Events and Conversion Goals
Before you touch a single tracking tool, you need to know exactly what you are measuring. This sounds obvious, but it is where most revenue tracking setups go wrong. Teams jump straight into installing pixels and configuring dashboards without first agreeing on what a "conversion" actually means for their business.
Start by identifying the specific events that represent real revenue milestones in your funnel. For most B2B SaaS companies, these include demo requests, free trial signups, marketing qualified leads, sales qualified leads, opportunities created in the CRM, and closed-won deals. Each of these is a meaningful step in the journey from stranger to paying customer.
Here is a distinction that matters: micro-conversions versus macro-conversions.
Micro-conversions are early signals of interest: ad clicks, page views, content downloads, email opens. They tell you that someone engaged with your marketing, but they do not tell you whether that engagement led to revenue.
Macro-conversions are revenue-generating actions: a prospect books a demo, a trial user upgrades to a paid plan, a deal closes in your CRM. These are the events your tracking system should ultimately be tied to.
Tracking only micro-conversions is like measuring how many people walked into your store without knowing how many actually bought something. You will optimize for foot traffic, not sales.
Once you have identified your events, map each one to a stage in your pipeline. A demo request maps to the top of funnel. An opportunity created maps to mid-funnel. A closed-won deal maps to revenue. This mapping lets you track progression from first touch to closed deal and identify where prospects are dropping off.
Before you configure anything in a tracking platform, document your events in a simple spreadsheet. Record the event name, what triggers it, the expected value (if applicable), and which pipeline stage it belongs to. This documentation becomes your source of truth and prevents inconsistent naming conventions from corrupting your data later.
One common pitfall to avoid: tracking only the final step, such as a purchase or signup, and ignoring everything that led to it. If you only fire a conversion event when a deal closes, you lose visibility into which channels and campaigns influenced the journey. Define events across the entire funnel so you can see the full picture, not just the finish line.
Step 2: Connect Your Ad Platforms, CRM, and Website
With your events defined, the next step is connecting every system that touches your customer journey. This is where most B2B SaaS companies have a structural problem: their data lives in silos that do not talk to each other.
Your ad platforms (Meta, Google, LinkedIn, TikTok) report clicks and platform-attributed conversions. Your CRM (HubSpot, Salesforce) reports leads, opportunities, and closed deals. Your billing system (Stripe, Chargebee) reports actual revenue. Each tool has a partial view of the customer journey, but none of them connects the dots from ad click to closed deal by default.
Start by listing every data source that touches your customer journey. A typical B2B SaaS stack includes at least one paid ad platform, a CRM, a website, a marketing automation tool, and a billing system. For many teams, it includes several of each.
The problem with siloed data is not just inconvenience. It creates attribution gaps that lead to bad decisions. When your ad platform reports 50 conversions but your CRM only shows 20 qualified leads and your billing system shows 5 new customers, you have no reliable way to connect those numbers. You end up trusting whichever number looks best rather than the one that is most accurate.
The solution is a single connection layer that unifies all these sources. A marketing attribution platform like Cometly sits between your ad platforms, CRM, website, and billing system, pulling data from each and linking ad spend to pipeline and revenue in one place. Instead of manually reconciling spreadsheets, you get a unified view of the entire customer journey.
One technical requirement that often gets overlooked: UTM parameters. Every paid campaign you run needs consistent UTM tagging so that when a lead fills out a form on your website, your CRM can record which ad, campaign, and channel brought them there. Without consistent UTMs, you lose source attribution the moment a prospect enters your CRM, and you cannot connect their eventual revenue back to the campaign that started their journey.
Audit your current campaigns and confirm that every ad URL includes UTM parameters for source, medium, campaign, content, and term where applicable. Then verify that your CRM is capturing and storing those UTM values on the lead record.
The success indicator for this step is straightforward: you should be able to pull up a single customer record and see the first ad they clicked, every subsequent touchpoint they had with your brand, and the revenue they generated. If you cannot do that, your data sources are not fully connected yet.
Step 3: Implement Server-Side Tracking and First-Party Data Collection
Here is a reality that has changed the tracking landscape significantly over the past few years: browser-based pixel tracking alone is no longer reliable enough to build a revenue tracking system on.
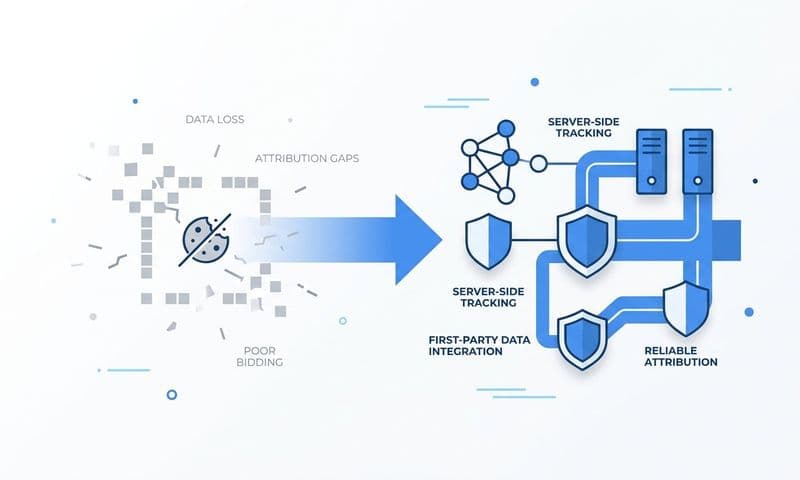
Ad blockers block pixels. Browser privacy settings restrict third-party cookies. iOS privacy updates limit the data that can be collected from mobile users. The result is that a meaningful portion of your conversions never get reported to your ad platforms, and the data that does get through is often incomplete or misattributed.
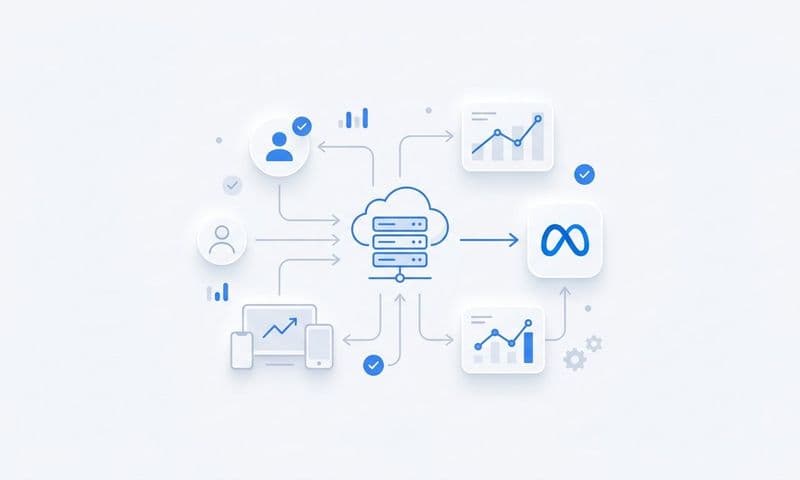
Server-side tracking solves this. Instead of relying on a browser pixel to fire when a user takes an action on your site, server-side tracking sends conversion data directly from your server to the ad platform. It bypasses the browser entirely, which means ad blockers and privacy restrictions cannot interfere with it.
The two most important implementations for B2B SaaS marketers are Meta's Conversion API (CAPI) and Google's Enhanced Conversions. Both work on the same principle: your server sends event data directly to the platform when a conversion occurs, rather than waiting for a browser pixel to fire.
Here is how to implement this practically using Cometly:
1. Install the Cometly tracking script on your website. This handles the client-side data collection layer and ensures that first-party user identifiers are captured at the point of interaction.
2. Configure server-side event firing for each of the revenue events you defined in Step 1. Map each event to the correct API endpoint for Meta and Google so that when a demo is booked or a deal closes in your CRM, that event is sent server-side to both platforms.
3. Enable first-party data enrichment. This means capturing identifiers like email address, phone number, and user ID at the point of conversion and attaching them to your server-side events. Ad platforms use this data to match your conversion events back to real users in their systems, which improves what is called your event match quality score.
A high event match quality score means your conversion data is reaching the platform accurately and being matched to the right users. A low score means data is getting lost, and your ad platform's optimization algorithms are working with incomplete information.
One critical pitfall to address here: event duplication. If you are running both a browser pixel and server-side tracking simultaneously, you risk counting the same conversion twice. This inflates your reported conversion numbers and throws off your cost per acquisition calculations. Use event deduplication parameters (typically an event ID that is the same for both the pixel and the server event) so the platform can identify and discard duplicate entries.
The success indicator for this step is a high event match quality score in your Meta Events Manager and Google Ads account. When you see that score improve, it means clean, reliable conversion data is reaching your ad platforms and their machine learning systems can start optimizing toward your actual revenue events.
Step 4: Choose and Configure Your Attribution Model
Attribution models determine how credit for a conversion is distributed across the touchpoints in a customer journey. This is one of the most consequential decisions in your revenue tracking setup, and it is also one of the most misunderstood.
There is no universally correct attribution model for B2B SaaS. The right model depends on the question you are trying to answer. Here are the core models and what each one tells you:
First-touch attribution gives 100% of the credit to the first channel or campaign a prospect interacted with. This is useful for understanding which channels are best at starting new customer journeys and generating awareness. If you want to know which channel is most effective at introducing your brand to future customers, first-touch is your lens.
Last-touch attribution gives 100% of the credit to the final touchpoint before a conversion. This tells you which channels are best at closing deals. It often overvalues retargeting and branded search because those channels tend to appear at the end of journeys that were started by other channels.
Linear attribution distributes credit equally across every touchpoint in the journey. This avoids overweighting any single channel but can undervalue the channels that do the heaviest lifting in your funnel.
Data-driven attribution uses machine learning to assign credit based on each touchpoint's actual influence on conversion outcomes. It is the most accurate model when you have enough conversion data to train it, but it requires volume to be reliable.
One configuration detail that B2B SaaS teams frequently get wrong is the attribution window. Most ad platforms default to a 7-day click window. That window is meaningless for deals that take 60 to 90 days to close. If a prospect clicks your ad in January and closes in March, a 7-day window will never connect those two events. Configure your attribution windows to match your actual average sales cycle length.
Rather than committing to a single attribution model and treating it as gospel, the more useful approach is to compare multiple models side by side. Cometly lets you view the same revenue data through different attribution lenses simultaneously, so you can see how credit shifts across channels depending on the model. This comparison is where the real insights live.
The success indicator for this step is the ability to answer two distinct questions with confidence: which channel started the most revenue-generating journeys, and which channel closed the most deals. If you can answer both, your attribution model configuration is working correctly.
Step 5: Build Your Revenue Tracking Dashboard
A dashboard is only as useful as the decisions it enables. Many marketing teams build dashboards full of metrics that feel important but do not actually inform budget or campaign decisions. The goal here is to build something that tells you where to put your money and where to pull it back.
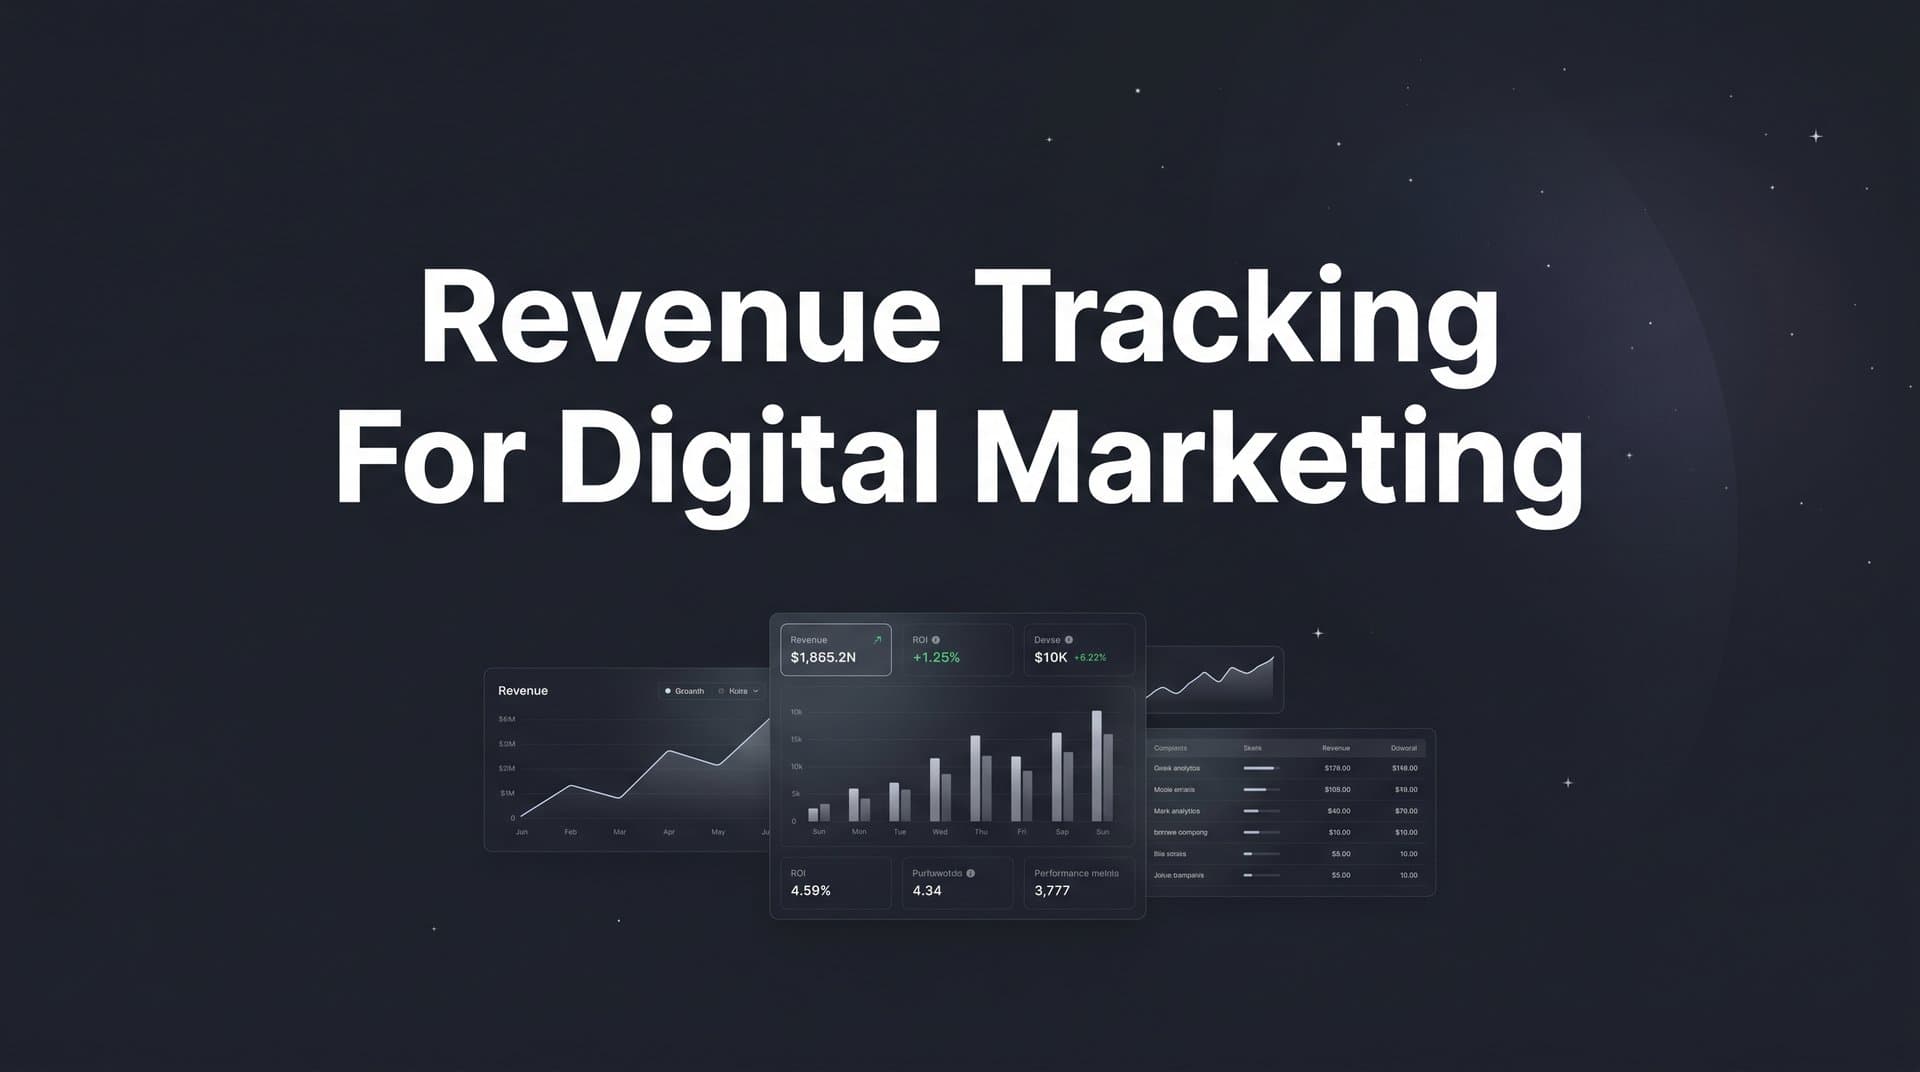
Your revenue tracking dashboard should show these core metrics at a minimum: revenue by channel, revenue by campaign, cost per acquisition by channel, pipeline value attributed to marketing, and return on ad spend based on actual closed revenue. These are the numbers that connect your marketing activity to business outcomes.
Notice what is not on that list: clicks, impressions, click-through rate, and cost per click. Those metrics belong in a campaign performance view for optimization purposes. They do not belong on a revenue dashboard because they do not tell you anything about business impact.
Cometly's pipeline and revenue attribution views are designed specifically for this purpose. By connecting your Stripe revenue data with your ad platform spend data, you can see in a single interface how much revenue each channel and campaign has generated relative to what you spent. You are not looking at platform-reported conversions. You are looking at actual closed deals and the revenue they represent.
Segment your revenue data as granularly as your decision-making requires. Channel-level data tells you which platforms are performing. Campaign-level data tells you which messages and offers are resonating. Ad creative-level data tells you which specific assets are driving the highest-value customers. The ability to drill down to the individual ad level and see its revenue contribution is a significant advantage when you are making creative and budget decisions.
Set up automated alerts for significant changes in revenue attribution. If a top-performing campaign suddenly stops generating attributed revenue, you want to know immediately, not when you happen to check the dashboard a week later. Automated monitoring removes the dependency on manual review and keeps your team responsive to changes in performance.
One common pitfall: building a dashboard with too many metrics creates noise rather than clarity. Limit your revenue dashboard to the five to seven metrics that directly inform budget and campaign decisions. Everything else can live in a secondary view for deeper analysis.
Step 6: Analyze the Customer Journey and Identify Revenue Drivers
Channel-level attribution tells you which platforms are contributing to revenue. Customer journey analysis tells you how. These are different questions, and the second one is often more actionable.
Move beyond asking "which channel drove the most revenue" and start asking "which sequences of touchpoints most often lead to high-value conversions." The answer to that question shapes your entire campaign strategy, not just your budget allocation.
Use Cometly's customer journey analytics to identify patterns in your closed-won deals. Which channel combinations appear most frequently in the journeys of your highest-value customers? Which touchpoints tend to appear just before a lead converts to an opportunity? Are there specific campaigns that consistently show up early in winning journeys, even if they rarely get last-touch credit?
This brings up an important concept: assisted conversions. An assisted conversion is when a channel or campaign contributes to a journey that eventually converts, but does not receive credit under last-touch attribution because something else happened right before the deal closed. Channels that regularly assist conversions are often undervalued and at risk of being cut when teams make budget decisions based on last-touch data alone.
Here is a practical example of why this matters. Imagine your LinkedIn campaigns rarely show up as the last touch before a deal closes. Based on last-touch attribution, they look like a poor investment. But when you look at assisted conversions, LinkedIn appears in a large portion of your highest-value customer journeys, typically near the beginning. Cutting LinkedIn based on last-touch data would be a costly mistake.
Cometly's AI-powered recommendations surface high-performing ads and campaigns across channels based on their actual contribution to revenue, not just their last-touch performance. This removes the need to manually analyze every data point and helps your team focus on the patterns that matter most.
The practical action from this step: identify your top three revenue-driving journey sequences and use them to inform your next campaign planning cycle. If you know that a specific combination of channels and touchpoints consistently produces your best customers, you build your campaigns to replicate that sequence more often.
The success indicator here is the ability to point to specific channels and campaigns that consistently appear in your highest-value customer journeys, not just your highest-volume ones. Volume and value are not the same thing, and your tracking system should help you distinguish between them.
Step 7: Use Revenue Data to Optimize Ad Spend and Scale
This is where your revenue tracking system starts paying for itself. When you have accurate attribution data connected to actual closed revenue, the budget conversation changes entirely. You stop asking which campaigns have the best click-through rate and start asking which campaigns generate the best revenue per dollar spent.
The first lever to pull is feeding your enriched conversion data back to your ad platforms. When Meta and Google receive revenue-level conversion data via their respective APIs, their machine learning algorithms can optimize ad delivery toward users who are most likely to generate actual revenue, not just users who are likely to click or fill out a form. This is a meaningful difference. Optimizing toward form fills gets you leads. Optimizing toward closed revenue gets you customers.
Cometly facilitates this by sending enriched, conversion-ready events back to Meta and Google, including the first-party identifiers that improve match rates. The result is that your ad platform's optimization engine has better data to work with, which improves targeting precision over time.
The second lever is budget reallocation based on revenue attribution. Use your attribution data to identify campaigns that are consuming budget without generating meaningful pipeline or revenue. These are not always obvious from platform-reported metrics, because ad platforms have an incentive to show their own campaigns in a favorable light. Your attribution data, anchored to actual closed revenue, gives you an objective view.
Shift budget from underperforming campaigns toward channels and creatives with proven revenue impact. This reallocation process should be ongoing, not a one-time exercise. As your data accumulates, your understanding of what drives revenue improves, and your budget decisions should reflect that.
Two metrics that belong in every scaling conversation: payback period and customer lifetime value by acquisition channel. Payback period tells you how long it takes to recover the cost of acquiring a customer from a specific channel. Lifetime value tells you how much that customer is worth over their relationship with your business. A channel with a higher cost per acquisition but a longer customer lifetime value may be a better investment than a cheaper channel that acquires lower-value customers.
Finally, use your first-party data to build lookalike audiences and retargeting segments based on your highest-revenue customer profiles. The customers who have generated the most value for your business share characteristics that your ad platforms can use to find similar prospects. When your lookalike audiences are built from revenue-qualified customer data rather than generic lead lists, their quality improves significantly.
The success indicator for this step is clear: your ad platform optimization is driven by closed revenue data, and your budget decisions are backed by attribution data rather than platform-reported conversions. When those two things are true, you are no longer guessing. You are scaling with evidence.
Putting It All Together
Revenue tracking for digital marketing is not a one-time setup. It is a system you build, refine, and use continuously to make smarter decisions. Here is a quick checklist to confirm your system is working:
Revenue events defined: Your conversion events are documented, mapped to pipeline stages, and consistently named across all tools.
Data sources connected: Your ad platforms, CRM, website, and billing system are unified through a single attribution layer with no manual reconciliation required.
Server-side tracking active: Conversion API and Enhanced Conversions are configured, event deduplication is in place, and your event match quality scores are high.
Attribution model configured: Your attribution windows match your actual sales cycle, and you are comparing multiple models rather than relying on a single view.
Revenue dashboard live: Your dashboard shows revenue by channel and campaign, cost per acquisition, pipeline value, and ROAS based on actual closed revenue.
Journey analysis complete: You have identified your top revenue-driving customer journey sequences and are using them to guide campaign planning.
Ad platforms receiving enriched data: Your Meta and Google campaigns are optimizing toward real revenue events, not just clicks or form fills.
When all of these pieces are in place, you stop guessing and start scaling with confidence. Cometly is built specifically for B2B SaaS teams who need this level of clarity, connecting your ad spend, CRM, and revenue data into one accurate, real-time view. If your current setup leaves gaps between your ad data and your actual revenue, it is worth seeing what full-funnel attribution looks like in practice. Get your free demo today and start capturing every touchpoint to maximize your conversions.