
Running Amazon ads without accurate performance tracking is like driving with your eyes closed. You might be spending thousands on Sponsored Products, Sponsored Brands, and Sponsored Display campaigns, but if you cannot connect that spend to actual revenue and customer behavior, you are flying blind.
The challenge gets even harder when Amazon is just one channel in a broader paid media strategy that includes Meta, Google, TikTok, and more. How do you know which platform truly drives your conversions? How do you compare Amazon ad performance against your other channels?
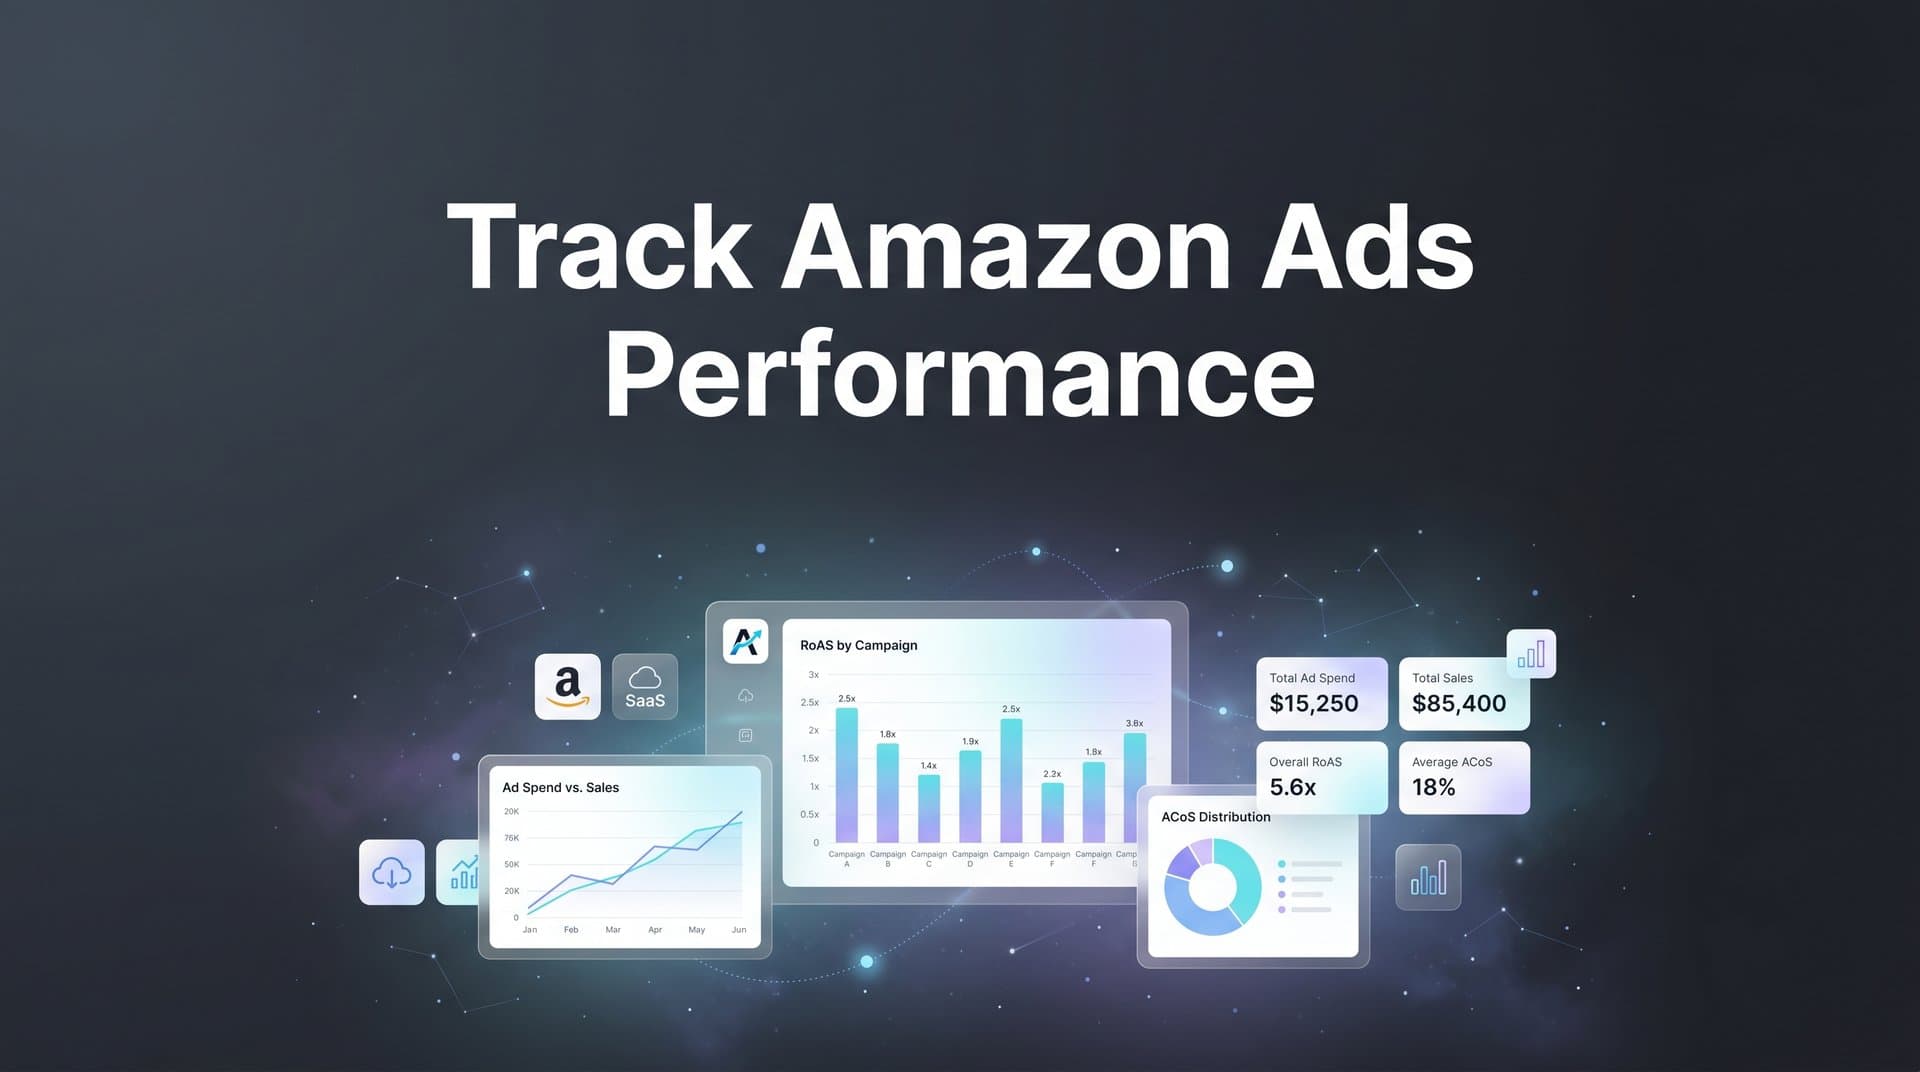
This guide walks you through exactly how to track Amazon ads performance, from initial setup inside Amazon's own console to building a unified, cross-platform view that reveals your true return on ad spend. Whether you are managing campaigns for an ecommerce brand or an agency handling multiple client accounts, these steps will help you move from guesswork to clarity.
By the end, you will have a repeatable system for monitoring the metrics that matter, identifying what is working, and making confident budget decisions across every channel.
Step 1: Define Your KPIs Before You Touch a Dashboard
Before you open a single report or pull any campaign data, you need to know what success actually looks like for your business. This sounds obvious, but it is the step most marketers skip, and it is the reason so many teams end up drowning in data without any clear direction.
The core metrics you need to understand when tracking Amazon ads performance fall into two categories: revenue-driving metrics and diagnostic metrics.
Revenue-Driving Metrics: These are the numbers that connect directly to your bottom line and should anchor every performance review.
ACoS (Advertising Cost of Sales): Calculated as ad spend divided by ad revenue, ACoS tells you what percentage of your Amazon-attributed revenue went back into advertising. A lower ACoS means more efficient spending, but the right target depends heavily on your margins.
TACoS (Total Advertising Cost of Sales): This is ad spend divided by total revenue, including organic sales. TACoS gives you a fuller picture of how advertising impacts your overall business health, not just the revenue directly attributed to ads.
ROAS (Return on Ad Spend): The inverse of ACoS expressed as a multiplier. If you spend $1,000 and generate $5,000 in attributed revenue, your ROAS is 5x. Use this metric to compare efficiency across campaigns and channels.
Cost Per Acquisition (CPA): How much you spend to acquire one customer or conversion. This is essential for understanding profitability at scale.
Diagnostic Metrics: Click-through rate (CTR) and conversion rate are not revenue metrics on their own, but they help you diagnose why your revenue metrics look the way they do. A high CTR with a low conversion rate signals a landing page or listing problem. A low CTR suggests your creative or targeting needs work. Understanding these digital marketing performance metrics is critical for diagnosing campaign health.
Impressions and raw clicks are vanity metrics in this context. They feel good to report, but they do not tell you whether your campaigns are profitable.
Once you have identified the metrics that matter, set benchmark targets before you start pulling data. What ACoS is acceptable given your product margins? What ROAS do you need to justify scaling a campaign? Having these numbers documented in advance prevents the trap of rationalizing underperformance after the fact.
Document your KPIs in a shared spreadsheet so your entire team evaluates performance using the same criteria. A well-structured marketing campaign tracking spreadsheet ensures everyone is working from the same success definition, making your review conversations much more productive.
Step 2: Configure Amazon Advertising Console and Campaign Structure
With your KPIs defined, the next step is making sure your Amazon Advertising Console is set up in a way that actually supports clean reporting. Sloppy account structure is one of the most common reasons marketers struggle to track Amazon ads performance accurately.
Start by logging into advertising.amazon.com and confirming your account settings: billing is current, permissions are assigned correctly for any team members who need access, and your account is linked to the correct seller or vendor account. These basics are easy to overlook and can cause data gaps that are frustrating to diagnose later.
Next, audit your campaign structure. Amazon offers three primary ad types, and each serves a distinct purpose:
Sponsored Products: Keyword-targeted ads that appear in search results and on product detail pages. These are your workhorses for direct-response performance and typically drive the most attributable revenue.
Sponsored Brands: Banner-style ads that feature your brand logo, a custom headline, and multiple products. These are better suited for brand awareness and driving traffic to your store or a curated product collection.
Sponsored Display: Audience and product-targeting display ads that can appear both on and off Amazon. These are useful for retargeting and reaching customers who viewed your products but did not purchase.
Organize your campaigns so that each type, targeting method, and product category has its own campaign. This separation makes it far easier to pull meaningful reports later. If everything is lumped into one campaign, you cannot isolate what is actually working.
Naming conventions matter more than most people realize. A consistent taxonomy like [Brand]_[AdType]_[Product/Category]_[TargetingType]_[Date] makes filtering and analysis dramatically faster, especially when you are managing dozens of campaigns. Using a reliable marketing campaign tracker can help enforce these conventions and keep your reporting clean at scale.
If you are driving external traffic to your Amazon listings from channels like Meta, Google, or email, enable Amazon Attribution. This tool allows you to create tracking tags for off-Amazon traffic sources so you can measure how those external clicks influence Amazon sales. It is available through the Amazon Advertising Console and unlocks a layer of cross-channel visibility that is otherwise invisible inside the platform.
Step 3: Pull and Interpret Amazon's Native Reports
Amazon's Advertising Console includes several built-in report types that give you detailed visibility into campaign performance. Knowing which reports to pull, and how to read them, is essential for making sense of your data.
Here are the four reports you should be working with regularly:
Search Term Report: This is your most actionable report. It shows exactly which customer search queries triggered your ads and how each term performed in terms of clicks, spend, and attributed sales. Use this to identify high-converting terms to add as exact-match keywords and wasteful terms to add as negatives.
Placement Report: This report breaks down performance by placement type: top of search, rest of search, and product pages. You will often find significant performance differences between placements, which informs your bid modifier strategy.
Advertised Product Report: Shows performance data at the individual ASIN level. This is useful for identifying which specific products are driving returns and which are consuming budget without converting.
Campaign Performance Report: A high-level view of performance across all your campaigns. Use this for weekly reviews and to spot budget pacing issues or sudden performance shifts.
To pull these reports, navigate to the Reports section inside Amazon Advertising Console, select the report type, choose your date range, and select the columns you need. For most tactical analysis, a 14-day or 30-day rolling window gives you enough data to spot trends without being overwhelmed by noise. Learning how to evaluate marketing performance metrics across different time windows will sharpen your ability to distinguish real trends from noise.
You can schedule automated report downloads so the data arrives in your inbox on a regular cadence. This removes the manual step and ensures you are always working with fresh information.
When reading the data, connect the dots between search term performance and your ACoS targets. A keyword with high spend and low attributed sales is a clear candidate for bid reduction or negation. A keyword with strong conversion rates but low impression share may benefit from a bid increase.
Here is the key limitation to keep in mind: Amazon's native reports only show activity within Amazon's ecosystem. They cannot tell you how your Amazon ads interact with your other marketing channels. A customer who clicked a Google Shopping ad before purchasing on Amazon will appear as an organic sale in Amazon's reports, even though your Google ad played a role. This is where your tracking strategy needs to expand beyond Amazon's walls.
Step 4: Connect Amazon Ads Data to Your Full Marketing Stack
This is the step where most ecommerce marketers hit a wall. You have clean Amazon data in one dashboard, Meta data in another, Google data in a third, and no reliable way to compare them. Each platform uses different attribution windows, different conversion definitions, and different methodologies. The result is conflicting numbers that make budget decisions feel like guesswork.
The core problem is Amazon's walled garden approach. Its conversion data does not natively integrate with other ad platforms. When you look at your Amazon ROAS and your Meta ROAS side by side from their respective native dashboards, you are not comparing apples to apples. You are comparing two different platforms' self-reported versions of reality, each with a natural incentive to claim as much credit as possible. This is a common challenge with ads reporting discrepancies across platforms.
To actually track Amazon ads performance in the context of your full marketing strategy, you need a centralized attribution platform that sits above all your channels and builds a unified view of the customer journey.
This is exactly what Cometly is built for. By connecting your ad platforms, CRM data, and website events in one place, Cometly lets you see every channel side by side in real time. You can compare Amazon's true contribution to revenue against Meta, Google, TikTok, and any other channel you are running, using consistent attribution logic across all of them.
Consider what this reveals in practice. A customer might click a Google search ad, browse your Amazon listing, see a Meta retargeting ad three days later, and then convert through Amazon. If you are only looking at Amazon's native reports, Amazon gets full credit for that conversion. If you are only looking at Meta's reports, Meta claims it too. Without cross-platform tracking, you are double-counting revenue and making budget decisions based on inflated, siloed numbers.
Multi-touch attribution solves this by distributing credit across every touchpoint in the customer journey. Cometly's multi-touch attribution captures every interaction from the first ad click to the final conversion, giving you an accurate picture of which channels assist conversions versus which ones close them. Choosing the right software for tracking marketing attribution is critical to making this work reliably across all your channels.
Setting up this integration typically involves connecting your Amazon Advertising account, your other ad platforms, and your website tracking to the attribution platform. Cometly's server-side tracking adds another layer of accuracy here, capturing conversion data that browser-based tracking misses due to iOS privacy changes, ad blockers, and cookie restrictions. With more complete data flowing into the system, your attribution models become significantly more reliable.
Step 5: Analyze Cross-Channel Performance and Spot Revenue Drivers
Once your data is unified in a single dashboard, the real analysis begins. This is where tracking Amazon ads performance transforms from a reporting exercise into a strategic advantage.
Start by comparing true ROAS, CPA, and revenue contribution across all your channels using consistent attribution logic. You will likely see a very different story than what each platform's native dashboard told you. Some channels that looked strong in isolation will appear less efficient when measured against a unified standard. Others that seemed like underperformers may reveal themselves as critical contributors to the customer journey.
Attribution models are the lens through which you interpret this data, and choosing the right model for the right question matters:
Last-Touch Attribution: Gives 100% of the credit to the final touchpoint before conversion. Amazon defaults to this model within its own ecosystem, which is why Amazon's self-reported numbers often look impressive. It is useful for understanding what closes deals, but it undervalues the channels that created awareness and intent earlier in the journey.
First-Touch Attribution: Gives full credit to the first interaction. This helps you understand which channels are best at generating new demand and introducing customers to your brand.
Linear Attribution: Distributes credit equally across all touchpoints. This is a more balanced view that acknowledges every interaction in the journey without making assumptions about which one mattered most.
Data-Driven Attribution: Uses algorithmic modeling to assign credit based on how different touchpoints actually influence conversion probability. This is the most sophisticated approach and tends to produce the most accurate picture when you have sufficient data volume. Leveraging the right marketing attribution platforms ensures your data-driven models are built on complete, accurate information.
Here is a practical example of what this analysis can reveal. If Amazon Sponsored Products consistently shows up as a last-touch channel with strong attributed ROAS, but rarely appears in first-touch data, that tells you something important: Amazon is a closer, not a discoverer. Customers are finding your brand through other channels and then converting on Amazon. This means cutting your Google or Meta spend to fund more Amazon ads could actually hurt total revenue, because you would be removing the channels that create the demand Amazon is capturing.
This is the kind of insight that is completely invisible when you look at each platform in isolation. Cometly's AI-powered recommendations take this analysis further by surfacing high-performing campaigns across all your channels and suggesting where to shift budget for maximum impact. Understanding how to improve campaign performance with analytics at this cross-channel level is what separates good marketers from great ones.
Step 6: Optimize Campaigns Based on Accurate Data
Tracking is only valuable if it leads to action. Once you have clean, unified data flowing through your attribution system, the next step is using those insights to make specific, confident optimizations.
Inside Amazon Advertising Console, your tracking data should drive four types of tactical decisions:
Keyword Management: Use your Search Term Report data to pause or reduce bids on high-spend, low-conversion terms. Promote high-converting search queries to exact-match keywords so you can control bids more precisely. Add irrelevant terms as negatives to stop budget waste.
Budget Reallocation: Shift daily budget from campaigns with poor ROAS to campaigns that consistently hit or exceed your target. Use your Campaign Performance Report to identify which campaigns deserve more fuel and which ones are draining resources.
Bid Adjustments by Placement: If your Placement Report shows that top-of-search placements convert significantly better than product page placements, increase your bid modifier for top-of-search to capture more of that high-intent traffic.
Cross-Channel Budget Shifts: This is where your unified attribution data from Cometly becomes especially powerful. If your analysis reveals that Meta is driving strong first-touch awareness that feeds Amazon conversions, reallocating budget away from Meta to save money could undermine your Amazon performance. Accurate cross-channel data lets you make these decisions with confidence rather than guesswork.
One of the most impactful optimizations you can make is feeding enriched conversion data back to your ad platforms. When you send accurate, server-side conversion events back to Meta and Google, their algorithms get better signals for targeting and bidding. Reliable ad tracking tools can help you scale ads by ensuring these algorithms receive the cleanest possible data. This means their automated bidding strategies work more effectively, which improves performance without requiring manual intervention. Cometly's Conversion Sync feature handles this automatically, sending enriched data back to each platform so their AI can optimize more intelligently.
On review cadence: run weekly reviews focused on tactical adjustments like keyword bids, negative additions, and budget pacing. Run monthly reviews for strategic decisions like campaign structure changes, budget allocation across channels, and creative testing priorities. The key rule is to avoid optimizing based on a single day of data. Look for consistent trends over seven to fourteen day windows before making significant changes. Short-term noise can look like a signal when you are watching data too closely.
Your Tracking System, Summarized
Here is a quick-reference checklist you can use to confirm your Amazon ads tracking setup is complete and working:
KPIs Defined: ACoS, TACoS, ROAS, CPA, CTR, and conversion rate targets are documented and shared with your team.
Account Configured: Amazon Advertising Console is set up with correct billing, permissions, and campaign naming conventions.
Amazon Attribution Enabled: If you are running external traffic to Amazon listings, Attribution tags are in place for each off-Amazon channel.
Reports Scheduled: Search Term, Placement, Advertised Product, and Campaign Performance reports are set to deliver on a regular cadence.
Cross-Platform Integration Active: Amazon ad data is connected to a centralized attribution platform alongside your other channels.
Multi-Touch Attribution Configured: You are analyzing performance through multiple attribution models to understand both discovery and conversion channels.
Conversion Sync Running: Enriched conversion data is flowing back to ad platforms to improve algorithm performance.
Review Cadence Established: Weekly tactical reviews and monthly strategic reviews are on the calendar.
Tracking Amazon ads performance accurately is not just about knowing your ACoS. It is about understanding how Amazon fits into your entire marketing ecosystem and using that understanding to make smarter decisions with every dollar you spend.
If you are ready to stop making budget decisions based on siloed, conflicting platform data and start seeing your full customer journey in one place, Cometly gives you the attribution clarity to do exactly that. Get your free demo today and start capturing every touchpoint to maximize your conversions.


