
Most marketers know their cost per acquisition. Fewer know which channels bring in customers who stick around, buy again, and generate the most long-term revenue. That gap between acquisition cost and lifetime value is exactly where budgets get wasted and growth stalls.
Think about it this way: two channels might both deliver leads at the same CPA. But if one channel's customers churn after 60 days while the other channel's customers stick around for two years and buy multiple times, those two channels are not equal by any measure that matters. Yet most marketing teams treat them as if they are.
Tracking customer lifetime value by channel changes the entire way you evaluate performance. Instead of chasing the cheapest leads, you start investing in the channels that produce your most valuable customers over time. It shifts your optimization from "what's the lowest CPA?" to "which channel generates the highest long-term return?"
This guide walks you through the exact steps to set up channel-level CLV tracking, from defining your CLV formula to connecting your data sources and building dashboards that surface actionable insights. Whether you are running paid ads across Meta, Google, TikTok, or LinkedIn, or driving traffic through SEO, referrals, and organic social, you will learn how to tie long-term revenue back to the specific sources that drove it.
By the end, you will have a repeatable system for measuring which channels deserve more budget and which ones look good on the surface but consistently underdeliver when you factor in what customers actually spend over time. Let's get into it.
Step 1: Define Your CLV Formula and Measurement Window
Before you can track customer lifetime value by channel, you need a consistent definition of what CLV actually means for your business. This sounds obvious, but it is the step most teams skip, and it creates confusion down the line when different stakeholders are working from different numbers.
The core CLV formula for transactional businesses is straightforward:
CLV = Average Order Value x Purchase Frequency x Average Customer Lifespan
For subscription businesses, the calculation shifts slightly:
CLV = Average Monthly Revenue Per Customer x Average Customer Lifespan in Months
Both formulas give you a revenue-based CLV. But here is a common pitfall worth flagging early: if you use revenue instead of profit-based CLV, your channel comparisons can mislead you significantly. A channel that drives high-revenue customers with thin margins may actually be less valuable than a channel that drives slightly lower-revenue customers with strong margins. Wherever possible, factor in gross margin to get a truer picture of channel-level profitability.
Next, choose your measurement window. This depends on your sales cycle and business model. Common options include:
90-day CLV: Best for businesses with short purchase cycles and high transaction frequency, such as e-commerce. It gives you fast feedback but may miss the full picture for customers who take time to warm up.
6-month CLV: A solid middle ground for most SaaS and mid-market businesses. Long enough to capture meaningful repeat behavior, short enough to inform near-term decisions.
12-month CLV: Better for businesses with longer sales cycles or subscription models where annual renewals are a key revenue event. This window is often used as a standard for channel comparisons.
Projected CLV: Uses historical cohort data to model expected lifetime value beyond the observation window. Useful for strategic planning but requires more data maturity to be reliable.
The specific window you choose matters less than choosing one and sticking with it consistently across all channels. When you compare CLV from Meta campaigns against CLV from organic search, both need to be measured over the same timeframe or the comparison is meaningless. Understanding value per conversion at the channel level is the foundation of this entire process.
Finally, align on this definition across your marketing, sales, and finance teams before you move forward. CLV-by-channel data only drives better decisions when everyone is interpreting it the same way.
Step 2: Map Every Channel and Touchpoint in the Customer Journey
You cannot track what you have not mapped. Before you connect any data sources, build a complete inventory of every channel that could touch a customer before they convert, and at every point after.
Start with your paid channels: Meta Ads, Google Ads, TikTok Ads, LinkedIn Ads, YouTube, programmatic display, and any other platforms where you are actively spending. Then document your organic channels: SEO traffic, organic social, email, referral programs, and direct traffic. If you have offline touchpoints like events, outbound sales calls, or direct mail, those belong in the inventory too.
Once you have the full list, audit your tracking setup for each channel. Every paid channel should have:
Consistent UTM parameters: Every ad URL should carry UTM source, medium, campaign, content, and term parameters. This is how your analytics tools and CRM identify which channel drove a session. Inconsistent UTM naming conventions are one of the most common reasons CLV-by-channel data becomes unreliable. Following UTM parameter tracking best practices is essential for clean data.
Properly configured tracking pixels: Platform pixels (Meta Pixel, Google tag) should fire on key conversion events. But here is the challenge: browser-based pixel tracking has become increasingly unreliable. iOS privacy changes, ad blockers, and cross-device journeys all create gaps in the data. A customer might click your Meta ad on their phone, browse on their laptop, and convert on a desktop. Browser-based tracking often misses that connection entirely.
Server-side tracking: This is where modern tracking infrastructure becomes critical. Server-side tracking sends event data directly from your server to ad platforms and analytics tools, bypassing browser restrictions. It captures conversions that pixel-based tracking misses and significantly improves data accuracy. For CLV-by-channel analysis, where you need to connect a customer's acquisition source to revenue events that happen months later, understanding server-side tracking vs pixel tracking is not optional. It is foundational.
Cometly's server-side tracking is built specifically to address these gaps. It captures the full customer journey from first click through downstream revenue events, ensuring your channel-level data reflects reality rather than a partial picture distorted by tracking limitations.
The goal of this step is simple: when a customer converts today and makes another purchase six months from now, you want to know with confidence which channel originally brought them in. That requires airtight tracking from day one.
Step 3: Connect Your Ad Platforms, CRM, and Revenue Data
Siloed data is the single biggest barrier to tracking customer lifetime value by channel. Your ad platforms know who clicked your ads. Your CRM knows who became a customer and how they engaged over time. Your billing or e-commerce system knows what they spent. The problem is these systems rarely talk to each other by default, and that disconnection makes channel-level CLV tracking nearly impossible.
Here is what needs to happen: every lead or customer that enters your CRM needs to carry their original acquisition channel source with them, permanently. When a prospect clicks a Google ad, fills out a form, becomes a customer, buys again six months later, and upgrades their plan a year after that, every one of those revenue events should be traceable back to that original Google Ads touchpoint.
To make this work, you need to pass channel data through your entire funnel:
From ad click to form fill: UTM parameters captured in a hidden form field or via your tracking setup should populate directly into your CRM as a lead source field. This is the handoff point where most teams lose the data.
From lead to customer: When a lead converts to a paying customer, the original channel source should carry forward in the CRM record. Do not let this get overwritten by the last-touch source at the point of sale.
From customer to lifetime revenue: Every downstream event, including repeat purchases, upsells, renewals, and refunds, should be tied back to the original acquisition channel. Effective revenue tracking across marketing channels is what makes CLV-by-channel analysis possible. Without it, you can only measure first-purchase revenue by channel, which is a much weaker signal.
This is exactly the problem Cometly is built to solve. Cometly connects your ad platforms, CRM, and website data into a unified view of the customer journey in real time. Instead of manually trying to stitch together data from five different systems, you get a single source of truth that shows which channels are driving not just initial conversions, but long-term revenue. Every touchpoint from ad click to downstream purchase is captured and connected, giving you the foundation you need for accurate channel-level CLV analysis.
Step 4: Choose the Right Attribution Model for Lifetime Value
Attribution models determine how credit gets distributed across the channels and touchpoints that influenced a customer's journey. For CLV-by-channel analysis, the model you choose has a significant impact on which channels appear most valuable. Getting this right is important.
Here is a quick overview of the main models and how they affect CLV calculations:
First-touch attribution: Gives 100% of the credit to the first channel that introduced the customer. For CLV analysis, this is often the most useful model because it directly answers the question: which channel originally brought in my highest-value customers? If you want to understand which acquisition sources produce customers who stick around and spend more over time, first-touch is your starting point.
Last-touch attribution: Gives 100% of the credit to the final channel before conversion. This is the default in many analytics tools and the most commonly used model, but it is also the most misleading for CLV purposes. It tends to over-credit retargeting and branded search, which are rarely the channels that introduced the customer in the first place.
Linear attribution: Distributes credit equally across all touchpoints. This gives you a more balanced view but can dilute the signal from channels that genuinely drove the introduction or the conversion decision.
Time-decay attribution: Gives more credit to touchpoints closer to the conversion event. Useful for understanding which channels close deals, but less useful for understanding which channels source your best customers.
Position-based attribution: Splits credit between first and last touch, with the remaining credit distributed across middle touchpoints. A solid compromise for teams that want to honor both the introduction and the close.
For most CLV-by-channel analyses, start with first-touch attribution to understand which channels are sourcing your highest-value customers. Then layer in multi-touch attribution to understand which channels assist in converting those high-CLV customers even when they did not originate the journey. Properly tracking customers across multiple touchpoints ensures your attribution data is complete and reliable.
The key is being able to compare models side by side rather than committing to just one. Cometly lets you toggle between attribution models so you can see how channel-level CLV shifts depending on how you distribute credit. That flexibility prevents you from over-crediting or under-crediting specific channels based on a single model's limitations.
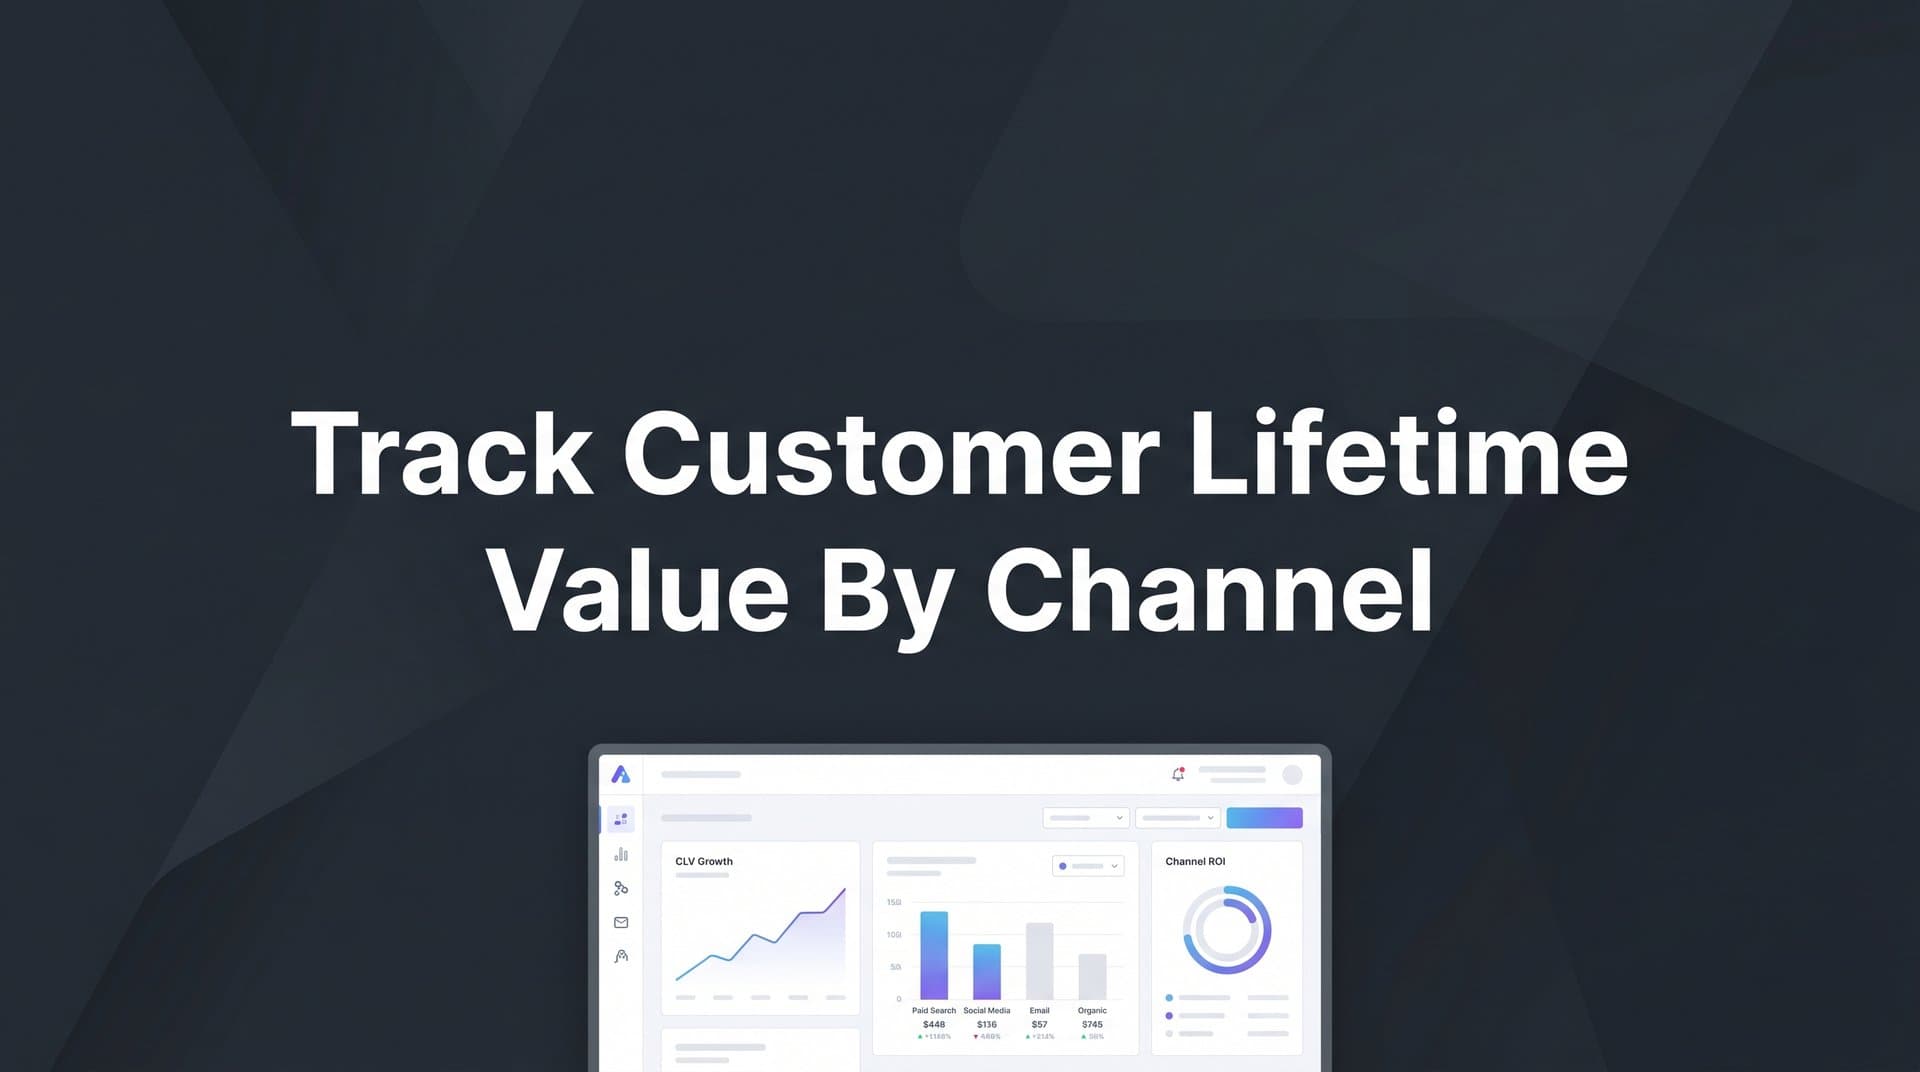
Step 5: Build Your CLV-by-Channel Dashboard and Segment the Data
With your data connected and your attribution model chosen, it is time to build the dashboard that will drive your budget decisions. A CLV-by-channel dashboard is not just a reporting exercise. It is the operational tool you will return to every month to evaluate performance and identify where to shift spend.
The core metrics your dashboard should surface include:
CLV by channel: The headline metric. Which channels produce customers with the highest average lifetime value over your chosen measurement window?
CLV-to-CAC ratio by channel: This is arguably the most important metric in your entire dashboard. Divide the average CLV from each channel by the cost to acquire a customer from that channel. A ratio of 3:1 or higher is a commonly cited benchmark, though this varies by industry and business model. Channels with strong CLV-to-CAC ratios deserve more investment. Channels with weak ratios need either optimization or reallocation. Learning to track SaaS customer acquisition cost alongside CLV is critical for getting this ratio right.
Retention rate by channel: What percentage of customers from each channel are still active at 30, 60, 90, and 180 days? Retention rate is an early signal of CLV before the full measurement window has elapsed. Channels with higher retention rates are producing more engaged, valuable customers.
Revenue cohort curves by channel: This is where cohort analysis becomes essential. Group customers by the channel that acquired them and the time period when they were acquired. Then track cumulative revenue from each cohort over time. This visualization shows you not just what CLV is today, but how it is developing. Some channels produce customers who spend heavily upfront and then churn. Others produce slow starters who become your most loyal buyers over time.
Do not stop at channel-level data. Segment further by campaign, ad set, creative, and audience. You will often find that CLV varies significantly within a single channel depending on which campaign or creative drove the acquisition. A broad awareness campaign on Meta might produce lower-CLV customers compared to a specific interest-targeted campaign on the same platform.
Cometly's analytics dashboard is built for exactly this kind of analysis. It visualizes which channels and campaigns are driving the highest long-term revenue, not just initial conversions, so you can make budget decisions based on what actually matters.
Step 6: Reallocate Budget and Feed Better Data Back to Ad Platforms
All of the tracking and analysis you have done leads to this: making smarter budget decisions and improving the quality of data that flows back into your ad platforms. This is where CLV-by-channel tracking pays off in real, measurable ways.
Start with budget reallocation. Use your CLV-to-CAC ratio by channel as the primary guide. If your Google Search campaigns are delivering a CLV-to-CAC ratio of 4:1 while your TikTok campaigns are delivering 1.5:1, that is a clear signal to shift spend toward Google, even if TikTok has a lower CPA on a surface level. The channel with the cheapest acquisition cost is not always the channel worth scaling. Knowing which marketing channel drives revenue over the long term is what separates good marketers from great ones.
Look for opportunities within channels too. If a specific campaign, audience segment, or creative consistently acquires higher-CLV customers, prioritize it. Pause or reduce spend on campaigns that attract high volumes of low-CLV customers, even if they look efficient by traditional metrics.
The second part of this step is equally important: feeding enriched conversion data back to your ad platforms. Meta, Google, and other platforms rely on conversion signals to optimize their targeting algorithms. When you only send them basic conversion events like "lead submitted" or "purchase completed," their AI optimizes for volume. When you send them enriched events that include downstream revenue data, repeat purchases, and customer value signals, their algorithms learn to target higher-quality prospects. Understanding how to track ad performance across channels ensures you are feeding the right signals back into each platform.
This is what Cometly's Conversion Sync does. It sends enriched, conversion-ready events back to Meta, Google, and other ad platforms, giving their optimization algorithms the data they need to find more customers who look like your highest-CLV segments. The result is better targeting, improved ad ROI, and a compounding improvement in the quality of customers your campaigns attract over time.
Finally, set a regular review cadence. CLV data matures over time, which means your channel rankings will shift as you accumulate more data. A monthly or quarterly review of your CLV-by-channel dashboard keeps your budget allocation aligned with the most current picture of channel performance. Build this review into your standard reporting rhythm so it becomes a habit rather than an occasional project.
Putting It All Together
Tracking customer lifetime value by channel is not a one-time project. It is an ongoing practice that gets more powerful as your data matures and your measurement window extends. The more historical data you accumulate, the more confident your channel comparisons become and the sharper your budget decisions get.
To recap the key steps: define a consistent CLV formula and measurement window, map all your channels and touchpoints with proper tracking in place, connect your ad platforms and CRM into a unified data layer, choose the right attribution model for your analysis goals, build dashboards that surface CLV-by-channel insights at the channel and campaign level, and use those insights to reallocate budget and feed better conversion data back to ad platforms.
The marketers who win long-term are the ones who stop optimizing for the cheapest click and start optimizing for the most valuable customer. That shift in perspective requires the right infrastructure, the right data, and the right tools to connect it all.
With a platform like Cometly connecting your ad platforms, CRM, and website data across the entire customer journey, you get a real-time, unified view of which channels are truly driving your most profitable customers. You can compare attribution models, analyze cohort performance, and feed enriched data back to ad platforms, all from one place.
Start with Step 1 today. Define your CLV formula, align your team on the measurement window, and begin building the foundation. Within a few weeks, you will have a clear picture of which channels deserve more budget and which ones have been quietly underperforming all along. Ready to get there faster? Get your free demo and see how Cometly helps you capture every touchpoint and optimize for the customers who matter most.


