Most marketing teams are making budget decisions based on incomplete data. They can see clicks from a Google ad or impressions on a Facebook campaign, but the full picture of how a customer moves from first touch to final purchase remains fragmented across platforms, spreadsheets, and disconnected dashboards.
When you cannot track the full customer journey, you end up over-crediting last-click channels, undervaluing top-of-funnel efforts, and wasting ad spend on campaigns that look good on the surface but fail to drive real revenue.
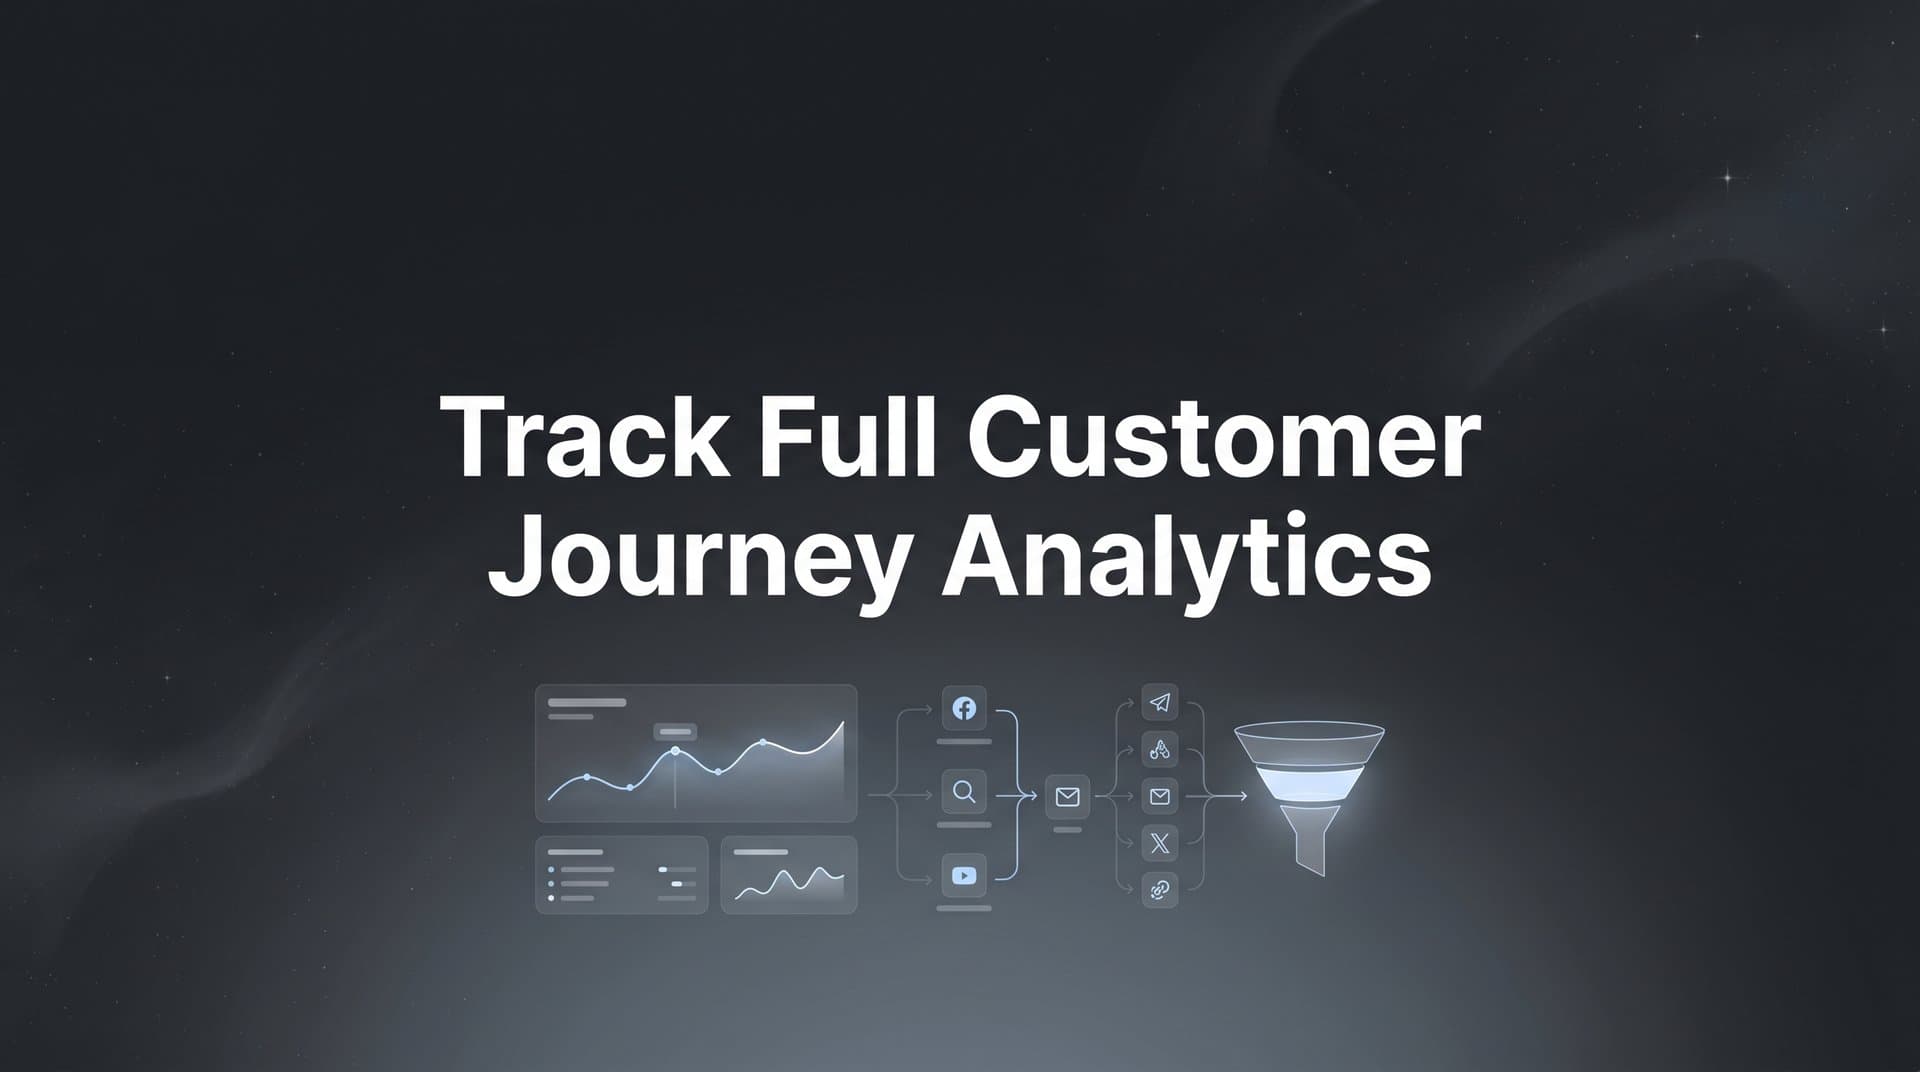
Tracking full customer journey analytics means connecting every interaction a prospect has with your brand, from the first ad click through email opens, site visits, demo requests, and ultimately the closed deal or purchase. It gives you a unified view of what is actually working so you can invest confidently in the channels and campaigns that generate revenue, not just traffic.
The challenge has grown significantly in recent years. Privacy changes like iOS App Tracking Transparency, ongoing cookie deprecation efforts, and widespread ad blocker usage have made browser-based pixel tracking less reliable than ever. The old approach of dropping a pixel on your site and calling it "tracking" no longer captures the full picture. You need a more deliberate, structured approach to connect the dots across every channel and platform.
In this guide, you will learn exactly how to set up end-to-end customer journey tracking across your ad platforms, website, and CRM. We will walk through six concrete steps, from defining your key touchpoints all the way to using your journey data to optimize campaigns and feed better signals back to ad platform algorithms.
Whether you run paid ads for an ecommerce brand or manage multi-channel campaigns for a B2B SaaS company, these steps will help you move from fragmented reporting to a complete, actionable view of your customer journey.
Step 1: Map Out Every Touchpoint in Your Marketing Funnel
Before you configure a single tracking pixel or integration, you need a clear map of what you are actually trying to track. This sounds obvious, but many teams skip directly to the technical setup and end up with data that is technically collected but strategically useless.
Start by defining what counts as a touchpoint for your specific business. A touchpoint is any meaningful interaction a prospect has with your brand that could influence their decision to buy. This includes ad clicks, landing page visits, email opens and clicks, webinar registrations, content downloads, demo requests, free trial signups, and purchases. For B2B teams, it also includes CRM stage changes like moving from "Marketing Qualified Lead" to "Sales Accepted Lead." Understanding customer journey touchpoints in detail is essential before moving to the technical implementation.
Next, organize your touchpoints by funnel stage:
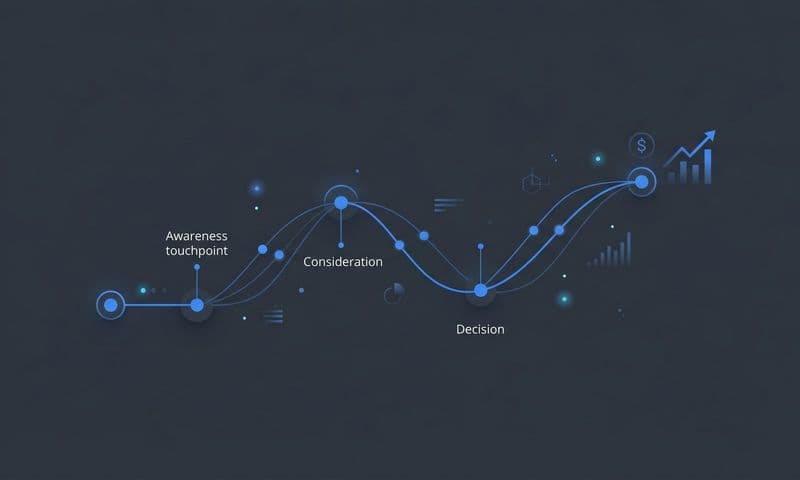
Top-of-funnel awareness touches: These are the first interactions where a prospect encounters your brand. Think paid social impressions and clicks, YouTube pre-roll views, organic search visits, and display ad exposures. These rarely convert directly but play a critical role in warming up your audience.
Mid-funnel consideration touches: These happen when a prospect is actively evaluating your solution. Blog post visits, case study downloads, email sequences, retargeting ad clicks, and product page views all fall here. This stage is where most attribution models fail to give proper credit.
Bottom-of-funnel conversion events: These are the actions that directly precede or signal a purchase decision. Demo requests, free trial activations, checkout completions, and sales calls belong in this category.
Once you have your touchpoints listed, create a visual journey map that documents all the channels involved and the typical paths customers take. You can do this in a simple spreadsheet or a whiteboard tool, or use dedicated customer journey mapping tools to streamline the process. The goal is to see the full sequence, not just the endpoints.
As you map, pay close attention to where you currently lose visibility. Cross-device journeys are a common blind spot: a prospect clicks an ad on mobile, researches on desktop, and converts on a work laptop. Offline interactions like phone calls or in-person events are another gap that many teams ignore entirely.
One of the most common pitfalls here is only mapping the "happy path," the clean linear journey from ad click to purchase. Real customer journeys are rarely linear. Prospects revisit your site multiple times, engage across different channels on different days, and often go quiet before returning weeks later. Your map needs to account for these non-linear paths, or your tracking setup will miss significant portions of the actual journey.
Step 2: Connect Your Ad Platforms, Website, and CRM Into One Data Layer
Siloed data is the root cause of broken customer journey tracking. Every ad platform sees only its own piece of the puzzle. Meta knows about the Facebook click. Google knows about the search click. Your CRM knows about the closed deal. But none of them talk to each other by default, which means no single system has the full picture.
The solution is to build a unified data layer that connects your ad platforms, your website, and your CRM so that every touchpoint is linked to a single customer record. Here is how to approach this practically.
Start by integrating your major ad platforms into a central analytics hub. This typically means connecting Meta Ads, Google Ads, TikTok Ads, and LinkedIn Ads so their campaign data flows into one place alongside your website and CRM data. The goal is not just to see ad spend in one dashboard, but to connect ad-level data to actual revenue outcomes from your CRM. Choosing the right customer journey analytics tools is critical for making this integration seamless.
This is where server-side tracking becomes critical. Traditional browser-based pixels rely on JavaScript running in a visitor's browser, which means they are vulnerable to ad blockers, browser privacy restrictions, and the impact of iOS privacy changes. Server-side tracking moves the data collection to your server instead, capturing events that browser pixels would miss entirely.
Think of it this way: a browser pixel is like trying to count cars on a highway by standing on the sidewalk. You will miss some because of blind spots and obstructions. Server-side tracking is like having sensors embedded directly in the road. The data is more complete and more accurate. Our deep dive into why server-side tracking is more accurate explains the technical advantages in detail.
For B2B teams especially, CRM integration is non-negotiable. Your CRM holds the ground truth about which leads actually converted into revenue. Without connecting it to your marketing data, you are optimizing based on lead volume rather than lead quality. A campaign that drives 100 leads is meaningless if only two of them close. A campaign that drives 20 leads with ten closures is worth scaling aggressively.
Cometly is built specifically to solve this integration challenge. It connects your ad platforms, website, and CRM into a unified view with server-side tracking built in, so you can see a single customer record with every marketing touchpoint attached from the first ad click through to CRM-verified revenue. That unified record is the foundation everything else in this guide builds on.
The success indicator for this step is straightforward: you should be able to pull up a single customer record and see every marketing interaction they had with your brand, along with the revenue they generated. If you can do that, your data layer is working.
Step 3: Implement UTM Parameters and Tracking Identifiers Consistently
Even with a solid data layer in place, your journey analytics will fall apart if your UTM parameters are inconsistent or incomplete. UTM hygiene is one of the most common pain points in marketing analytics, and it is entirely preventable with a clear naming convention applied consistently across every campaign.
UTM parameters are the tags you append to your URLs that tell your analytics system where traffic came from. At minimum, you should be using these five parameters on every paid link:
utm_source: The platform driving the traffic, such as facebook, google, or linkedin.
utm_medium: The channel type, such as cpc, paid-social, or email.
utm_campaign: The specific campaign name, ideally including the offer and audience for easy filtering.
utm_content: The specific ad or creative variant, which enables creative-level performance analysis.
utm_term: The keyword or audience segment, particularly useful for search campaigns.
Beyond UTMs, use platform-specific click identifiers alongside your custom parameters. Facebook's fbclid and Google's gclid provide platform-level accuracy that UTMs alone cannot match, especially when it comes to matching ad clicks to conversions across sessions.
The most important rule in UTM implementation is consistency. Decide on your naming conventions before you launch any campaign and document them in a shared reference that your entire team uses. For a comprehensive walkthrough on setting up campaign-level tracking, see our guide on how to track marketing campaigns effectively.
A common mistake is building UTMs that only distinguish campaigns but not ad sets or creatives. If all your ads within a campaign share the same utm_content value, you cannot tell which creative drove conversions. Set up your naming conventions to enable creative-level and audience-level insights from the start, not just campaign-level reporting.
The payoff of clean UTM hygiene is significant. When your data is consistently tagged, you can filter and segment your journey analytics with confidence. You can compare performance across campaigns, creatives, and channels without worrying that inconsistent naming is skewing your results.
Step 4: Choose the Right Attribution Model for Your Business
Once your tracking is in place, you need to decide how to assign credit for conversions across the multiple touchpoints in a customer journey. This is what attribution models do, and choosing the right one has a direct impact on how you allocate your marketing budget.
Here is a clear breakdown of the core models:
First-touch attribution: Gives 100% of the credit to the first interaction a customer had with your brand. This is useful for understanding what drives initial awareness, but it ignores everything that happened afterward to close the deal.
Last-touch attribution: Gives 100% of the credit to the final touchpoint before conversion. This is the default model in most ad platforms and analytics tools, and it is also the most misleading. It systematically undervalues every channel that contributed earlier in the journey.
Linear attribution: Distributes credit equally across all touchpoints in the journey. This is a significant improvement over last-touch because it acknowledges that multiple interactions contributed, though it treats a quick homepage visit the same as a 20-minute product demo watch.
Time-decay attribution: Gives more credit to touchpoints that occurred closer to the conversion. This makes intuitive sense for shorter sales cycles where recent interactions are more influential.
Data-driven or multi-touch attribution: Uses actual conversion data to assign credit based on how much each touchpoint statistically contributed to conversions. This is the most accurate model when you have sufficient data volume, and it is the one that gives you the most reliable foundation for budget decisions. Understanding the attribution challenges in marketing analytics helps you avoid common pitfalls when implementing these models.
The right model for your business depends on your sales cycle length and the number of channels you are running. For ecommerce with short purchase cycles, time-decay or data-driven models work well. For B2B SaaS with longer cycles involving many touchpoints over weeks or months, multi-touch attribution is essential because the journey is simply too complex for any single-touch model to represent accurately.
Here is the key insight: do not lock yourself into a single model. The real power comes from comparing models side by side. When you can see how credit shifts between channels depending on the model you apply, you get a much richer understanding of how your channels work together. Cometly lets you compare attribution models side by side so you can see exactly how revenue attribution changes across first-touch, last-touch, linear, and multi-touch views. For a deeper look at the best tools available, explore our roundup of best software for tracking marketing attribution in 2026.
The success indicator for this step is being able to explain, with data, why a specific channel deserves more or less budget based on its attributed revenue across multiple models. That is the kind of clarity that separates confident budget decisions from guesswork.
Step 5: Analyze Journey Data to Find Revenue-Driving Patterns
With your tracking in place and your attribution model selected, you are now sitting on a dataset that most marketing teams never have access to: full-path analytics showing every touchpoint in every customer journey. The question is what to do with it.
The first thing to move beyond is single-channel metrics. Clicks, impressions, and CTR tell you how individual ads are performing in isolation. Full-path analytics tell you which combinations of touchpoints lead to the highest conversion rates and the most revenue. Those are very different questions with very different answers.
Start by identifying your most common conversion paths. Look at the sequences of touchpoints that appear most frequently among customers who converted. You might discover that customers who engage with a paid social ad, then return via organic search, then click a retargeting ad convert at a much higher rate than customers who only interact with one channel. That insight alone can reshape how you think about your channel mix. Learning how to leverage analytics for marketing strategy turns these patterns into concrete budget decisions.
Pay attention to the average number of touches before a sale. For B2B companies, it is common for prospects to have many interactions across weeks or months before converting. For ecommerce, it might be fewer touches over a shorter window. Knowing your baseline helps you identify when a prospect is unusually far along in the journey without converting, which could signal a friction point worth investigating.
Actively look for drop-off points where prospects disengage. If a large percentage of prospects who request a demo never show up for it, that is a journey gap worth addressing. If prospects who visit your pricing page consistently bounce without converting, that page might need work. Full journey data surfaces these patterns in a way that page-level analytics simply cannot.
AI-powered analysis can accelerate this process significantly. Rather than manually sifting through path data, Cometly's AI recommendations surface high-performing ads and campaigns across channels automatically, highlighting where your budget is generating the strongest returns and where opportunities exist to scale.
Segment your journey data by audience type, deal size, or product line for deeper insights. Enterprise prospects often follow a different journey than SMB prospects. New customers behave differently from returning ones. Segmentation reveals patterns that get buried when you look at aggregate data. For enterprise teams managing complex funnels, enterprise customer journey analytics software provides the scale and depth needed for this level of analysis.
The common pitfall here is drowning in data without a clear focus. Every analysis should connect back to a revenue question. Which channels drive the highest-value customers? Which paths lead to the fastest sales cycles? Which touchpoint combinations produce the best ROAS? Keep revenue at the center of every analysis and you will always find actionable insights.
Step 6: Feed Enriched Conversion Data Back to Ad Platforms
This step is the most overlooked in the entire journey tracking process, and it is also one of the most impactful. Most marketers think of attribution as a reporting exercise: collect data, analyze it, make decisions. But there is a second use for your journey data that directly improves your ad performance over time.
Ad platform algorithms, whether Meta, Google, TikTok, or LinkedIn, optimize based on the conversion signals you send them. When you only send basic pixel data like page views and button clicks, the algorithm optimizes for those events. It finds more people who are likely to click buttons. That sounds fine until you realize that button clickers are not the same as revenue-generating customers.
If you send the algorithm enriched, revenue-verified conversion events, it learns to find more people who look like your actual buyers. The quality of the signal you send directly determines the quality of the audience the algorithm targets. This is not a minor optimization. It can fundamentally shift the caliber of leads and customers your ads attract.
The process is called conversion sync, and it works by taking the CRM-verified revenue events from your attribution data and sending them back to the ad platforms as conversion signals. Instead of telling Meta "someone clicked a button," you are telling it "someone with these characteristics became a customer worth this much revenue." That is a dramatically richer signal for the algorithm to learn from.
Cometly's Conversion Sync does exactly this, feeding enriched, conversion-ready events back to Meta, Google, TikTok, and other platforms automatically. As the algorithm receives better data, its targeting improves. Better targeting leads to better results. Better results generate even richer conversion data to send back. This creates a compounding feedback loop where your ad performance improves continuously over time.
The success indicator for this step is clear: your ad platform reported conversions should closely match your actual CRM-verified revenue events. If there is a large gap between what Meta or Google reports as conversions and what your CRM shows as actual closed deals, your conversion signals need enrichment. Close that gap and you will see your algorithmic optimization improve accordingly.
Your Complete Journey Tracking Checklist
Tracking full customer journey analytics is not a one-time setup. It is an ongoing practice of refining your touchpoint map, testing attribution models, and continuously improving the quality of data flowing through your system. Here is a quick-reference checklist to keep you on track:
Step 1: Map your touchpoints. Document every interaction across all funnel stages, identify cross-device and offline gaps, and account for non-linear journeys.
Step 2: Unify your data layer. Connect ad platforms, your website, and your CRM with server-side tracking so every touchpoint links to a single customer record.
Step 3: Standardize UTM parameters. Build and enforce a consistent naming convention across every campaign, ad set, and creative. Use platform click identifiers alongside UTMs.
Step 4: Select and compare attribution models. Choose a model appropriate for your sales cycle, and compare multiple models side by side to understand how credit shifts across channels.
Step 5: Analyze full-path data. Look for revenue-driving touchpoint combinations, common conversion paths, drop-off points, and audience-level patterns. Keep revenue at the center of every analysis.
Step 6: Sync enriched conversions back to ad platforms. Send CRM-verified revenue events to Meta, Google, TikTok, and other platforms to improve algorithmic targeting over time.
When you can see the complete path from ad click to revenue, every budget decision becomes clearer and more confident. You stop guessing which channels are working and start knowing. You stop over-investing in last-click channels and start giving proper credit to the full journey that drives your growth.
Steps 2 through 6 in this guide are exactly what Cometly is built to handle in a unified platform. It connects your ad platforms, website, and CRM for real-time, full-journey analytics with server-side tracking, multi-touch attribution, AI-powered recommendations, and conversion sync all in one place. Get your free demo today and start capturing every touchpoint to maximize your conversions.