You pull the numbers for last week's campaign. Meta Ads Manager says you drove 94 conversions. Google Ads claims 67. Your CRM shows 41 closed leads. Same campaign, same time period, three completely different stories. If this scenario feels uncomfortably familiar, you are not alone, and more importantly, your tracking is not necessarily broken.
Attribution reporting discrepancies are one of the most common frustrations in performance marketing, and they are not random noise. They are a predictable, structural outcome of how different platforms measure the same customer journey through entirely different lenses. Every ad network has its own tracking logic, its own attribution windows, and its own definition of what counts as a conversion. The moment you run campaigns across more than one platform, discrepancies become inevitable.
The real problem is not that the numbers differ. The real problem is what happens when marketers treat those platform-reported numbers as ground truth and make budget decisions based on them. That is where inflated ROAS leads to misallocated spend, where campaigns that are actually working get cut, and where campaigns claiming credit for conversions they did not drive continue to drain your budget.
This article will walk you through exactly why these discrepancies exist, the technical factors that make them worse, the business impact of ignoring them, and a practical framework for building a reporting layer you can actually trust. Whether you are managing a lean in-house team or running campaigns for multiple clients, understanding attribution discrepancies is foundational to making smarter, more confident decisions with your ad spend.
Why Every Platform Tells a Different Story
Think of each ad platform as a narrator telling the story of your customer's journey, except each narrator only sees part of the journey and has a strong incentive to make themselves the hero. That is essentially what is happening when Meta, Google, and TikTok each report different conversion numbers for the same campaign period.
Every major ad platform operates as its own independent attribution system. Meta Ads Manager has its own tracking pixel, its own event matching logic, and its own rules for when a conversion gets credited to an ad. Google Ads does the same. So does TikTok. None of these systems talk to each other, and none of them are designed to give you a unified view of the customer journey. They are designed to show you the value of advertising on their platform.
This is where platform self-attribution bias enters the picture. Because ad networks report their own performance, they naturally measure what they can see within their own ecosystem. If a user clicks a Meta ad on Monday, sees a Google Display ad on Wednesday, and converts on Friday after clicking a Google Search ad, Meta will claim credit for that conversion within its attribution window. Google will also claim credit. Both are technically correct within their own systems. The result is a single sale counted multiple times across platforms, which is why the sum of your platform-reported conversions almost always exceeds your actual revenue data.
Attribution window defaults make this worse. Meta's default attribution setting is 7-day click and 1-day view. This means Meta will attribute a conversion to an ad if the user clicked that ad within the past seven days or simply viewed it within the past day. Google Ads typically defaults to last-click attribution with its own configurable window options depending on campaign type. These defaults are not aligned with each other, and they are rarely aligned with how your CRM records conversions. Understanding attribution window performance is essential before drawing any conclusions from platform data.
So when you compare Meta's reported conversions to Google's reported conversions to your CRM data, you are not comparing the same measurement. You are comparing three different interpretations of the same events, each filtered through a different set of rules. The discrepancy is not a bug in your setup. It is the natural output of incompatible systems measuring the same reality from different vantage points.
Understanding this is the first step toward resolving it. You cannot fix a discrepancy you do not understand, and you cannot build a reliable reporting framework without acknowledging that native platform dashboards are inherently self-serving by design.
The Technical Culprits Behind the Data Gaps
Beyond platform design differences, there are specific technical factors that widen the gap between what platforms report and what actually happened. These are not abstract problems. They directly affect the quality and completeness of the data flowing into your attribution system.
Browser-based tracking limitations: The most significant shift in recent years has been Apple's App Tracking Transparency framework, introduced with iOS 14.5, which requires users to explicitly opt in to cross-app tracking. Combined with Safari's Intelligent Tracking Prevention, which limits the lifespan of first-party cookies, the result is that a meaningful portion of user activity on Apple devices simply does not get captured by pixel-based tracking. When a pixel cannot fire reliably, ad platforms receive incomplete conversion signals, which means they are reporting on a subset of actual activity. The gap between platform-reported conversions and real conversions widens as a direct result.
Ad blocker interference: A significant share of users, particularly in tech-savvy or professional audiences, run ad blockers that prevent browser-based tracking scripts from loading entirely. This is another source of client-side data loss that inflates the discrepancy between what your CRM records and what your ad platforms see. If your target audience skews toward privacy-conscious users, this problem is more pronounced. These are among the most common attribution challenges in marketing analytics that teams face today.
Conversion deduplication failures: When you implement both a browser pixel and a server-side event for the same conversion, you need proper deduplication logic to prevent platforms from counting that conversion twice. The standard approach is to pass a unique event ID with both the pixel event and the server-side event so the platform can recognize them as the same occurrence. Without this, platforms can double-count, making your reported conversion numbers higher than reality. This is a common implementation mistake that inflates ROAS and creates false confidence in campaign performance.
Attribution window timing gaps: Your CRM and your ad platforms often operate on different time horizons. A lead that enters your CRM today might not be marked as a closed deal for two weeks. Meanwhile, your ad platform's attribution window may have already closed on the campaign that drove that lead. The result is a conversion that your CRM eventually records but your ad platform never captures, creating a systematic undercount in platform data relative to actual business outcomes. This is especially common in B2B environments with longer sales cycles.
Each of these technical factors compounds the structural differences between platforms. Taken together, they explain why the discrepancies you see are not just a matter of different attribution windows but a layered problem involving data completeness, implementation quality, and timing mismatches across systems.
How Discrepancies Silently Damage Your Ad Strategy
Here is where the stakes become real. Attribution discrepancies are not just an analytics headache. Left unaddressed, they actively distort your decision-making in ways that cost real money.
Budget misallocation from inflated ROAS: When a marketer looks at a campaign reporting a strong return on ad spend inside Meta Ads Manager and scales budget based on that number, they are trusting a figure that may include conversions also being claimed by Google, organic search, or email. The actual incremental contribution of that Meta campaign could be significantly lower. Scaling based on platform-reported ROAS without cross-referencing actual revenue data is one of the most common ways ad budgets get misallocated. Campaigns that look like winners on paper can quietly drain budget without delivering proportional real-world returns. Understanding Facebook Ads reporting discrepancies specifically can help you identify where this inflation is most likely to occur.
Cutting campaigns that are actually working: The reverse is equally dangerous. A campaign that assists conversions early in the customer journey may show weak numbers inside its own platform dashboard because the final conversion gets credited to a different channel. A marketer relying solely on last-click platform data might pause that campaign, not realizing it was driving significant top-of-funnel activity that other channels were converting. Without a view of the full customer journey, you end up penalizing channels that contribute without closing.
Ad platform algorithm degradation: This is a less obvious but critically important consequence. Meta and Google's optimization algorithms rely on the conversion signals you send them to improve targeting and bidding. When those signals are inaccurate, incomplete, or inflated due to deduplication failures or pixel data loss, the algorithm learns from bad data. It begins optimizing toward the wrong audiences and the wrong behaviors. Performance degrades over time, and the root cause is invisible unless you are actively monitoring signal quality.
Decision paralysis and reporting distrust: Teams that regularly encounter irreconcilable numbers across platforms often stop trusting their data altogether. Reporting reviews become exercises in explaining discrepancies rather than driving decisions. Marketers default to gut-feel or institutional habits rather than data, which stalls growth and erodes the entire value of having analytics in place. This is a cultural and operational cost that is harder to quantify but very real in practice.
The common thread across all of these consequences is that they are invisible when you are only looking at individual platform dashboards. The damage accumulates quietly until a budget review or a revenue miss forces the question of why the numbers never add up.
Building a Framework to Reconcile Attribution Data
The good news is that attribution discrepancies are solvable. Not perfectly, because some level of measurement uncertainty is inherent to digital advertising, but reliably enough to make confident, well-grounded decisions. The key is building a structured approach rather than trying to make individual platform dashboards agree with each other.
Establish a single source of truth: The most important decision you can make is choosing one attribution layer to serve as your authoritative record for conversions. This should not be Meta Ads Manager or Google Ads. Those are channel-specific reporting tools with built-in self-attribution bias. Instead, choose a dedicated attribution reporting software that sits above all your ad channels and aggregates data from your ad platforms, your CRM, and your website. When numbers conflict, this is the system you trust. Everything else is supplementary context.
Standardize your attribution model across reporting: Before you can compare channel performance meaningfully, you need to understand what attribution model each platform is using by default and apply a consistent model in your unified reporting layer. If Meta is reporting on a 7-day click window and you are evaluating Google on last-click, you are not making a fair comparison. Decide on a model, apply it consistently, and use it as the basis for all cross-channel budget decisions. This does not mean ignoring platform-native data, but it does mean not letting mismatched defaults drive your conclusions.
Implement server-side tracking to close data gaps: Server-side event tracking is one of the most impactful technical improvements you can make to your attribution setup. Instead of relying on a browser pixel that can be blocked by ad blockers, prevented by iOS privacy settings, or disrupted by Safari ITP, server-side tracking sends conversion data directly from your server to the ad platform. Meta calls this the Conversions API. Google has its own server-side implementation options. Because the event originates from your server rather than the user's browser, it bypasses most of the client-side data loss that creates gaps between platform-reported and actual conversions. A proper attribution tracking setup should always include server-side coverage alongside your pixel implementation.
When you implement server-side tracking alongside your pixel and use proper event ID deduplication, you get the best of both worlds: real-time browser-based tracking where it works, and server-side coverage where it does not. The result is more complete conversion signals, more accurate platform reporting, and a narrower gap between what platforms see and what your CRM records.
These three elements, a single source of truth, standardized attribution models, and server-side tracking, form the foundation of a reliable attribution framework. Everything else builds on top of this base.
Multi-Touch Attribution: Seeing the Full Customer Journey
If platform self-attribution bias is the structural cause of discrepancies, last-click attribution is the model that makes it worst. Last-click gives 100 percent of the conversion credit to the final touchpoint before a conversion, which means every platform with any touchpoint near the end of the journey fights to claim that credit. The result is the overlapping attribution problem described earlier, where the same conversion gets counted by multiple platforms simultaneously.
Multi-touch attribution takes a fundamentally different approach. Instead of assigning all credit to a single touchpoint, it distributes credit across the entire path to conversion. This gives you a more accurate picture of which channels are driving conversions and which are assisting them, two very different contributions that last-click attribution collapses into one. The difference between single-source and multi-touch attribution models is one of the most important concepts to grasp when building a cross-channel measurement strategy.
The most common multi-touch models each have a different philosophy about how to distribute that credit. Linear attribution gives equal weight to every touchpoint in the journey. Time-decay attribution gives more credit to touchpoints closer to the conversion, on the premise that they had more influence on the final decision. Data-driven attribution uses machine learning to assign credit based on the actual patterns in your conversion data, weighing touchpoints by their observed contribution to conversions rather than following a fixed rule.
For marketers running campaigns across multiple channels, the practical value of multi-touch attribution is clarity about the role each channel plays. A display campaign might rarely appear as the last click before a conversion, but it may consistently appear early in the journeys of your highest-value customers. Under last-click attribution, that campaign looks like it is not working. Under a multi-touch model, its contribution becomes visible and defensible.
The deeper value comes when you connect ad click data to CRM events and downstream revenue. This connection allows you to evaluate channels not just by conversion volume but by conversion quality. Which channels drive leads that close at higher rates? Which ones bring in customers with higher lifetime value? These questions cannot be answered by looking at platform dashboards in isolation. They require a unified view that links ad activity to real business outcomes, from the first impression to the closed deal.
This is the level of attribution clarity that fundamentally changes how you allocate budget and evaluate cross-channel attribution and marketing ROI. It moves you from optimizing for platform-reported metrics to optimizing for actual revenue impact.
Turning Accurate Attribution Into Confident Ad Decisions
Accurate attribution is only valuable if it changes how you act. Here is how to translate a reliable attribution framework into better ad decisions in practice.
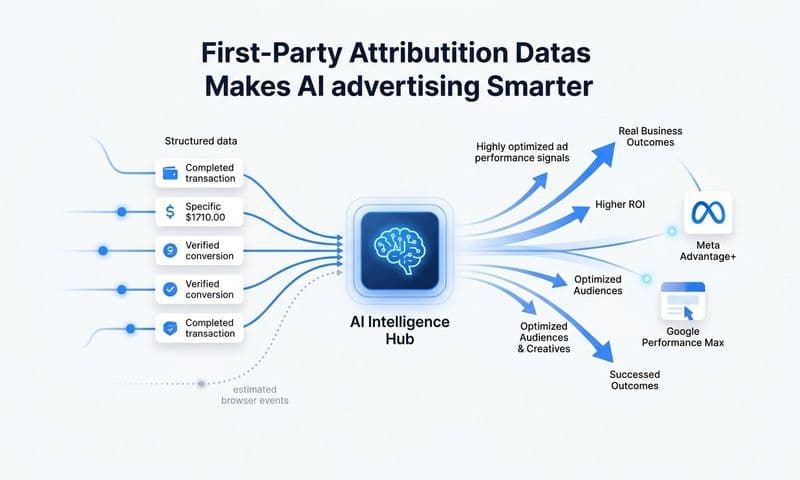
Feed enriched conversion data back to ad platforms: When you implement server-side tracking and deduplicate your conversion events properly, you are not just improving your own reporting. You are also improving the quality of the signals you send back to Meta and Google's optimization algorithms. Their systems use your conversion data to determine who to target and how to bid. Better signals mean better targeting, lower cost per acquisition, and more efficient use of your budget. Sending enriched, accurate conversion events through tools like Meta's Conversions API directly improves the performance of the campaigns you are already running.
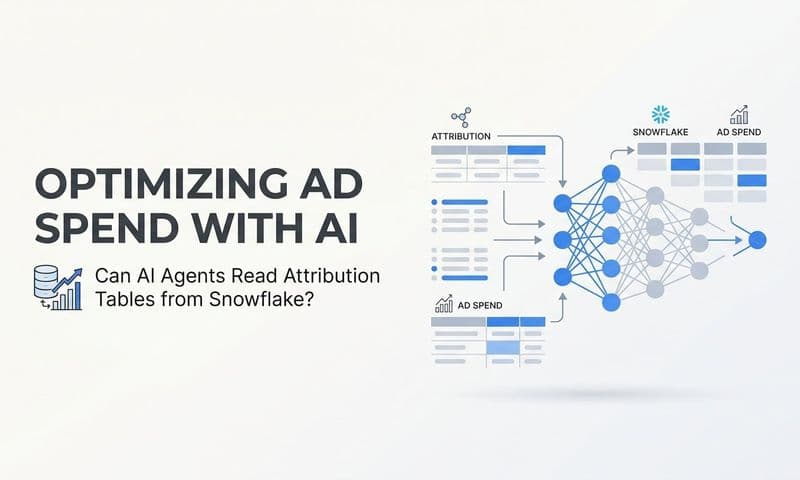
Use AI-powered attribution analysis to surface what is actually driving revenue: One of the most time-consuming parts of attribution analysis is manually sifting through campaign data across platforms to identify which ads and creatives are genuinely contributing to revenue versus which ones are claiming credit without delivering it. AI-powered attribution tools can automate this analysis, surfacing patterns across large datasets that would take a human analyst hours to uncover. The result is faster, more confident scaling decisions grounded in actual performance data rather than platform-reported metrics.
Establish a weekly cross-platform reconciliation cadence: Attribution accuracy is not a one-time setup task. It requires ongoing monitoring. Building a weekly review into your reporting process, where you compare your unified attribution dashboard against platform-native data and flag significant discrepancies, allows you to catch data quality issues early before they compound into major budget misallocations. This cadence also builds organizational trust in your data over time. When your team sees that discrepancies are being actively monitored and explained, confidence in data-driven decisions increases. Learning how to fix attribution discrepancies in data systematically is what separates teams that scale confidently from those that remain stuck in reporting debates.
The combination of accurate data, enriched platform signals, and AI-assisted analysis creates a compounding advantage. Each improvement in signal quality leads to better algorithm performance, which generates better campaign results, which generates more reliable data to analyze. The cycle works in your favor when the foundation is solid.
The Bottom Line on Attribution Discrepancies
Attribution discrepancies are not a sign that your tracking is broken. They are a predictable outcome of running campaigns across platforms that each measure the customer journey through their own lens, with their own defaults, and with their own incentives to claim credit. Understanding this is the shift that moves you from frustration to action.
The path forward is not about making Meta and Google agree with each other. It is about building a reliable attribution layer above those platforms that captures the full customer journey, applies consistent measurement standards, and connects ad activity to actual revenue. That layer becomes your source of truth, and everything else becomes context.
Cometly is built to be exactly that layer. It connects your ad platforms, CRM, and website into a single attribution system that tracks every touchpoint from the first ad click to the closed deal. With server-side tracking to close data gaps, multi-touch attribution to distribute credit accurately, and AI-powered analysis to surface which campaigns are actually driving revenue, Cometly gives you the clarity to make confident budget decisions without second-guessing your data. It also feeds enriched, deduplicated conversion signals back to Meta and Google, improving their optimization algorithms and making your existing campaigns work harder.
If you are tired of pulling three different numbers from three different dashboards and trying to reconcile them manually, there is a better way. Get your free demo today and start capturing every touchpoint to maximize your conversions.