Your Google Ads dashboard shows 150 conversions this month. Your CRM recorded 142 closed deals. Google Analytics reports 168 goal completions. Three different numbers for what should be the same metric—and you're supposed to make million-dollar budget decisions based on this chaos.
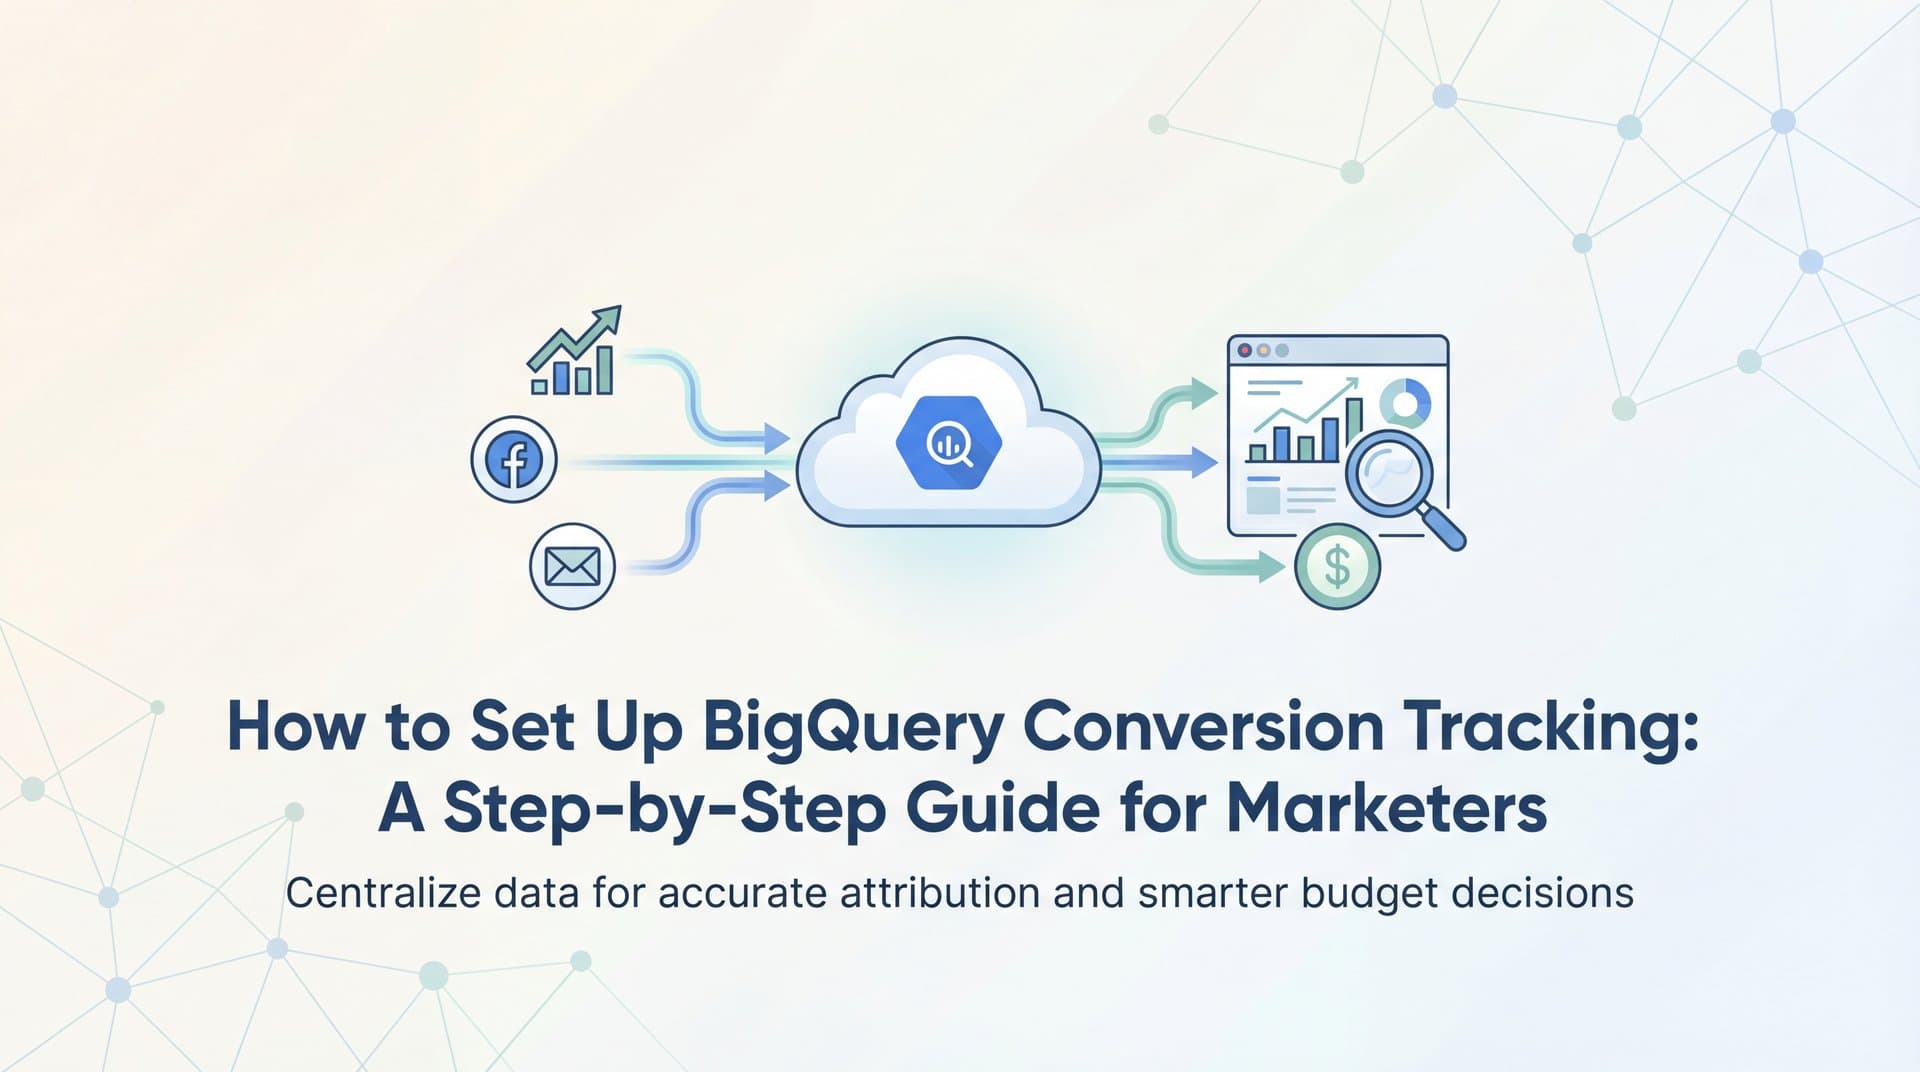
BigQuery conversion tracking solves this mess by creating a single source of truth for all your marketing data. Instead of trusting conflicting reports from siloed platforms, you centralize everything in Google's powerful data warehouse where you can query, analyze, and attribute conversions with complete accuracy.
The real advantage? You control the data. You decide how to attribute conversions across touchpoints. You determine which metrics matter for your business. And you feed cleaner, more accurate conversion data back to your ad platforms so their algorithms optimize toward actual revenue instead of inflated vanity metrics.
This guide walks you through building a complete BigQuery conversion tracking system from scratch. You'll learn how to structure your data warehouse, connect your marketing platforms, write attribution queries that reveal true campaign performance, and export conversions back to Google Ads and Meta for better optimization.
Whether you're tracking e-commerce purchases, B2B lead submissions, or SaaS trial signups, the principles remain the same. By the end of this guide, you'll have a working setup that captures every conversion event and ties it back to the specific ads, keywords, and campaigns that drove it.
Step 1: Create Your BigQuery Project and Dataset
Before you can track anything, you need a home for your data. BigQuery organizes everything into projects and datasets—think of projects as top-level containers for all your Google Cloud resources, and datasets as folders within those projects where your actual data tables live.
Navigate to the Google Cloud Console and either create a new project or select an existing one. Give it a descriptive name like "Marketing Attribution" or "Conversion Tracking" so you can identify it easily when you have multiple projects running. If you're working within an organization, check with your IT team first—they may already have a project structure you should follow.
Next, enable the BigQuery API for your project. Google Cloud requires explicit API activation before you can use any service. You'll find this under "APIs & Services" in the console menu. While you're there, set up billing. BigQuery offers a generous free tier—the first 1TB of queries per month costs nothing, and the first 10GB of storage is free. For most small-to-mid-sized marketing operations, you'll stay comfortably within these limits.
Now create your dataset. Click the three dots next to your project name in the BigQuery interface and select "Create dataset." Name it something clear like "conversion_data" or "marketing_events." The naming convention matters more than you might think—six months from now, when you're building complex queries, you'll appreciate descriptive names.
Configure your dataset location carefully. If most of your users are in North America, choose a US region. If you're serving European customers, select an EU region. This isn't just about performance—it's about compliance. GDPR and other privacy regulations often require data to stay within specific geographic boundaries.
Set the data expiration to "Never" unless you have specific retention policies. Marketing attribution often requires looking back months or even years to understand long sales cycles.
Verify everything works by running a simple test query. In the BigQuery console, click "Compose new query" and type: SELECT 1 as test. Hit Run. If you see a result table with a single row showing "1," your conversion tracking setup is complete and you have the necessary permissions to query data.
Step 2: Design Your Conversion Events Schema
Your schema is the blueprint for how conversion data gets stored. Get this wrong, and you'll spend months fighting with messy data. Get it right, and attribution queries become straightforward.
Start by listing every conversion event you need to track. E-commerce businesses might track: product_view, add_to_cart, initiate_checkout, purchase. B2B companies might track: demo_request, trial_signup, sales_qualified_lead, closed_won. SaaS businesses might track: free_trial_start, feature_activation, upgrade_to_paid.
Each conversion event needs its own row in your table. Create a table called "conversions" with these essential columns:
event_id: A unique identifier for each conversion (STRING). Use UUIDs or a combination of timestamp + user_id to ensure uniqueness. This is crucial for deduplication later.
user_id: Your internal identifier for the customer (STRING). This could be an email hash, customer ID, or any consistent identifier that appears across your systems.
timestamp: When the conversion happened (TIMESTAMP). Always use UTC to avoid timezone confusion. BigQuery's TIMESTAMP type handles this automatically.
conversion_type: What action they took (STRING). Use consistent naming: "purchase," "demo_request," "trial_signup." Avoid variations like "Purchase," "PURCHASE," or "checkout_complete" for the same event.
conversion_value: Revenue or assigned value (FLOAT64). For purchases, this is the transaction amount. For leads, assign estimated values based on your average deal size.
source: Traffic source (STRING). Examples: "google," "facebook," "email," "direct."
medium: Marketing medium (STRING). Examples: "cpc," "social," "email," "organic."
campaign: Campaign name (STRING). Pull this from UTM parameters or your ad platform's campaign structure. Understanding UTM tracking and how it helps your marketing is essential for proper campaign attribution.
Now add the attribution-critical fields that make multi-touch analysis possible:
gclid: Google Click ID (STRING). Capture this from the URL parameter when users arrive from Google Ads. Essential for matching conversions back to specific ad clicks.
fbclid: Facebook Click ID (STRING). Same purpose for Meta campaigns.
first_touch_source: Where the customer first discovered you (STRING). This enables first-touch attribution modeling.
session_count: How many sessions before converting (INTEGER). Reveals whether your campaigns drive immediate conversions or require nurturing.
days_to_convert: Time from first touch to conversion (INTEGER). Critical for understanding sales cycle length by channel.
Test your schema by manually inserting a sample record. In the BigQuery console, use the INSERT statement to add a test conversion. Then query it back out to confirm all fields are storing data correctly. This catches type mismatches or naming errors before you start pumping in real data.
Step 3: Connect Your Data Sources to BigQuery
Your schema is ready. Now you need to fill it with actual conversion data from your marketing stack. This is where BigQuery transforms from an empty warehouse into a powerful attribution engine.
Start with Google Ads since it integrates natively. Navigate to BigQuery Data Transfer in the Google Cloud Console. Click "Create Transfer" and select "Google Ads" from the source list. Authorize access to your Google Ads account, then choose which campaigns to import. Schedule daily transfers to keep your data fresh. This automatically pulls campaign names, ad group details, keywords, and cost data into BigQuery tables. For a deeper dive into platform-specific setup, review our guide on Google Ads conversion tracking.
Next, connect Google Analytics 4. In your GA4 property settings, find "BigQuery Links" under Admin. Enable the export and select your BigQuery project and dataset. Choose to export events daily—this sends every pageview, click, and event to BigQuery where you can join it with your conversion data. The GA4 export creates tables named "events_YYYYMMDD" with one row per event, including all the parameters you've configured in GA4. Learn more about event tracking in Google Analytics to maximize the data you capture.
For CRM data—where your actual revenue lives—you'll need a data pipeline tool. Fivetran and Stitch both offer pre-built connectors for Salesforce, HubSpot, Pipedrive, and dozens of other CRMs. These tools sync your deals, contacts, and opportunity data to BigQuery on a schedule you define. Set up a connector for your CRM, map the fields to your schema, and schedule syncs to run at least daily. If you're using HubSpot specifically, check out our guide on HubSpot attribution tracking for integration best practices.
Here's where it gets critical: implement server-side tracking for conversions that happen on your website or app. Client-side pixels miss conversions due to ad blockers, browser privacy features, and JavaScript errors. Set up Google Tag Manager Server Container to capture conversion events server-side, then send them directly to BigQuery using a custom tag or webhook. Understanding why server-side tracking is more accurate will help you appreciate the importance of this step.
Your server-side setup should capture the conversion event, enrich it with click IDs and UTM parameters from the user's session, and insert it into your BigQuery conversions table in real time. This ensures you're tracking conversions that client-side tracking misses entirely.
Schedule all your data syncs strategically. If you run reports every morning, schedule syncs to complete overnight. If your ad platforms need fresh conversion data by 9 AM, ensure your BigQuery exports finish by 8 AM. Data freshness matters when you're making daily optimization decisions.
Verify data is flowing correctly by checking table update timestamps. Query your most recent records and confirm they're from today. If you see yesterday's data at noon, something in your pipeline is delayed and needs troubleshooting.
Step 4: Build Conversion Tracking Queries
You have conversion data flowing into BigQuery. Now you need queries that transform raw data into actionable insights. These queries become the foundation of your attribution reporting.
Start with a basic conversion count query grouped by source and campaign. This shows you which channels are driving volume:
SELECT source, campaign, COUNT(event_id) as conversions FROM `your_project.conversion_data.conversions` WHERE timestamp >= TIMESTAMP_SUB(CURRENT_TIMESTAMP(), INTERVAL 30 DAY) GROUP BY source, campaign ORDER BY conversions DESC;
This query counts conversions from the last 30 days and groups them by source and campaign. Run it to see which campaigns are generating the most conversion events. Volume alone doesn't tell the full story, though—you need to connect conversions to revenue and ad spend.
Build a revenue attribution query that joins your conversion data with ad spend from Google Ads. This calculates ROAS (Return on Ad Spend) by campaign:
SELECT c.campaign, SUM(c.conversion_value) as revenue, SUM(a.cost) as spend, SUM(c.conversion_value) / SUM(a.cost) as roas FROM `your_project.conversion_data.conversions` c JOIN `your_project.conversion_data.google_ads_campaigns` a ON c.campaign = a.campaign WHERE c.timestamp >= TIMESTAMP_SUB(CURRENT_TIMESTAMP(), INTERVAL 30 DAY) GROUP BY c.campaign ORDER BY roas DESC;
This shows you which campaigns generate the most revenue per dollar spent. A ROAS of 3.0 means you earn $3 for every $1 spent. Anything below 1.0 is losing money.
Now build a multi-touch attribution query using window functions. This distributes conversion credit across all touchpoints in the customer journey:
WITH customer_journeys AS (SELECT user_id, source, medium, campaign, timestamp, conversion_value, ROW_NUMBER() OVER (PARTITION BY user_id ORDER BY timestamp) as touchpoint_position, COUNT(*) OVER (PARTITION BY user_id) as total_touchpoints FROM `your_project.conversion_data.conversions`) SELECT source, medium, campaign, SUM(conversion_value / total_touchpoints) as attributed_revenue FROM customer_journeys GROUP BY source, medium, campaign ORDER BY attributed_revenue DESC;
This query gives each touchpoint in a customer's journey equal credit for the final conversion. If someone clicked a Facebook ad, then a Google ad, then converted, each ad gets 50% of the conversion value. You can modify the weighting logic to emphasize first touch, last touch, or time-decay models. For a comprehensive overview of attribution approaches, explore our attribution marketing tracking complete guide.
Calculate your key performance metrics in a single query that you can save as a view:
SELECT source, campaign, COUNT(event_id) as conversions, SUM(conversion_value) as revenue, SUM(cost) as spend, SUM(cost) / COUNT(event_id) as cpa, SUM(conversion_value) / SUM(cost) as roas, COUNT(event_id) / COUNT(DISTINCT user_id) as conversion_rate FROM `your_project.conversion_data.conversions` GROUP BY source, campaign;
Save this as a view called "campaign_performance" so you can query it instantly without rewriting the logic. Views in BigQuery act like saved queries that you can reference like tables.
Step 5: Export Conversions Back to Ad Platforms
Your BigQuery setup now captures accurate conversion data. The next step is feeding this data back to Google Ads and Meta so their algorithms can optimize toward real conversions instead of incomplete platform tracking.
Set up offline conversion imports for Google Ads using BigQuery scheduled queries. Create a query that formats your conversion data according to Google Ads requirements—you need the gclid, conversion_time, conversion_value, and conversion_name. Export this query result to a Cloud Storage bucket on a schedule, then configure Google Ads to automatically import from that bucket. Our guide on offline conversion tracking covers this process in detail.
The scheduled export query looks like this: SELECT gclid, UNIX_SECONDS(timestamp) as conversion_time, conversion_value, conversion_type as conversion_name FROM `your_project.conversion_data.conversions` WHERE timestamp >= TIMESTAMP_SUB(CURRENT_TIMESTAMP(), INTERVAL 1 DAY) AND gclid IS NOT NULL;
Schedule this query to run daily and export to Cloud Storage. Then in Google Ads, navigate to Tools & Settings > Conversions > Uploads and set up an automated import from your Cloud Storage bucket. Google Ads will pull new conversions daily and attribute them back to the original ad clicks.
For Meta campaigns, configure the Conversions API to send server-side events directly from BigQuery. You'll need to set up a Cloud Function that reads new conversions from your BigQuery table and posts them to Meta's Conversions API endpoint. Include the fbclid in your payload to match conversions to specific ad clicks. Learn how to sync conversion data to Facebook Ads for step-by-step instructions.
The Conversions API payload requires: event_name, event_time, user_data (hashed email or phone), and custom_data (value, currency). Your Cloud Function should format BigQuery rows into this structure and send them via HTTP POST to Meta's API.
Use Google Ads enhanced conversions to improve match rates with first-party data. Enhanced conversions send hashed email addresses, phone numbers, and names along with your conversion data. This helps Google match conversions even when gclid isn't available due to browser restrictions or tracking limitations. Understanding first-party data tracking is crucial for maximizing these match rates.
Schedule all exports to run during off-peak hours to avoid impacting your query performance during business hours. If you're exporting large volumes, consider batching conversions to avoid rate limits on ad platform APIs.
Monitor import success rates in your ad platforms. Google Ads shows you how many conversions were successfully matched to clicks. If your match rate is below 70%, investigate whether gclids are being captured correctly or if there are timing issues between click and conversion.
Step 6: Validate and Optimize Your Tracking Setup
Your BigQuery conversion tracking is live, but you need to verify it's accurate before making budget decisions based on the data. Even small tracking errors compound into major misattribution over time.
Compare BigQuery conversion counts against platform-reported conversions for the same time period. Pull your Google Ads conversion report and compare it to your BigQuery query results. Expect some discrepancy—BigQuery captures server-side events that Google Ads might miss, and Google Ads attributes conversions differently. But if the numbers are wildly different (more than 20% variance), investigate. Review our guide on fixing conversion tracking gaps to troubleshoot common issues.
Check for duplicate events using your event_id field. Run this deduplication query: SELECT event_id, COUNT(*) as duplicate_count FROM `your_project.conversion_data.conversions` GROUP BY event_id HAVING COUNT(*) > 1;
If you see results, you're counting some conversions multiple times. This happens when data syncs overlap or when multiple tracking methods fire for the same conversion. Add logic to your data pipeline to check for existing event_ids before inserting new records.
Audit attribution accuracy by spot-checking individual customer journeys. Pick a recent high-value conversion and trace it back through your data. Query all events for that user_id and verify the touchpoints match what you'd expect. If a customer shows a Facebook click followed immediately by a Google click with no time gap, something's wrong with your timestamp capture.
Set up alerts for data pipeline failures or unusual conversion volume drops. Use BigQuery scheduled queries to check for data freshness and send notifications when tables haven't updated in 24 hours. Create a monitoring query that compares today's conversion count to the 7-day average and alerts you when it drops below 50% of normal.
Document your entire setup in a shared document that includes: table schemas, data source configurations, query logic, export schedules, and troubleshooting steps. Six months from now when something breaks, you'll thank yourself for documenting how everything connects.
Create a maintenance checklist that runs monthly: verify data freshness across all sources, check for schema changes in connected platforms, review match rates for ad platform exports, audit for duplicate events, and validate attribution logic against recent customer journeys. Following best practices for tracking conversions accurately ensures your data remains reliable over time.
Making Attribution Work for Your Business
You now have a complete BigQuery conversion tracking system that captures every conversion, attributes it accurately across marketing touchpoints, and feeds clean data back to your ad platforms for better optimization. Your Google Ads and Meta campaigns now optimize toward real conversions instead of incomplete platform tracking.
The real power comes from iteration. As you run your attribution queries, you'll discover which touchpoints actually matter for your business. Maybe you'll find that Facebook drives awareness but Google converts. Maybe you'll see that email nurtures leads that paid search brings in. Use these insights to refine your queries, adjust your attribution models, and allocate budget toward the channels that drive real revenue.
Keep improving the data you send back to platform algorithms. The more accurate your conversion data, the better Google Ads and Meta can optimize bidding and targeting. Enhanced conversions and server-side tracking make a measurable difference in campaign performance because you're feeding the algorithms complete information instead of partial tracking data.
For marketers who want to skip the technical complexity while gaining even deeper attribution insights, Cometly offers a purpose-built solution that handles server-side tracking, multi-touch attribution, and conversion syncing automatically. It connects your ad platforms, CRM, and website to track the entire customer journey from first click to closed deal. Cometly captures every touchpoint—from ad clicks to CRM events—providing AI a complete, enriched view of every customer journey. You'll know what's really driving revenue beyond surface-level metrics, and AI recommendations identify high-performing ads and campaigns across every channel so you can scale with confidence. Plus, Cometly feeds enriched conversion data back to Meta, Google, and other platforms, improving targeting, optimization, and ad ROI without the technical overhead of maintaining a BigQuery setup yourself.
Your quick implementation checklist: BigQuery project created with billing enabled. Dataset configured with proper geographic location. Conversion schema designed with all attribution fields. Data sources connected including Google Ads, GA4, and CRM. Attribution queries built and saved as views. Conversion exports scheduled to ad platforms. Validation queries running to ensure data accuracy.
Start running your attribution queries today. Pull your campaign performance view and identify which campaigns are generating the highest ROAS. Look for channels with strong assisted conversion rates that might be undervalued in last-click attribution. Make your next budget decision based on complete conversion data instead of fragmented platform reports.
Ready to elevate your marketing game with precision and confidence? Discover how Cometly's AI-driven recommendations can transform your ad strategy—Get your free demo today and start capturing every touchpoint to maximize your conversions.