Most B2B SaaS marketing teams know their conversion rates but have no idea what actually happens between a prospect's first ad click and a closed-won deal. That gap is where revenue gets lost. Prospects fall through the cracks, budget flows toward channels that look productive on the surface, and sales teams work harder than they should because marketing never warmed the right buyers at the right time.
Building a customer journey map gives your team a shared, data-backed picture of every stage a buyer moves through, from initial awareness to becoming a paying customer. When done right, it reveals which touchpoints drive real pipeline, where prospects drop off, and which channels deserve more budget.
This guide walks you through a practical, step-by-step process for building a customer journey map that connects marketing activity to revenue outcomes. You will not just create a visual diagram to hang in a slide deck. You will build a living framework that your marketing, sales, and growth teams can act on.
Each step is designed for B2B SaaS companies that run paid ads, manage multi-touch funnels, and need accurate attribution data to make confident spending decisions. By the end, you will have a structured journey map, clear tracking requirements, and a plan for using attribution data to continuously improve every stage of the funnel.
Let's get into it.
Step 1: Define Your Buyer Segments and Their Goals
Before you map a single touchpoint, you need to know exactly who you are mapping for. A journey built around a specific buyer segment produces far more actionable insights than one that tries to represent every possible customer at once.
Start by identifying two to three core buyer personas your B2B SaaS product actually serves. Focus on three dimensions: role, company size, and primary pain point. A VP of Marketing at a 50-person SaaS company has a very different buying journey than a Director of Revenue Operations at a 500-person enterprise. Treating them the same produces a map that is useful to no one.
For each persona, document two things: what they are trying to accomplish when they enter the market, and what problem they are trying to solve before they have ever heard of your product. This distinction matters. Buyers do not start their journey looking for your solution. They start it feeling a pain or chasing a goal. Your map needs to reflect that reality.
Here is where many teams make their first mistake: they build personas from assumptions rather than data. Avoid this. Pull closed-won data from your CRM and look for patterns across your best customers. What industries do they come from? What company sizes? What job titles signed the contract? How long did the average deal cycle run? These patterns are your foundation.
Do the same with churned accounts. Understanding who did not succeed with your product is just as valuable as understanding who did. Churned accounts often reveal buyer segments that were never a strong fit, which helps you focus your journey map on the segments worth optimizing for. If you want to quantify this further, understanding how to calculate customer churn gives you a precise measure of which segments are underperforming.
Common pitfall: Skipping the CRM analysis and defaulting to assumed personas. Real closed-won and churned account data will almost always surface segments you did not expect and invalidate assumptions you were confident about.
Success indicator: You can clearly articulate who this journey map is for, what that person is trying to accomplish before they interact with your brand, and why that segment represents a meaningful portion of your revenue opportunity.
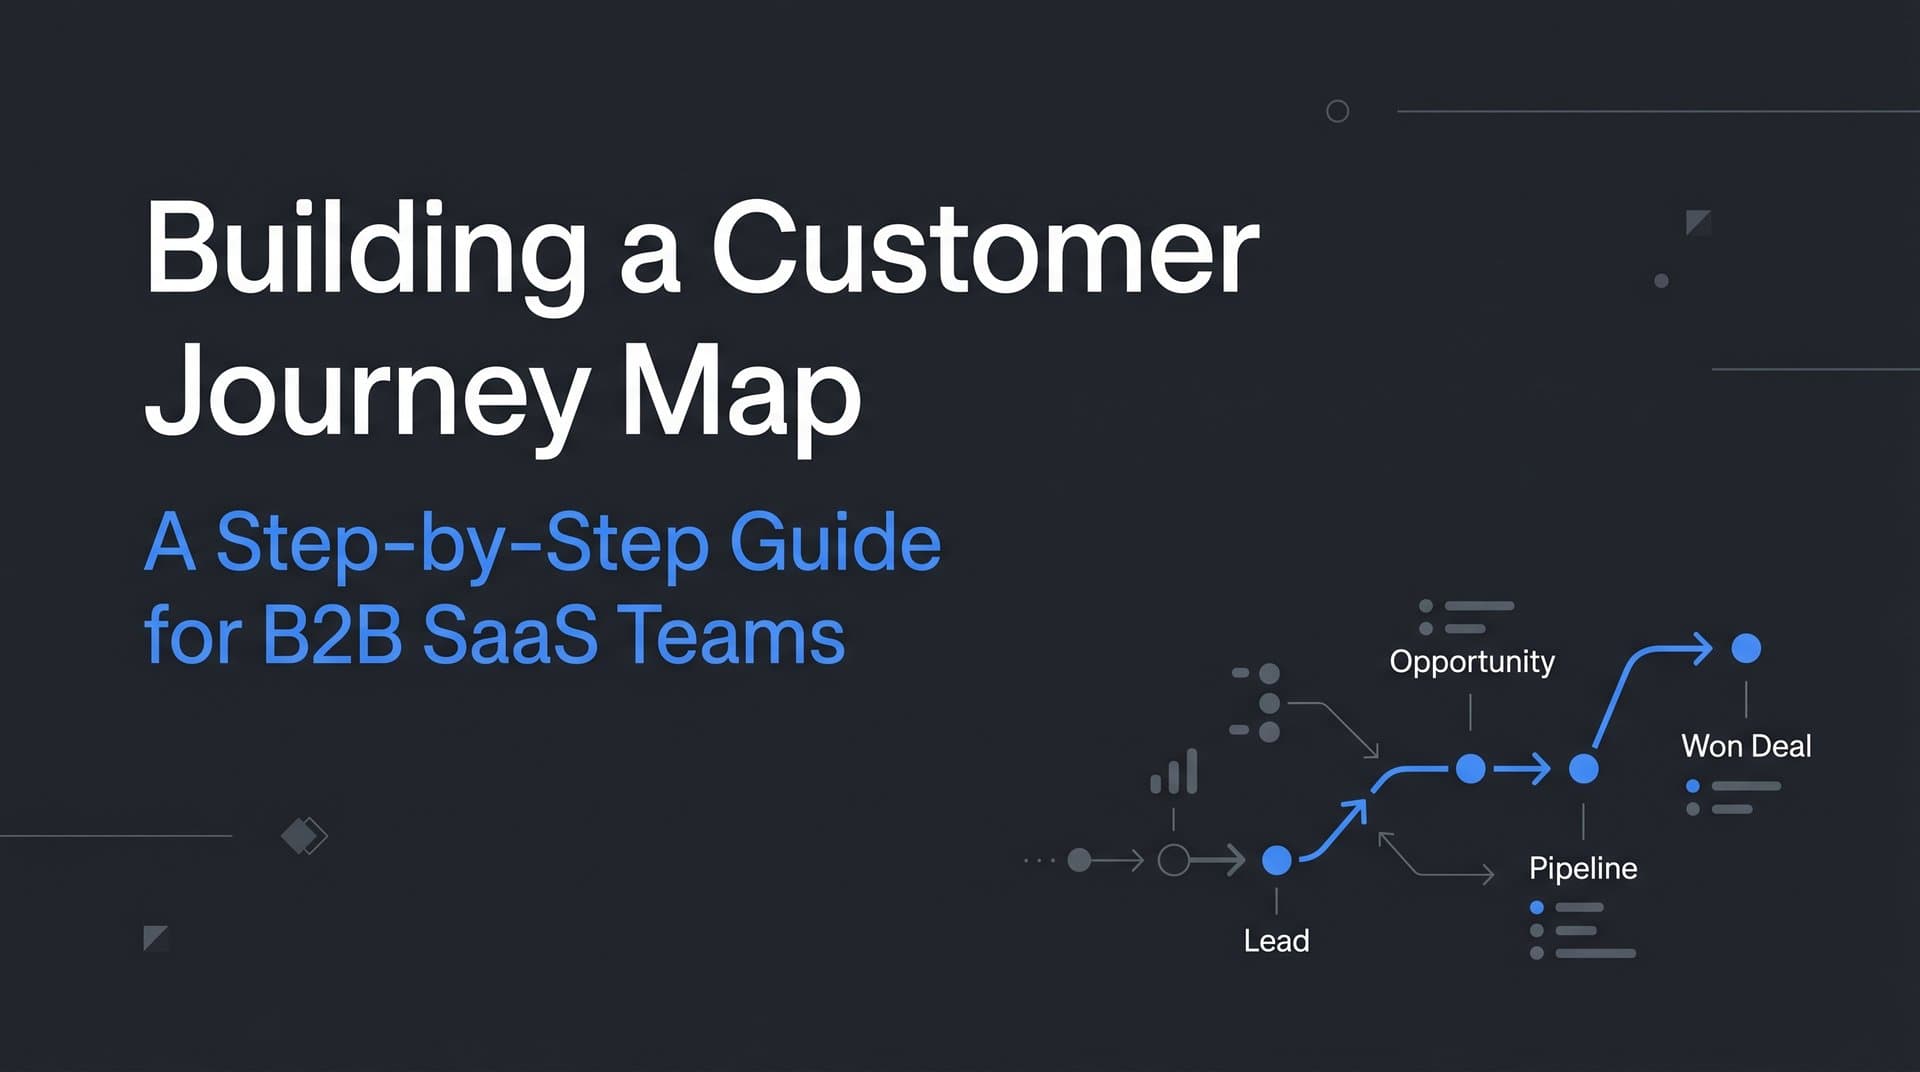
Step 2: Map the Stages from Awareness to Revenue
Once you know who you are mapping for, you can define the stages they move through. For most B2B SaaS companies, the core stages look something like this: Awareness, Consideration, Evaluation, Decision, and Post-Purchase. These names are a starting point, not a requirement. Adjust them to match your internal language so the map connects directly to how your team already talks about the funnel.
For each stage, document three things: what the buyer is thinking at that moment, what questions they are actively asking, and what action they need to take to move forward. This level of specificity is what separates a useful journey map from a generic diagram. A deeper look at the stages of the customer journey can help you calibrate exactly how to define each phase for your specific market.
Think of it this way. A buyer in the Awareness stage is not thinking about your product. They are thinking about a problem. They might be asking questions like "why is our pipeline shrinking?" or "how do other SaaS companies track which ads actually drive revenue?" Your job at this stage is to show up with content that meets that question, not to pitch your product.
A buyer in the Evaluation stage is actively comparing options. They are asking different questions: "How does this tool integrate with our CRM?" or "What does onboarding actually look like?" The touchpoints and messaging that work here are completely different from what works in Awareness.
Align each stage with your existing CRM pipeline stages. If your CRM uses "Marketing Qualified Lead," "Sales Qualified Lead," and "Opportunity," map those labels to the corresponding journey stages. This alignment is what allows your map to connect to real data rather than remaining a theoretical exercise.
Also keep in mind the difference between the buyer's journey and your marketing funnel. The buyer's journey is their experience. Your marketing funnel is your internal process. A good journey map bridges both perspectives, showing what the buyer is experiencing at each stage while also documenting what your team is doing to influence that experience.
Success indicator: Each stage has a clear entry trigger and a clear exit action that can be tracked with real data. If you cannot define how a buyer enters or exits a stage, that stage is not specific enough yet.
Step 3: Identify Every Touchpoint Across Channels
Now that your stages are defined, it is time to inventory every touchpoint that occurs within them. This is where the map starts to reveal real operational insight, because most teams discover they have far fewer mid-funnel touchpoints than they thought.
Start by listing every marketing and sales touchpoint that occurs at each stage: paid ads, organic content, email sequences, demo requests, sales calls, retargeting campaigns, free trial invitations, and more. Be exhaustive. If it touches a buyer, it belongs on the map. Understanding what customer journey touchpoints actually are — and how they function across different stages — helps ensure you are not overlooking critical interactions.
Group your touchpoints by channel type to create structure:
Paid channels: Google Ads, LinkedIn Ads, Meta campaigns, display retargeting, and sponsored content.
Organic channels: SEO-driven blog content, YouTube, podcast appearances, and community contributions.
Direct channels: Email nurture sequences, SDR outreach, and personalized follow-up from sales.
Product-led channels: Free trial experiences, freemium features, and in-product onboarding flows.
For each touchpoint, document its intended purpose. Is it designed to create awareness? Capture intent? Accelerate a decision that is already in progress? A touchpoint without a clear purpose is a touchpoint that is probably underperforming.
Next, look for gaps. Where are buyers commonly asking questions that your team has no touchpoint to answer? These gaps are conversion killers. A buyer who cannot find the information they need at a critical stage will not wait around. They will move to a competitor who has that answer ready.
For B2B SaaS teams running paid campaigns, this step often surfaces a familiar imbalance: heavy investment in top-of-funnel awareness ads with very little supporting content for buyers who are actively evaluating. The ads create interest, but there is nothing to sustain it.
Common pitfall: Only mapping touchpoints your team directly controls. Buyers also interact with third-party review sites like G2 and Capterra, peer referrals, LinkedIn communities, and industry forums. These touchpoints influence decisions even though your team does not own them. Document them so you can account for their influence in your attribution analysis.
Success indicator: You have a complete list of touchpoints organized by stage and channel, with no assumed gaps and a documented purpose for each one.
Step 4: Instrument Tracking Across Every Touchpoint
A journey map without tracking data is a hypothesis. This step is where you convert that hypothesis into a measurable system. Without it, you will never know which parts of your map are working and which are quietly costing you revenue.
Start by setting up conversion events for every key action in the journey: ad click, content download, demo request, trial signup, sales qualified lead, and closed-won. Each event should fire with consistent naming conventions across every platform. Inconsistent naming is one of the most common reasons attribution data becomes unreliable.
Browser-based pixel tracking has become increasingly unreliable. Ad blockers, browser privacy changes, and cookie restrictions mean that a meaningful portion of your conversion events may never be recorded if you rely solely on client-side tracking. The solution is server-side tracking combined with first-party data collection. Building a robust system to track every customer journey touchpoint is what separates teams that make confident budget decisions from those that are guessing.
Server-side tracking sends event data directly from your server to ad platforms, bypassing the browser entirely. This improves data accuracy and match quality, which matters significantly when you are trying to understand which touchpoints actually influenced a conversion.
For your paid channels specifically, implement the Meta Conversion API and Google's enhanced conversions. These tools send enriched, server-side event data back to the ad platforms, giving their algorithms better signals to optimize toward. When your ad platform has accurate conversion data, it can find more buyers who look like your best customers.
Connect your ad platforms, CRM, and website into a single attribution system so you can see which touchpoints influenced each conversion across the entire journey. This is exactly where a platform like Cometly becomes essential. Cometly connects ad spend data directly to pipeline and revenue, giving you a single source of truth that spans from the first ad click to closed-won, without requiring you to manually stitch data together from multiple disconnected tools.
Common pitfall: Tracking only the first and last touch while ignoring everything in between. Multi-touch attribution requires that every touchpoint fires a trackable event. If mid-funnel interactions are not tracked, they will never receive credit, and you will systematically underinvest in the channels that are actually doing the most work.
Success indicator: Every touchpoint in your map has a corresponding tracked event with data flowing into your attribution platform in real time. You can open your attribution dashboard and see activity at every stage of the journey, not just the top and bottom.
Step 5: Analyze Touchpoint Performance with Attribution Data
With tracking in place, you can move from mapping to measuring. This is where the journey map starts paying for itself, because attribution data reveals the truth about which touchpoints actually influence revenue and which ones just look productive on the surface.
Start by comparing attribution models side by side. Different models tell different stories, and each story contains useful information. Understanding customer journey analytics in depth will help you interpret what each model is actually telling you about buyer behavior.
First-touch attribution credits the channel that created initial awareness. It tells you what is bringing new buyers into your funnel. If a channel looks strong here but weak in other models, it is generating interest but not following through.
Last-touch attribution credits the final interaction before conversion. It tells you what is closing deals. If a channel only appears here, it may be capitalizing on demand created elsewhere rather than generating it.
Linear attribution distributes credit equally across all touchpoints. It gives you a balanced view of the full journey and often surfaces mid-funnel touchpoints that first-touch and last-touch models completely ignore.
Data-driven attribution uses algorithmic weighting based on actual conversion patterns. For B2B SaaS teams with sufficient data volume, this model typically produces the most accurate picture of channel influence.
Look for touchpoints with high volume but low conversion influence. These are candidates for budget reallocation. High volume means buyers are engaging. Low influence means that engagement is not translating into pipeline. Something is not working, and it is worth investigating before continuing to fund it.
Also look for the inverse: touchpoints that consistently appear in the journeys of your highest-value customers but have modest raw conversion numbers. These are often undervalued mid-funnel assets that deserve more investment. Pairing this analysis with SaaS revenue attribution data gives you a clearer picture of which channels are genuinely generating revenue versus simply appearing in the path.
Use pipeline velocity data alongside your attribution analysis. Pipeline velocity measures how quickly deals move through each stage. When you map velocity against your journey stages, you can see exactly where buyers are stalling and whether a specific touchpoint is accelerating or slowing progress.
Cometly's AI-powered analysis surfaces which ads and campaigns are driving actual pipeline and revenue, not just clicks and impressions. This distinction matters enormously when you are making budget decisions.
Success indicator: You can identify at least two touchpoints to optimize or reallocate budget based on what the attribution data is telling you, with a clear rationale grounded in conversion influence rather than gut instinct.
Step 6: Close Gaps and Optimize the Journey
Analysis without action is just observation. This step is where your journey map produces tangible business results. Use your attribution analysis to prioritize which gaps to close first, focusing on the stages where drop-off is highest and the potential revenue impact is greatest.
For most B2B SaaS teams, the highest-impact gaps live in the middle of the funnel. Buyers who have entered the Consideration or Evaluation stage are already interested. They just need the right content to move forward. This is where comparison content, ROI calculators, detailed integration documentation, and customer social proof do their best work. A structured approach to customer journey optimization gives you a repeatable framework for closing these gaps systematically rather than reactively.
Adjust your ad targeting and retargeting sequences to match where buyers are in the journey. A top-of-funnel awareness ad should not look anything like a retargeting ad served to someone who has already requested a demo. Buyers at different stages have different questions and different levels of intent. Your creative and messaging need to reflect that.
Feed enriched conversion data back to your ad platforms so their optimization algorithms are working toward high-value outcomes. When you send accurate, enriched conversion events through the Conversion API, the platform's algorithm learns what a real customer looks like and finds more of them. This is one of the highest-leverage optimizations available to B2B SaaS marketing teams running paid campaigns.
Set a regular review cadence for the journey map itself. Monthly reviews work well for teams in high-growth phases where buyer behavior is shifting quickly. Quarterly reviews are appropriate for more established products with stable market positioning. The key is that the map gets updated with fresh attribution data rather than sitting static as a one-time deliverable.
Common pitfall: Trying to optimize every stage simultaneously. This spreads your team's attention too thin and makes it difficult to measure the impact of any single change. Pick the highest-impact gap, run a focused experiment, measure the result, and then move to the next priority.
Success indicator: After one optimization cycle, you see measurable improvement in either the conversion rate or the pipeline velocity of the stage you targeted. Even a modest improvement in a high-volume stage can produce meaningful revenue impact over time.
Putting It All Together
Building a customer journey map is not a one-time project. It is an ongoing practice that gets sharper as your attribution data matures and your understanding of your buyers deepens.
Here is a quick-reference checklist to audit where you stand today:
Step 1: Buyer Segments Have you defined two to three specific segments based on real CRM data, not assumptions?
Step 2: Journey Stages Does each stage have a clear entry trigger, exit action, and alignment with your CRM pipeline?
Step 3: Touchpoint Inventory Have you mapped every touchpoint by stage and channel, including third-party review sites and referral channels?
Step 4: Tracking Infrastructure Is every touchpoint firing a tracked event with server-side tracking and Conversion API integration in place?
Step 5: Attribution Analysis Are you comparing multiple attribution models and using pipeline velocity to identify where buyers stall?
Step 6: Optimization Cycle Have you identified your highest-impact gap and run at least one focused experiment to close it?
The teams that get the most value from this process are the ones that treat the journey map as a living document, updated regularly with fresh attribution data as their product, market, and buyer behavior evolve.
Cometly is the attribution layer that keeps your journey map connected to real revenue data. It captures every touchpoint from the first ad click to closed-won, connects your ad platforms and CRM into a single source of truth, and uses AI to surface which campaigns are actually driving pipeline. That means your journey map is always grounded in what is actually happening, not what you assume is happening.
Start with Step 1 today. Define your segments, pull your CRM data, and build from there. You do not need a perfect setup to begin. You need a starting point and a commitment to improving it over time.
Ready to connect every stage of your customer journey to real revenue data? Get your free demo and see how Cometly helps B2B SaaS teams track, analyze, and optimize every touchpoint from first impression to closed-won deal.