For B2B SaaS marketing teams, choosing the wrong attribution model is not just an analytics problem. It is a budget problem. When you misread which channels and campaigns are actually driving pipeline and revenue, you scale the wrong things and cut what is actually working.
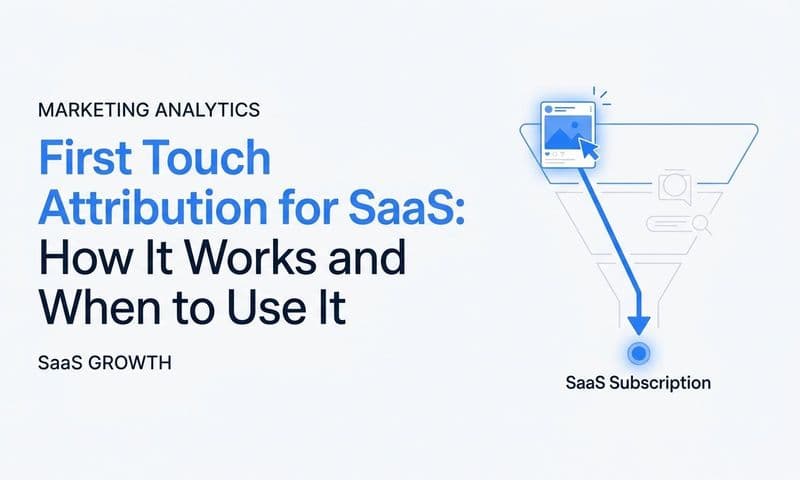
The challenge is that no single attribution model tells the complete story. First-touch credits the channel that started the conversation. Last-click rewards whoever closed it. Multi-touch models spread credit across the journey. Each tells a different version of the truth.
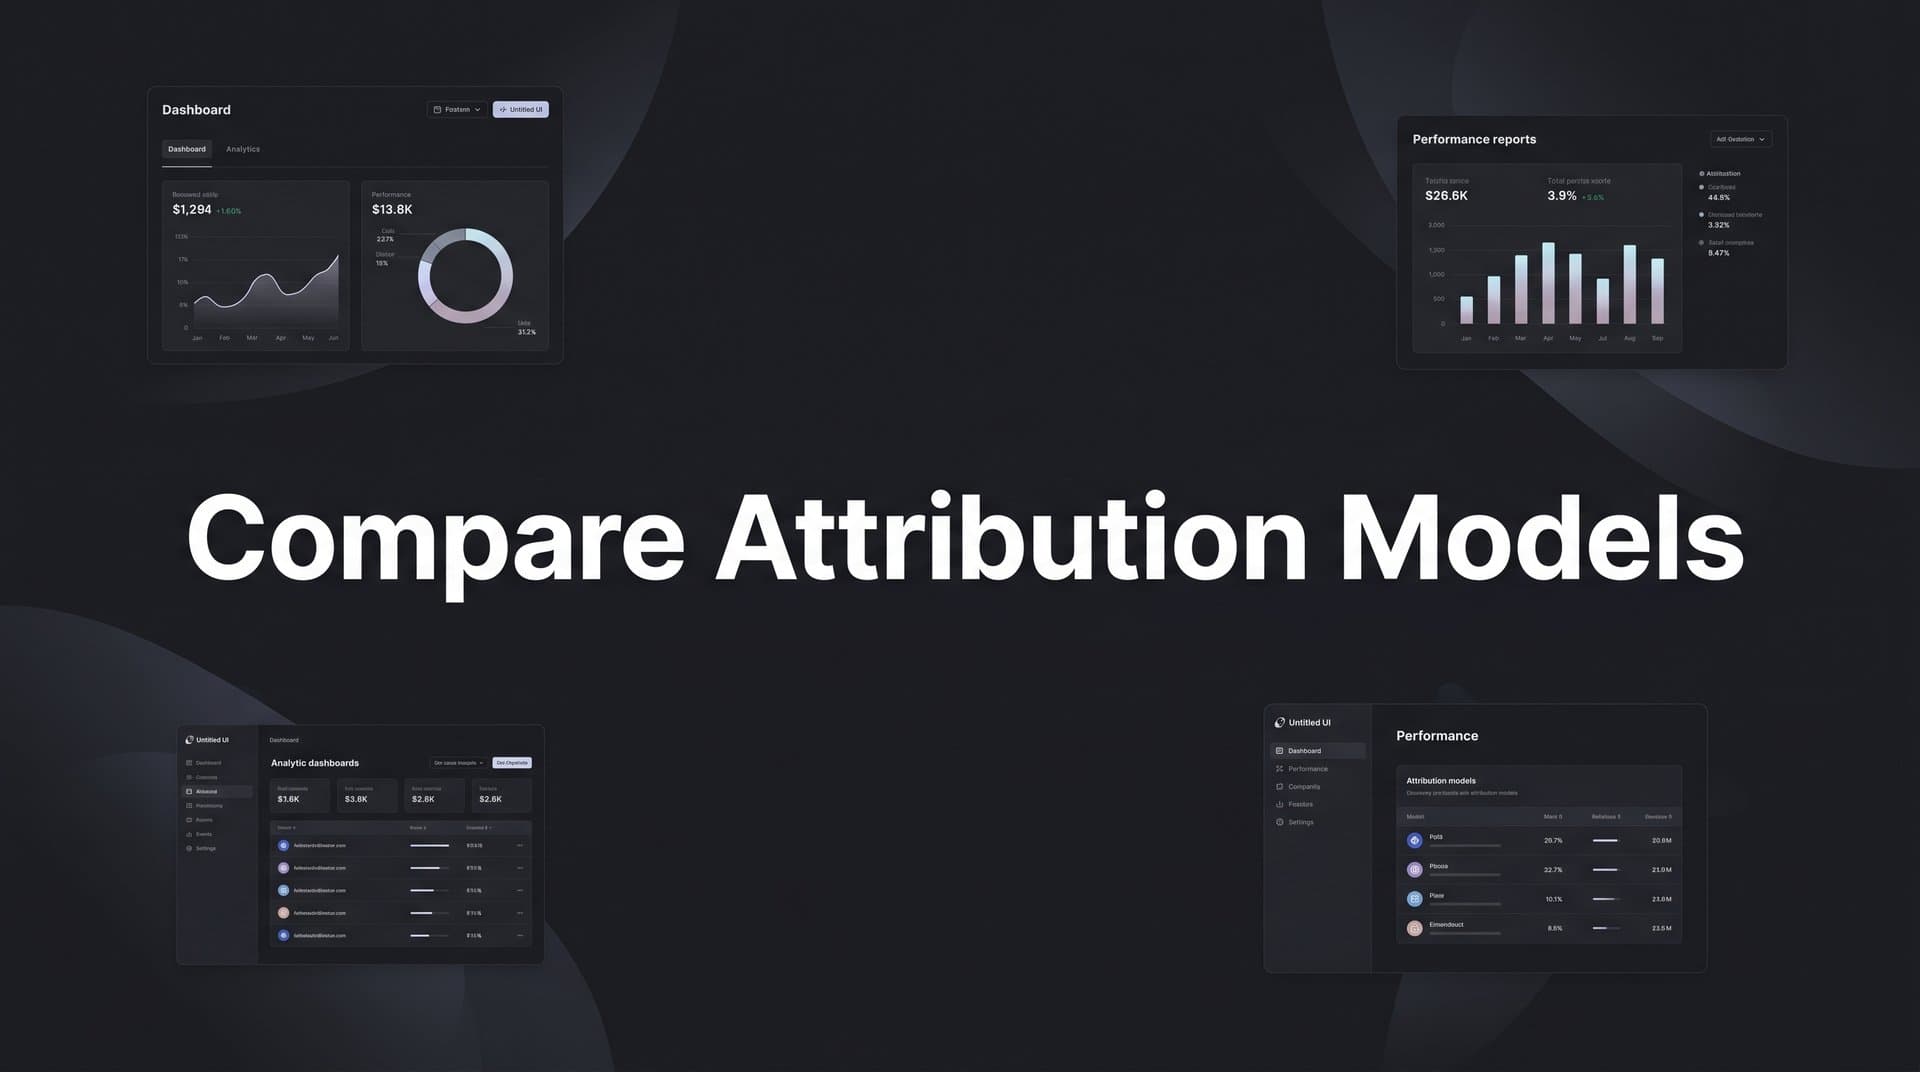
So how do you know which model to trust? The answer is not to pick one and stick with it blindly. The smarter approach is to actively compare attribution models side by side, understand what each one reveals, and use that layered perspective to make confident, data-backed decisions.
This article walks through seven proven strategies to compare attribution models effectively. Whether you are running paid search, social ads, content, or outbound, these strategies will help you understand where credit belongs, how to evaluate model performance against real revenue data, and how to build a measurement framework that scales with your growth.
By the end, you will have a clear system for choosing the right attribution model for the right decision at the right time.
1. Start With a Clear Conversion Event Before Picking Any Model
The Challenge It Solves
Most attribution model comparisons fail before they even begin. Teams pull reports from different models without first agreeing on what conversion they are actually measuring. When the conversion event is undefined or inconsistent, the model outputs are not just different. They are incomparable. You end up debating which model is "right" when the real problem is that each model is measuring something slightly different.
The Strategy Explained
Before you compare any attribution models, lock in a single, standardized conversion event that reflects meaningful business progress. In B2B SaaS, this could be a demo request, a free trial start, an MQL, an SQL, an opportunity created, or a closed-won deal. Each of these events sits at a different stage of the funnel and will produce dramatically different model outputs.
The key is consistency. If your team is comparing first-touch and multi-touch attribution but one report is measuring demo requests and another is measuring closed-won revenue, you are not comparing models. You are comparing different business questions. Standardize the event first, then let the models compete on equal footing.
For most B2B SaaS teams, closed-won revenue or opportunity created are the most meaningful conversion events for strategic attribution decisions, since they tie directly to pipeline and revenue rather than top-of-funnel activity.
Implementation Steps
1. Align your marketing and revenue teams on a primary conversion event for attribution reporting. Document this definition and share it across all stakeholders.
2. Audit your current attribution reports to confirm every model is pulling data against the same event. Fix any inconsistencies before drawing conclusions.
3. Consider running secondary comparisons using a different conversion event (for example, demo request alongside closed-won) to understand how model outputs shift across funnel stages.
Pro Tips
If you are just starting out, use opportunity created as your primary event. It is close enough to revenue to be meaningful, and it typically has higher volume than closed-won, which gives your models more data to work with. As your data matures, shift your primary benchmark to closed-won revenue for the most accurate picture of what is actually driving growth. Understanding the importance of attribution models in marketing will help you frame these decisions with the right strategic context.
2. Run First-Touch and Last-Touch Models in Parallel to Find the Gaps
The Challenge It Solves
Teams often default to a single attribution model because it is easier to manage one report than two. But relying on either first-touch or last-touch alone creates a blind spot. First-touch tells you what started the conversation but ignores everything that helped close it. Last-touch tells you what closed the deal but erases the channels that built awareness and intent earlier in the journey. Neither model alone gives you an accurate picture of channel contribution.
The Strategy Explained
Running first-touch and last-touch models simultaneously is one of the fastest ways to surface meaningful budget insights. The gaps between the two reports reveal where your channels are playing very different roles in the customer journey. For a deeper look at how these models differ from more advanced approaches, the guide on single source attribution versus multi-touch attribution models is worth reviewing before drawing conclusions.
Think of it this way: if paid social receives significant credit under first-touch but almost none under last-touch, that channel is doing strong awareness work but is rarely the final push before conversion. Conversely, branded paid search often over-indexes under last-touch because it captures high-intent users who are already in evaluation mode. It is not creating demand. It is capturing it.
Understanding these gaps helps you make smarter budget decisions. You stop penalizing channels that drive awareness just because they do not close deals, and you stop over-investing in closing channels at the expense of the top of funnel that feeds them.
Implementation Steps
1. Pull first-touch and last-touch attribution reports for the same time period, using the same conversion event. Place them side by side in a shared dashboard or spreadsheet.
2. Identify channels where the credit gap between the two models is largest. These are your most interesting signals.
3. Categorize channels by their primary role: awareness drivers (high first-touch, low last-touch), closing channels (low first-touch, high last-touch), or balanced contributors (roughly equal across both).
Pro Tips
Pay special attention to retargeting campaigns. They almost always over-index under last-touch because they are designed to reach people who are already in your funnel. If you only use last-touch attribution, retargeting looks like a top performer. When you add first-touch into the comparison, you often see that it rarely initiates a journey, which reframes its true value in your media mix.
3. Use Multi-Touch Attribution to Understand the Full Customer Journey
The Challenge It Solves
B2B SaaS deals rarely happen because of a single interaction. A prospect might discover your brand through a LinkedIn ad, read three blog posts over two weeks, attend a webinar, and then convert after clicking a Google search ad. First-touch and last-touch models each capture one end of that journey and miss everything in between. For teams with long sales cycles and multiple stakeholder touchpoints, this is a significant measurement gap.
The Strategy Explained
Multi-touch attribution models distribute credit across all touchpoints in the customer journey, giving you a more complete view of how channels work together. The three most common multi-touch attribution models each have a distinct logic:
Linear attribution assigns equal credit to every touchpoint. It is the simplest multi-touch model and works well when you want a baseline view of all contributing channels without making assumptions about which touchpoints matter most.
Time-decay attribution gives more credit to touchpoints that occur closer to conversion. This model reflects the reality that recent interactions often have more influence on the final decision, making it useful for teams with shorter evaluation cycles or high-intent conversion paths.
Position-based (U-shaped) attribution assigns heavy credit to the first and last touchpoints, with the remainder distributed across the middle. This model is popular in B2B SaaS because it acknowledges that both the initial discovery moment and the final conversion trigger are especially significant.
Comparing these three models against each other, and against your first-touch and last-touch outputs, gives you a layered view of channel contribution that no single model can provide. If you want to go deeper on how to apply linear attribution specifically, the guide on how to use the linear attribution model covers practical implementation steps.
Implementation Steps
1. Enable linear, time-decay, and position-based attribution reports in your attribution platform. Run them against your standardized conversion event for the same time period.
2. Identify which channels gain or lose credit as you move from linear to time-decay to position-based. Channels that consistently rank highly across all three models are your most reliable contributors.
3. Use the model that best aligns with your current business priority. If you are evaluating awareness investment, position-based or linear is often more useful. If you are optimizing for conversion efficiency, time-decay may be more relevant.
Pro Tips
Do not try to find the "best" multi-touch model and then abandon the others. Each model is a lens, not a verdict. The most valuable insight often comes from the differences between models, not from any single model output. Use them together to build a fuller picture of how your channels are actually contributing to pipeline.
4. Benchmark Model Outputs Against Actual Revenue Data
The Challenge It Solves
Attribution models are built on tracking data, and tracking data is imperfect. Browser limitations, ad blockers, cross-device journeys, and gaps in CRM integration can all introduce noise into your model outputs. If you make budget decisions based purely on attribution model outputs without ever validating them against real revenue data, you risk optimizing toward a model that reflects your tracking gaps rather than your actual performance.
The Strategy Explained
The most grounded way to evaluate any attribution model is to compare its outputs against your CRM's closed-won data. If an attribution model is crediting a particular channel heavily but that channel is producing few closed-won deals in your CRM, that is a signal of model misalignment, not channel performance. Understanding how to evaluate attribution models against real business outcomes is what separates teams that optimize effectively from those that chase misleading signals.
This is where connecting your ad spend data with your CRM and revenue data becomes critical. Platforms like Cometly are built specifically to bridge this gap, linking ad platform data with CRM events and Stripe revenue so you can see which channels are actually generating closed-won pipeline, not just which channels your attribution model is rewarding.
Pipeline velocity is a useful secondary validation signal. If a channel is generating a high volume of attributed opportunities but those opportunities take significantly longer to close or have lower win rates, the channel's true contribution may be lower than the model suggests. Revenue per attributed touchpoint is a more honest metric than touchpoint volume alone.
Implementation Steps
1. Export your attribution model outputs by channel for a defined time period. Then pull closed-won revenue by channel from your CRM for the same period.
2. Compare the two datasets. Identify channels where attribution credit and actual closed-won revenue are significantly misaligned in either direction.
3. Investigate the gaps. Over-credited channels may have tracking advantages (like capturing last-touch on branded searches). Under-credited channels may be contributing to pipeline in ways your tracking is not fully capturing.
Pro Tips
Make this validation a monthly habit, not a one-time audit. Attribution model accuracy can drift as your channel mix evolves, your sales cycle changes, or your tracking setup is modified. Regular benchmarking keeps your models honest and your budget decisions grounded in real outcomes.
5. Segment Your Model Comparisons by Channel, Campaign Type, and Funnel Stage
The Challenge It Solves
Aggregate attribution comparisons are useful for a high-level view, but they hide the channel-level dynamics that actually drive budget decisions. When you look at total attributed revenue across all channels under a single model, you lose the nuance of how different channels behave differently under different models. A channel that looks average in aggregate may be exceptional at a specific funnel stage or campaign type.
The Strategy Explained
Segmenting your attribution model comparisons is how you move from directional insights to actionable decisions. The goal is to understand not just which model is "best" overall, but which model is most accurate for each channel and each type of decision you are making.
Here is a practical way to think about segmentation:
By channel: Paid search, paid social, organic, email, and direct each behave differently under different models. Paid search tends to over-index under last-touch. Content and social tend to over-index under first-touch. Segmenting by channel helps you identify these biases and correct for them when interpreting results. Teams running B2B SaaS campaigns will find the breakdown of marketing attribution tools for B2B SaaS companies useful for understanding which platforms support this level of channel-level segmentation.
By campaign type: Awareness campaigns, retargeting campaigns, and conversion campaigns serve different functions in your funnel. Comparing attribution model outputs within each campaign type reveals whether your investment in each stage is producing the right downstream outcomes.
By funnel stage: Top-of-funnel channels often look weak under last-touch models and strong under first-touch models. Bottom-of-funnel channels show the reverse. Understanding this dynamic prevents you from cutting effective awareness channels just because they do not close deals directly.
Implementation Steps
1. Build segmented attribution views in your analytics platform. Start with channel-level segmentation, then layer in campaign type and funnel stage as your reporting matures.
2. For each segment, run at least two attribution models side by side. Note where the outputs diverge most significantly.
3. Document which model you use for which type of decision. For example, use first-touch to evaluate awareness channel investment and last-touch to optimize conversion campaigns.
Pro Tips
If you are using Cometly, take advantage of its customer journey analytics to drill into individual touchpoint sequences by channel and campaign. Seeing the actual paths that converted customers took gives you qualitative context that aggregate model comparisons cannot provide, and it often reveals patterns that change how you interpret your model outputs entirely.
6. Use Data-Driven Attribution to Let Conversion Patterns Guide Credit Allocation
The Challenge It Solves
Every rule-based attribution model, whether first-touch, last-touch, or position-based, reflects a human assumption about how credit should be distributed. Those assumptions are often reasonable, but they are still assumptions. They do not adapt to the actual conversion patterns in your data. As your channel mix grows more complex and your conversion paths become more varied, rule-based models can introduce systematic biases that compound over time.
The Strategy Explained
Data-driven attribution takes a different approach. Instead of applying a fixed rule about credit allocation, it analyzes your actual conversion path data to determine which touchpoints are statistically associated with higher conversion rates. Channels and interactions that appear more frequently in successful conversion paths receive more credit. Those that appear in non-converting paths receive less. For a thorough breakdown of how this works in practice, the guide on data-driven attribution covers the mechanics and when to apply it.
This removes human bias from the model selection process. You are no longer deciding that the first touch deserves 40% credit or that the last touch deserves 100%. The model learns from your data and allocates credit accordingly.
However, data-driven attribution requires a meaningful volume of conversion events to function accurately. Teams with lower conversion volumes may find that rule-based multi-touch models are more reliable because data-driven models need sufficient signal to surface meaningful patterns. As your conversion volume grows, data-driven attribution becomes increasingly valuable.
The quality of the data feeding these models also matters enormously. Server-side tracking through Conversion API integrations (Meta's Conversions API, Google's Enhanced Conversions) reduces data loss from browser-based tracking limitations and improves the accuracy of the conversion signals your models are learning from. Better input data produces better model outputs.
Implementation Steps
1. Evaluate whether your current conversion volume is sufficient for data-driven attribution. Most platforms require a minimum number of conversion events per month before data-driven models produce reliable outputs.
2. Audit your tracking setup to ensure you are using server-side tracking wherever possible. Gaps in conversion data directly reduce the quality of data-driven attribution outputs. A solid attribution tracking setup is the foundation that makes data-driven models reliable.
3. Once enabled, compare data-driven attribution outputs against your existing rule-based models. Look for channels that gain or lose significant credit. These shifts often reveal where your rule-based assumptions were introducing bias.
Pro Tips
Do not discard your rule-based models when you adopt data-driven attribution. Use them as a sanity check. If data-driven attribution produces outputs that diverge significantly from your rule-based models, investigate why before acting on the difference. Sometimes the data-driven model is surfacing a genuine insight. Other times it is reflecting a tracking gap or a data quality issue that needs to be resolved first.
7. Build a Model Comparison Workflow Your Whole Team Can Use
The Challenge It Solves
Attribution model comparisons are most valuable when they are systematic and shared. When attribution analysis lives in a single analyst's spreadsheet or is only revisited during quarterly reviews, the insights it produces are too slow and too siloed to drive real budget decisions. Teams end up making channel investments based on intuition or platform-reported metrics rather than validated attribution data.
The Strategy Explained
Building a repeatable attribution review workflow transforms model comparison from a one-off analysis into an ongoing operational practice. The goal is to make it easy for your entire marketing team, not just data specialists, to access, interpret, and act on attribution insights consistently.
This means three things: a regular review cadence, documented model selection criteria, and a centralized attribution platform that serves as the single source of truth for your marketing data.
A regular cadence keeps your team honest. Monthly attribution reviews catch model drift before it compounds into bad budget decisions. Quarterly deep-dives allow you to evaluate whether your model selection criteria still fit your current business stage and channel mix.
Documented model selection criteria prevent the same debates from happening every time. When your team agrees in advance that first-touch is used for awareness channel evaluation and last-touch is used for conversion campaign optimization, you eliminate the friction of relitigating model philosophy every time someone pulls a report. Teams building this kind of structure for the first time will find the overview of multi-touch attribution for teams a useful starting point for aligning stakeholders around shared model definitions.
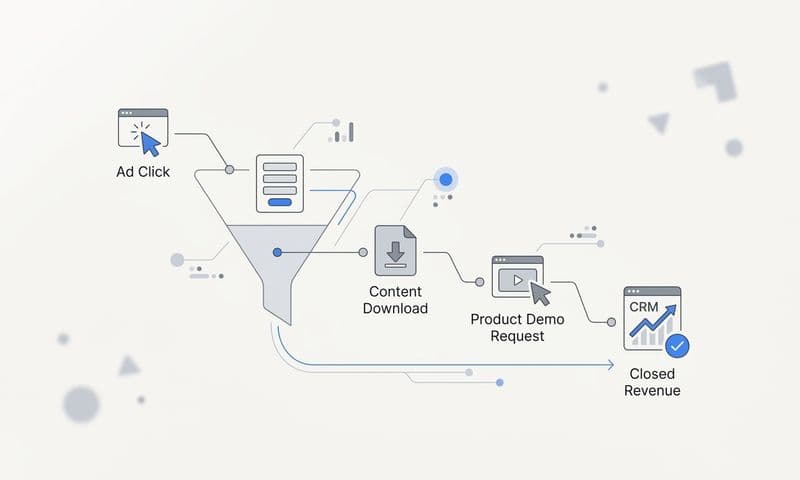
A centralized attribution platform removes the data fragmentation that makes model comparison difficult. When your ad platform data, CRM data, and website event data all live in separate tools, comparing attribution models requires manual data stitching that introduces errors and delays. A platform like Cometly connects all of these data sources into a single view, so your team can compare attribution models, track the full customer journey from first ad click to closed-won revenue, and act on insights without waiting for a data team to pull a custom report.
Implementation Steps
1. Establish a monthly attribution review meeting with a fixed agenda: review model outputs by channel, compare against CRM closed-won data, and flag any significant changes in channel performance across models.
2. Document your model selection criteria in a shared reference guide. Specify which model is used for which type of decision and why. Update this guide whenever your channel mix or business goals change significantly.
3. Centralize your attribution data in a single platform that connects your ad platforms, CRM, and website tracking. Eliminate manual data stitching from your workflow wherever possible.
Pro Tips
Assign a clear owner for your attribution workflow. This does not need to be a dedicated analyst. It can be a growth marketer or marketing operations lead who is responsible for maintaining the review cadence, keeping the model selection criteria current, and escalating significant attribution changes to the broader team. Without a clear owner, attribution reviews tend to slip during busy periods, which is exactly when accurate data matters most.
Putting It All Together
Comparing attribution models is not a one-time exercise. It is an ongoing practice that helps your team stay honest about what is actually driving growth. The most effective B2B SaaS marketing teams do not rely on a single model. They use multiple models as lenses, each revealing a different layer of the customer journey, and they validate those insights against real pipeline and revenue data.
Start with a clearly defined conversion event. Run first-touch and last-touch models side by side to spot the gaps. Layer in multi-touch attribution to understand the full journey. Then benchmark everything against your CRM and closed-won data to keep your models grounded in reality.
As your data volume grows, data-driven attribution can take over the heavy lifting, especially when you are feeding enriched first-party data back to ad platforms through server-side tracking. Segment your comparisons by channel and funnel stage to catch the biases that aggregate reports hide. And build a workflow that makes attribution comparison a shared, repeatable practice rather than a siloed analysis.
Each of these strategies builds on the others. A clear conversion event makes your model comparisons meaningful. Running multiple models in parallel reveals gaps that single-model reporting misses. Validating against revenue data keeps your insights grounded. And a systematic workflow ensures that the insights you generate actually reach the decisions that matter.
Cometly is built for exactly this kind of work. It connects your ad platforms, CRM, and website into a single source of truth, so you can compare attribution models, track every touchpoint from first ad click to closed-won revenue, and make confident budget decisions backed by accurate data. If your team is ready to move beyond guesswork and build a real attribution practice, Get your free demo today and start capturing every touchpoint to maximize your conversions.