

You're running paid search, LinkedIn ads, content campaigns, and outbound sequences simultaneously. Leads are coming in. Some deals are closing. But when someone asks which channels are actually driving revenue, the honest answer is: you're not entirely sure. Your last-click data points to one story. Your gut says another. And somewhere in between, budget decisions are being made on incomplete information.
This is the reality for most B2B SaaS marketing teams. The buying journey is genuinely complex. Prospects discover you through a LinkedIn ad, read three blog posts over two weeks, attend a webinar, click a retargeting ad, and then finally book a demo through branded search. Which channel gets the credit? In most reporting setups, branded search wins. Every other touchpoint disappears from the record.
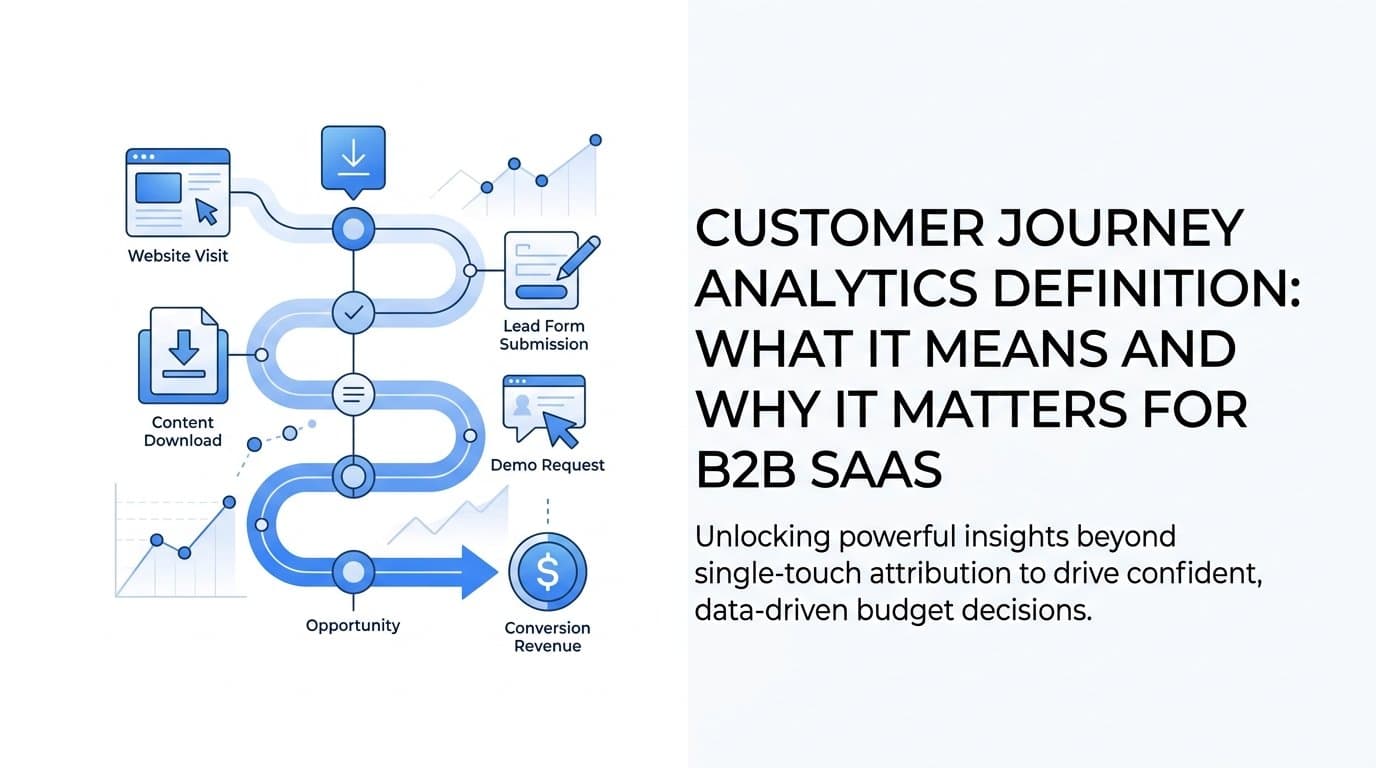
Customer journey analytics is the framework built to solve exactly this problem. It moves marketing teams beyond aggregate funnel metrics and single-touch attribution into a complete, sequential view of how prospects actually move from first interaction to closed revenue. Not just what happened, but in what order, across which channels, over how much time, and with what result.
This article is a practical explainer. It covers the customer journey analytics definition in full, distinguishes it from traditional funnel reporting, breaks down the data and technology that make it work, and shows how B2B SaaS teams can apply it to make genuinely better decisions. If you've been operating with partial visibility into your marketing performance, what follows will reframe how you think about measurement entirely.
Beyond the Funnel: What Customer Journey Analytics Actually Means
The textbook customer journey analytics definition is straightforward: it is the practice of collecting, mapping, and analyzing every interaction a prospect has with your brand across all channels and touchpoints, from initial awareness through to closed revenue. But that definition only becomes meaningful when you understand what it replaces.
Traditional funnel analytics measures aggregate conversion rates between predefined stages. You know that a certain percentage of visitors become leads, a certain percentage of leads become opportunities, and a certain percentage of opportunities close. These numbers are useful for identifying where volume is dropping off. They are not useful for understanding why.
Funnel analytics loses the individual path. It cannot tell you that prospects who engage with your content before clicking a paid ad close at a higher rate than those who click the ad first. It cannot show you that a specific channel combination consistently appears in your best customer journeys. It treats every lead as equivalent and every path as invisible.
Customer journey analytics preserves what funnel analytics discards: the sequence, timing, and channel context of every individual prospect's behavior. This is what makes it a fundamentally different discipline.
There are three core components that make journey analytics function properly.
Touchpoint data collection: Every interaction a prospect has with your brand needs to be captured as a discrete event. Ad clicks, page visits, form submissions, email opens, webinar registrations, sales calls, and CRM stage changes all represent touchpoints. The richer and more complete this event data, the more accurate the analysis becomes.
Identity resolution: This is the technical challenge at the heart of journey analytics. A prospect's first interaction with your brand is almost always anonymous. They click an ad, browse your site, and leave without identifying themselves. When they return later and fill out a form, you now have a name and email. Identity resolution is the process of stitching those anonymous early interactions to the known identity created at form submission, and then connecting that known identity to downstream CRM and revenue records. Without this stitching, you have fragmented data that cannot be assembled into a coherent path.
Behavioral sequencing: Once touchpoints are collected and identities are resolved, journey analytics organizes interactions into ordered sequences. This reveals the timing between touchpoints, the channels involved at each stage, and the patterns that distinguish converting paths from non-converting ones. It is the difference between knowing that a prospect visited your pricing page and knowing that they visited your pricing page after engaging with a competitor comparison article, three days after clicking a LinkedIn ad, which itself came after an organic search visit two weeks prior.
This level of visibility changes the questions marketing teams can ask and the decisions they can make. It shifts measurement from "how many leads did this channel generate" to "which channel combinations, in which sequences, produce the customers we actually want."
The Data That Powers Customer Journey Analytics
Journey analytics is only as good as the data feeding it. Understanding the three primary data sources, and how they connect, is essential for building a reliable system.
Ad platform events: Clicks, impressions, video views, and engagement events from paid channels like Google Ads, Meta, and LinkedIn represent the top of most B2B buying journeys. These events carry critical context: which campaign, which ad creative, which audience segment, and which keyword triggered the interaction. Capturing this data with proper UTM parameters and click IDs creates the starting point for individual journey tracking.
Website behavioral data: Page visits, session depth, time on site, form fills, and content downloads tell you what a prospect did after they arrived. This behavioral layer reveals intent signals that ad platform data alone cannot provide. A prospect who visits your pricing page twice, reads your integration documentation, and downloads a comparison guide is signaling something very different from one who bounces after the homepage.
CRM and revenue data: Pipeline stages, deal values, opportunity creation dates, and closed-won records are where marketing activity connects to business outcomes. This is the data that transforms journey analytics from a marketing exercise into a revenue conversation. When you can link a specific ad click to a named opportunity in your CRM and then to a closed deal in your revenue system, you have closed the loop between spend and return.
First-party data is the foundation that holds all of this together. Collected directly from your own properties and systems, first-party data is not subject to the degradation that has made third-party tracking increasingly unreliable. As browser cookie restrictions tighten and ad blockers become more common, client-side pixel tracking misses a growing share of events. A user who has an ad blocker enabled, or who browses in a privacy-focused mode, may never register on your standard analytics platform at all.
Server-side tracking addresses this directly. Rather than relying on a JavaScript pixel firing in the user's browser, server-side tracking captures events at the server level before they can be blocked or dropped. This preserves data quality across the full range of user behaviors and device configurations, which is particularly important in B2B contexts where sophisticated buyers are more likely to use privacy tools.
Conversion API integrations extend this further by sending enriched, server-side event data back to ad platforms like Meta and Google. This improves the ad platform's ability to optimize campaigns because it receives more complete signal data, not just the fraction that browser-based pixels manage to capture.
Identity stitching is where these data sources merge into a coherent journey. In practice, it works like this: an anonymous user clicks a LinkedIn ad, and a click ID is stored. They visit your site, and their session is recorded against that click ID. They fill out a demo request form, and their email address becomes the anchor identity. Your system then associates all previous anonymous activity with that email. When your CRM creates an opportunity and eventually marks it closed-won, that revenue event links back through the chain to the original ad click. The full journey, from first touch to closed deal, is now visible as a single connected record.
How Attribution Models Fit Into Journey Analytics
Attribution models are frequently confused with journey analytics itself. They are not the same thing, and understanding the distinction matters for how you interpret your data.
Journey analytics is the collection and organization of complete path data. Attribution models are the interpretive lens applied to that data to assign credit for conversions. Without complete journey data, no attribution model produces accurate results. Attribution models are downstream of journey data, not a substitute for it.
The most common models each tell a different version of the same story.
First-touch attribution: Assigns 100% of conversion credit to the first interaction in the journey. This approach values awareness and discovery channels but ignores everything that happened afterward. It tends to overvalue top-of-funnel paid channels and organic search while making mid-funnel nurture invisible.
Last-click attribution: Assigns all credit to the final touchpoint before conversion. This is the default in most ad platforms and analytics tools. It systematically undervalues every channel that contributed earlier in the journey, which in B2B SaaS typically means it undervalues content, social, and upper-funnel paid campaigns while overvaluing branded search and direct traffic.
Linear attribution: Distributes credit equally across all touchpoints in the journey. This is more representative than single-touch models but treats a casual homepage visit as equivalent to a pricing page visit or a product demo, which is rarely accurate.
Data-driven attribution: Uses statistical modeling to assign credit based on the actual contribution of each touchpoint to conversion probability. This is the most accurate model when sufficient data exists to train it, but it requires volume and a complete dataset to produce reliable outputs.
Here is where journey analytics creates real value for attribution: it enables model comparison. Rather than committing to a single model and accepting its blind spots, you can apply multiple models to the same journey data and observe how credit shifts. A channel that appears insignificant under last-click attribution may emerge as consistently influential under data-driven or linear models. That discrepancy is a signal worth investigating.
Multi-touch attribution is the natural output of full journey visibility. When you have complete path data for every converting prospect, you can see which touchpoints appeared most frequently in winning journeys, which combinations of channels produced the highest-value customers, and which interactions correlate with faster time-to-close. Every contributing touchpoint receives proportional credit rather than one interaction absorbing all the recognition.
This matters practically because budget decisions follow attribution data. If last-click attribution is your only lens, you will systematically defund the channels that are actually building pipeline and over-invest in the channels that happen to be present at the moment of conversion. Multi-touch attribution, grounded in complete journey data, corrects this distortion.
What Customer Journey Analytics Reveals That Standard Reporting Cannot
Standard channel reporting tells you how each channel performs in isolation. Journey analytics tells you how channels perform in combination, in sequence, and over time. These are fundamentally different questions, and the answers lead to fundamentally different decisions.
Path analysis is one of the most powerful outputs of journey analytics. By mapping the most common sequences of touchpoints that lead to conversion, you can identify which channel combinations work together rather than treating each channel as an independent variable. You might discover that prospects who engage with LinkedIn thought leadership content before clicking a Google search ad convert at a meaningfully higher rate than those who click the search ad without prior social exposure. That insight is invisible in channel-level reporting but becomes clear when you can see the sequence.
Equally revealing are the paths that lead to drop-off. Understanding where prospects disengage, and what they were doing immediately before they stopped engaging, surfaces friction points that aggregate funnel metrics cannot locate. If a significant share of prospects who visit your integration documentation page never return, that is a signal about either the content or the product that warrants investigation.
Time-to-conversion analysis is another dimension that standard reporting misses. B2B buying cycles are long, often spanning weeks or months, and that duration varies significantly by deal size, acquisition channel, and prospect segment. Journey analytics can surface these patterns explicitly. You might find that prospects acquired through organic search have a longer average time-to-close but a higher average deal value than those acquired through paid social. That insight directly informs how you pace budget across channels and how you sequence campaigns to match the natural tempo of different buyer types.
Understanding actual cycle length also changes how you evaluate campaign performance. A campaign that appears to be underperforming after 30 days may simply be serving a segment with a 90-day buying cycle. Without journey-level time data, you might cut that campaign prematurely and lose pipeline you would have seen two months later.
Perhaps the most strategically important concept in journey analytics is the distinction between touchpoint influence and touchpoint credit. Credit, in most attribution systems, goes to the touchpoints that are present at conversion. Influence describes the touchpoints that consistently appear in winning paths, regardless of whether they receive formal credit.
A webinar, for example, may rarely be the last touchpoint before a demo request. Under last-click attribution, it receives no credit and looks like a poor investment. But if journey analytics shows that prospects who attend a webinar close at a higher rate and at higher deal values than those who do not, the webinar is a highly influential touchpoint that the credit-based view is systematically hiding. Journey analytics surfaces this kind of insight by looking at patterns across thousands of paths rather than evaluating each touchpoint in isolation.
Putting Customer Journey Analytics to Work in B2B SaaS
Understanding the theory of customer journey analytics is one thing. Translating it into a practical workflow that improves actual marketing decisions is another. Here is how it works in practice for B2B SaaS teams.
The starting point is data unification. Ad platform data, website behavioral events, CRM records, and revenue data need to flow into a single system where they can be connected at the individual journey level. This is not about building a data warehouse from scratch. It is about connecting existing tools through a purpose-built attribution platform that handles identity stitching and event sequencing automatically.
Once data is unified, the first useful analysis is campaign quality assessment. Not all leads are equal, and journey analytics makes this visible. You can identify which campaigns are generating leads that progress through the pipeline versus which are generating high volumes of leads that stall at early stages and never convert to revenue. A campaign with a low cost-per-lead but a high rate of pipeline stagnation is not a good campaign. Journey analytics connects the ad spend to the downstream outcome so you can see this clearly.
Budget reallocation becomes data-driven rather than intuition-driven when you have this visibility. Channels that appear in high-value customer paths, even when they do not receive last-click credit, justify continued or increased investment. Channels that drive volume but show weak correlation with closed revenue are candidates for reallocation. This is a fundamentally different conversation than optimizing for cost-per-lead, and it tends to produce meaningfully different budget decisions.
AI-driven analysis accelerates this entire process. Manually reviewing thousands of individual customer journeys to identify patterns is not realistic for most marketing teams. AI can surface those patterns automatically, flagging which channel combinations are over-performing, which audience segments have shorter buying cycles, and which campaign structures correlate with higher deal values. These insights emerge from the data rather than from analyst hours spent in spreadsheets.
The feedback loop closes when those insights return to the ad platforms. Enriched conversion signals, sent back to Meta, Google, and LinkedIn through server-side Conversion API integrations, give ad platform algorithms better data to optimize against. Instead of optimizing for form fills, the algorithm can optimize for signals that correlate with actual revenue. This improves targeting quality over time, which improves the quality of the journeys entering the system, which improves the accuracy of the analytics. It is a compounding advantage that builds with consistent use.
Platforms like Cometly are built specifically to enable this workflow for B2B SaaS teams, connecting ad platforms, website tracking, CRM data, and revenue systems into a unified attribution view that makes this kind of analysis accessible without requiring a dedicated data engineering team.
Building a Foundation for Accurate Journey Tracking
Customer journey analytics is only as reliable as the tracking infrastructure beneath it. Gaps in data collection do not just create incomplete pictures. They create systematically misleading ones, because the gaps are rarely random. They tend to cluster around specific channels, devices, or user behaviors in ways that skew your understanding of what is actually working.
Server-side event tracking is the technical foundation of accurate journey analytics. Client-side pixels, which fire JavaScript in the user's browser, are blocked by ad blockers, dropped by browser privacy settings, and increasingly restricted by iOS and browser-level changes. Server-side tracking captures events at the infrastructure level before any of these client-side restrictions apply. The result is a more complete event dataset that represents actual user behavior rather than the subset that browser-based tracking happens to capture.
Conversion API integration extends server-side tracking into the ad platforms themselves. Meta's Conversion API, Google's Enhanced Conversions, and equivalent tools from other platforms allow you to send enriched, server-side event data directly to the ad network. This accomplishes two things: it improves the completeness of conversion data the platform uses for optimization, and it enables you to send downstream signals like pipeline creation or closed-won revenue rather than just form fills. When ad platforms optimize against revenue signals rather than lead signals, the quality of traffic they deliver tends to improve.
Event deduplication is a technical requirement that is easy to overlook. When you run both client-side and server-side tracking simultaneously, which is often necessary during transition periods, the same event can be recorded twice: once by the browser pixel and once by the server-side system. Without deduplication logic, conversion counts become inflated, attribution data becomes unreliable, and budget decisions based on that data become distorted. Proper deduplication, typically handled through event ID matching, ensures each interaction is counted exactly once.
Data accuracy is not a nice-to-have in journey analytics. It is the prerequisite for everything else. A journey analytics system built on incomplete or duplicated data will produce confident-looking insights that lead to poor decisions. The investment in proper tracking infrastructure pays dividends not just in data quality but in the trust that marketing and revenue teams place in the numbers.
The ideal setup is a connected system where ad platform events, website behavioral data, CRM records, and revenue data all flow into a single attribution platform. This gives marketing teams one source of truth: a place where every channel, every campaign, and every touchpoint can be evaluated against actual revenue outcomes rather than proxy metrics. When that system is built correctly, the customer journey analytics definition stops being an abstract concept and becomes a daily operational capability.
The Bottom Line on Customer Journey Analytics
Customer journey analytics is not a definition to memorize. It is a capability to build. The distinction matters because many marketing teams understand the concept but continue operating with last-click reports and siloed channel dashboards that make the concept impossible to act on.
B2B SaaS buying journeys are inherently multi-touch and multi-channel. Prospects interact with your brand many times, across many surfaces, before they ever speak to sales. The teams that can see those interactions as a connected sequence, rather than as isolated events in separate platforms, make fundamentally better decisions about where to invest, what to build, and how to optimize.
They can see which channels are actually influencing revenue versus which are generating noise. They can identify the campaign structures and channel combinations that produce high-value customers. They can stop defunding upper-funnel investments because last-click attribution makes them look ineffective, and they can stop over-investing in channels that win credit without winning deals.
This is the practical value of full journey visibility. It is not about having more data. It is about having the right data, connected correctly, so that every budget decision is grounded in what is actually driving revenue.
If you are ready to move beyond last-click reports and build a complete view of your customer journey, Cometly is built specifically for this. It connects your ad platforms, website tracking, CRM, and revenue data into a single attribution system designed for B2B SaaS teams. From multi-touch attribution to AI-driven insights and server-side Conversion API integration, it gives your team the tools to see the full path from first ad click to closed deal. Get your free demo today and start capturing every touchpoint to maximize your conversions.



