

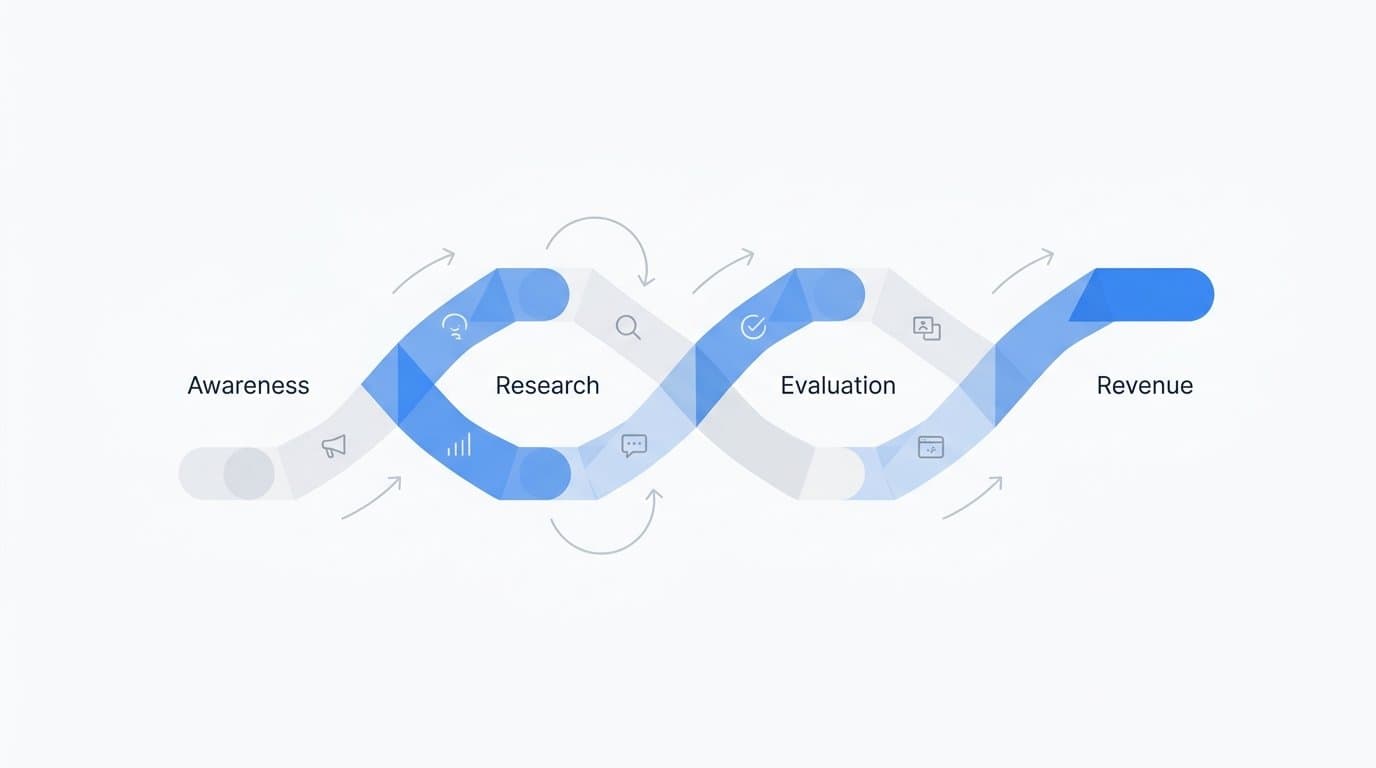
Most B2B SaaS buyers do not discover your product on Monday and sign a contract on Tuesday. They search for solutions, read comparison articles, scroll past your LinkedIn ad, revisit your pricing page a week later, and finally book a demo after a colleague mentions you in a Slack thread. The journey is long, nonlinear, and spread across more channels than most marketing teams can comfortably track.
This creates a real problem. If you cannot see the full customer journey online, you are making budget decisions based on a partial story. You might be cutting the awareness campaigns that started the conversation or doubling down on the last-click channel that simply happened to be there at the finish line. Either way, you are flying with instruments that only show half the sky.
This article is a practical guide for marketing teams who want to understand, map, and measure every stage of the online journey. We will break down how B2B buyers actually move from first awareness to closed revenue, where the common attribution blind spots live, and how to connect your ad spend to real pipeline outcomes so you can allocate budget with confidence.
The Stages Every B2B Buyer Moves Through Online
Before you can measure the customer journey, you need a clear picture of what that journey actually looks like. For B2B SaaS buyers, it typically unfolds across three broad stages, each with distinct channels, behaviors, and intent signals.
Awareness: This is where the journey begins. A potential buyer realizes they have a problem or starts exploring a category of solutions. They might find you through a Google search, a LinkedIn post, a podcast ad, or a display campaign. At this stage, they are not ready to buy. They are gathering context, and the channels that reach them here are often brand-building in nature.
Consideration: Once a buyer has identified a few potential solutions, they shift into evaluation mode. They read G2 reviews, watch product demos on YouTube, download comparison guides, and attend webinars. This stage is where content marketing, retargeting, and email sequences do their heaviest lifting. The buyer is now comparing you against alternatives and looking for reasons to trust you.
Decision: This is the conversion stage. The buyer requests a demo, starts a free trial, or reaches out to sales. The channel that gets credit here is often paid search or a direct visit, because those are the highest-intent interactions. But the decision was almost certainly shaped by everything that came before it.
Here is where most marketing reporting goes wrong: it treats all traffic as equal. A session from a retargeting ad gets the same weight as a session from a brand awareness campaign, even though they represent completely different moments in the buyer's thinking. When you flatten the journey into a single conversion event, you lose the nuance that actually explains your results.
B2B journeys are also fundamentally different from B2C in their complexity. A consumer might decide to buy a pair of shoes in a single session. A SaaS buying decision often involves multiple stakeholders, internal approval processes, and evaluation periods that stretch across weeks or even months. A champion discovers your product, a manager needs to approve the budget, and a technical lead wants to review the integration. Each of those people may interact with your content independently, across different devices and sessions, before a single conversion event gets recorded.
This is why understanding the stages of the customer journey online is not just a theoretical exercise. It is the foundation for every smart budget and channel decision your team makes.
Why Most Marketing Teams Only See Part of the Picture
If you have ever looked at your ad platform dashboards and felt like something was not adding up, you are not imagining it. The way most teams measure performance creates a systematic blind spot that distorts how they understand the customer journey.
The most common culprit is last-click attribution. In a last-click model, the final touchpoint before conversion gets 100 percent of the credit. So if a buyer clicked a Google search ad right before requesting a demo, that campaign looks like a winner. The LinkedIn awareness campaign that introduced them to your brand three weeks earlier gets nothing. The retargeting ad that brought them back to your pricing page gets nothing. The email sequence that answered their objections gets nothing.
Over time, this creates a feedback loop where teams invest more in bottom-of-funnel, high-intent channels because those are the ones showing conversions in the data. Awareness and consideration channels look like they are not working, so budgets get cut. But when those upper-funnel investments disappear, the pipeline eventually dries up because there are fewer buyers entering the journey in the first place.
Platform-native reporting compounds this problem. Google Ads reports on Google Ads performance. Meta reports on Meta performance. LinkedIn reports on LinkedIn performance. Each platform uses its own attribution window, its own conversion counting logic, and its own view of what constitutes a touchpoint. When you look at each dashboard in isolation, the numbers often do not reconcile. You might see more conversions claimed across your platforms than you actually have in your CRM.
This is the data fragmentation problem. Your ad platforms, your CRM, and your website analytics are all capturing pieces of the journey, but none of them are talking to each other. There is no single view that connects a buyer's first ad impression to their eventual closed-won status in your CRM. Without that connection, you cannot do real touchpoint analysis.
Touchpoint analysis is the practice of examining which channels and interactions contributed to a conversion at each stage of the journey, not just which one happened last. It requires data that spans the entire journey, from the first ad click to the signed contract. When you can see that pattern clearly, you can allocate budget to the channels that are actually moving buyers through the funnel, not just the ones that happen to be standing at the finish line.
Key Touchpoints That Shape the Online Customer Journey
Understanding which digital touchpoints appear most often in a B2B SaaS buyer's journey helps you think more clearly about where to invest and what each channel is actually doing for you.
Paid Search: Google and Bing search ads typically capture buyers who are already in the consideration or decision stage. They are searching for specific solutions, which signals high intent. Paid search is often the last touchpoint before a conversion, which is why it tends to dominate last-click attribution reports. But it rarely works in isolation.
Organic Content and SEO: Blog posts, comparison pages, and long-form guides support the research phase. A buyer might find your content through an organic search while evaluating options, read several articles over multiple visits, and only engage with a paid ad much later. Organic content builds trust and familiarity over time, even when it does not directly trigger a conversion event.
Social Media Ads: Paid social on platforms like LinkedIn, Meta, and Instagram typically serves awareness and consideration goals. LinkedIn is particularly effective for B2B SaaS because of its professional targeting capabilities. These ads introduce your brand to buyers who may not be actively searching yet, seeding the journey before high-intent channels take over.
Email Sequences: Once a prospect has engaged with your content or signed up for something, email becomes a powerful nurture channel. It keeps your brand visible during the consideration phase and can re-engage buyers who have gone quiet. Email is often invisible in attribution models because it operates outside the paid ad ecosystem, but its influence on conversion rates is real.
Retargeting Campaigns: Retargeting bridges the gap between consideration and decision. When a buyer visits your pricing page but does not convert, a well-timed retargeting ad can bring them back. These campaigns tend to show strong conversion rates because they are reaching people who already know who you are.
Direct and Branded Traffic: When a buyer types your URL directly or searches for your brand name, they are usually deep in the decision stage. This traffic often looks like organic or direct in your analytics, but it was likely influenced by earlier touchpoints that made your brand memorable.
The challenge in tracking all of these touchpoints accurately has grown significantly as third-party cookies have become less reliable. Browser-level privacy restrictions and cookie deprecation mean that pixel-based tracking misses more conversions than it used to. Server-side tracking and Conversion API integrations, such as Meta's Conversion API and Google's Enhanced Conversions, have become the modern standard for capturing accurate conversion events. By sending data directly from your server rather than relying on a browser pixel, you get a more complete and durable picture of how buyers are moving through your funnel.
First-party data collected directly from your own properties is now more valuable than ever. When you enrich that data and send it back to ad platforms, you give their machine learning algorithms better signals about which users actually convert, which improves targeting accuracy over time.
How Attribution Models Interpret the Customer Journey
Attribution models are the rules that determine how credit for a conversion gets distributed across the touchpoints in a buyer's journey. Different models tell very different stories about which channels are working, and understanding those differences is essential for making smart budget decisions.
First-Touch Attribution: This model gives 100 percent of the credit to the very first interaction a buyer had with your brand. It is useful for understanding which channels are best at generating awareness and bringing new buyers into the funnel. The limitation is that it completely ignores everything that happened between that first touch and the eventual conversion.
Last-Click Attribution: The most widely used model by default, last-click credits the final touchpoint before conversion. It is simple to implement and easy to understand, but as discussed earlier, it systematically undervalues the channels that do the early and middle work of the journey. For long B2B sales cycles, last-click attribution is particularly misleading.
Linear Attribution: This model distributes credit equally across every touchpoint in the journey. If a buyer had six interactions before converting, each one gets one-sixth of the credit. Linear attribution gives a more balanced view of channel contribution but can overweight low-impact touchpoints that happened to appear in the journey without meaningfully influencing the decision.
Data-Driven Attribution: This is the most sophisticated model, and increasingly the most useful. Data-driven attribution uses algorithmic weighting based on actual conversion patterns across your audience. Instead of applying a fixed rule, it analyzes which touchpoint sequences most reliably lead to conversions and assigns credit accordingly. The result is a model that reflects how buyers in your specific market actually behave, rather than a theoretical framework.
No single model is universally correct. The right choice depends on the length of your sales cycle, the number of touchpoints in a typical journey, and what decisions you are trying to inform. A team with a short sales cycle and few touchpoints might find last-click attribution adequate. A team with a complex, multi-month journey involving six or more channels will get far more value from a data-driven approach.
The real power comes from comparing models side by side. When you run first-touch and last-click reports simultaneously, you often find that certain channels look very different depending on which lens you use. A channel that appears low-performing under last-click might be one of your best awareness drivers under first-touch. Seeing that contrast helps you avoid cutting campaigns that are actually critical to the journey, even if they never get direct conversion credit in standard reporting.
Mapping the Journey to Pipeline and Revenue
Lead volume is a vanity metric if it does not connect to revenue. For B2B SaaS teams, the real measure of marketing effectiveness is not how many form fills you generated. It is how many of those leads became opportunities, how many of those opportunities closed, and what revenue they produced. Getting to that level of clarity requires connecting your journey data to your pipeline and your revenue systems.
Most marketing teams stop at the conversion event. A demo request gets recorded, it gets passed to sales, and from that point on, marketing loses visibility. The CRM takes over, and whatever happens next is treated as a sales problem rather than a marketing insight. This handoff creates a gap in the data that makes it impossible to answer the most important question in B2B marketing: which campaigns and channels are actually producing customers, not just leads?
Closing that gap requires integrating three data sources that are typically kept separate. Your ad platform data shows which campaigns and creatives drove clicks and impressions. Your CRM data shows which leads became opportunities and which opportunities closed. Your revenue data, whether from Stripe or another billing system, shows the actual contract value and customer lifetime value attached to each conversion. When you connect all three, you can trace a closed-won deal back to the specific ad campaign, the specific touchpoint sequence, and the specific channel mix that started the journey.
This level of integration changes how you think about ROI. Instead of measuring cost per lead, you can measure cost per closed customer. Instead of optimizing for form fill rate, you can optimize for pipeline contribution. These are fundamentally different objectives, and they lead to very different budget decisions.
AI-driven insights add another layer of value here. When you have a rich dataset of complete customer journeys connected to revenue outcomes, machine learning can identify patterns that manual analysis would miss. For example, it might reveal that buyers who engaged with a specific content piece early in their journey and then clicked a retargeting ad within a certain window have a significantly higher close rate than average. That kind of insight tells you not just which channels to invest in, but which sequences and combinations are most likely to produce high-value customers. You can then scale those patterns with confidence, knowing they are backed by actual revenue data rather than proxy metrics.
Putting Customer Journey Insights Into Action
Understanding the customer journey conceptually is one thing. Building the infrastructure to actually track and act on it is another. Here is a practical framework for marketing teams who want to move from fragmented reporting to a complete, revenue-connected view of their funnel.
Step one is auditing your current tracking gaps. Start by mapping every touchpoint in a typical buyer journey and asking whether you are capturing data at each one. Where are your pixels firing reliably? Where are you missing events because of browser restrictions or cookie blocking? Where does your data trail go cold after a lead is passed to sales? Most teams find more gaps than they expected.
Step two is implementing server-side event tracking. Moving from browser-based pixels to server-side tracking dramatically improves the completeness and accuracy of your conversion data. Server-side tracking is not affected by ad blockers, browser privacy settings, or cookie deprecation. It gives you a durable foundation for capturing the events that matter most, whether that is a demo request, a trial signup, or a subscription activation.
Step three is establishing a single source of truth. Fragmented reporting across multiple platforms creates confusion and leads to poor decisions. You need one place where your ad platform data, CRM data, and revenue data are unified and presented through a consistent attribution framework. This is the foundation for every insight that follows.
Once your tracking foundation is solid, you can start feeding enriched conversion data back to your ad platforms. Conversion API integrations with Meta and Google allow you to send first-party event data directly from your server to the ad platforms' machine learning systems. When those systems receive better signals about which users actually convert and which ones become high-value customers, they get better at finding more buyers like them. This improves targeting efficiency and ad ROI without requiring you to increase your budget.
The strategic payoff of all this work is the ability to reallocate budget with confidence. When you can see which channels contributed at each stage of the journey, which touchpoint sequences produce the highest-LTV customers, and which campaigns are genuinely driving pipeline versus just generating clicks, you stop guessing. You can cut the spend that is not contributing to revenue, scale the campaigns that are proven to work, and make the case for awareness investments that do not show up in last-click reports but are clearly moving buyers through the funnel.
Teams that build this capability do not just get better data. They get a structural advantage over competitors who are still optimizing for surface-level metrics. Every budget cycle, they make smarter decisions. Every campaign, they compound what they have learned. Over time, that compounds into a significant performance gap.
The Bottom Line on Tracking the Full Journey
The customer journey online is not a straight line, and it was never meant to be. B2B buyers research, compare, disappear, and come back. They interact with your brand across paid and organic channels, on mobile and desktop, over days and weeks. The teams that win are the ones who can see every step of that journey, not just the last one.
The key takeaways from this guide come down to three requirements. First, you need multi-touch attribution that distributes credit across the full journey rather than collapsing it into a single touchpoint. Second, you need server-side data collection that captures conversion events reliably without depending on third-party cookies. Third, you need integration across your ad platforms, CRM, and revenue tools so that you can connect first click to closed-won customer in a single view.
Cometly is built specifically to give B2B SaaS teams this visibility. It connects your ad platforms, CRM, and website to track the entire customer journey in real time, compares attribution models side by side, integrates with Stripe to connect revenue data to your ad spend, and uses AI to surface the insights that tell you which campaigns are actually driving growth. From first touchpoint to closed customer, Cometly gives you the single source of truth your team needs to make confident, data-driven decisions.
If you are ready to stop guessing and start seeing the full picture, Get your free demo today and start capturing every touchpoint to maximize your conversions.



