Every marketer has faced that dreaded budget meeting where leadership asks, "Which channels are actually working?" If you cannot answer that question with confidence, your budgets are at risk. Proving marketing channel value is no longer optional. It is the difference between scaling campaigns strategically and guessing your way through quarterly planning.
The challenge is real: customers interact with multiple touchpoints before converting, ad platform data is often inflated or incomplete, and CRM records rarely connect back to the original click. Without a clear framework, you end up defending your spend with vanity metrics instead of revenue data.
This guide walks you through a practical, repeatable process to prove which marketing channels genuinely drive pipeline and revenue. You will learn how to define the right success metrics, set up accurate tracking, apply attribution models, build compelling reports, and present your findings in a way that earns stakeholder buy-in. Whether you are a solo marketer justifying your ad spend or an agency proving ROI to clients, these steps will give you a structured path from murky data to clear, defensible channel-level insights.
Let's get into it.
Step 1: Define What "Value" Means for Your Business
Before you measure anything, you need to agree on what you are measuring. This sounds obvious, but it is where most channel value exercises fall apart. Different stakeholders have different definitions of success, and if those definitions are not aligned upfront, your data will always be contested.
The core principle here is simple: channel value must be tied to business outcomes, not vanity metrics. Impressions, reach, and clicks tell you how much activity a channel generated. They do not tell you whether that activity moved revenue forward.
Start by mapping each of your marketing channels to a specific stage in the revenue funnel. Here is a practical way to think about it:
Awareness channels (display, social, video): Measure by qualified traffic, new audience reach, and influence on downstream conversions. These channels rarely close deals directly, but they warm prospects who convert later.
Consideration channels (search, content, email): Measure by lead volume, lead quality scores, and pipeline contribution. These channels often bridge the gap between awareness and intent.
Conversion channels (paid search, retargeting, sales outreach): Measure by closed-won revenue, cost per acquisition, and return on ad spend. These are your closing channels and will naturally receive more last-click credit. Understanding marketing channel impact at each funnel stage is essential for setting the right KPIs.
Once you have that mapping, create a simple channel-to-outcome document. It does not need to be elaborate. A spreadsheet with columns for channel name, funnel stage, primary KPI, and secondary KPI is enough to get started. The goal is to give every channel a fair and relevant standard to be measured against.
The most important step here is getting stakeholder agreement before you start reporting. When your CFO, CMO, and sales leader all sign off on what "success" looks like for each channel, you eliminate the debate later. You are not defending your methodology in the meeting. You are presenting results against a standard everyone already agreed to.
This alignment document becomes the foundation for everything that follows. Revisit it quarterly as your channel mix evolves.
Step 2: Build a Unified Tracking Foundation
You cannot prove channel value with incomplete or inconsistent data. Before you analyze anything, you need to be confident that your tracking is capturing the full picture. In 2026, that requires more than dropping a pixel and calling it done.
Start with UTM parameters. Every paid link, every email campaign, every social post that drives traffic should carry a UTM string with consistent naming conventions. This is where many teams stumble. If one team member tags a campaign as "google-ads" and another uses "Google_Ads" and a third uses "gads," your data gets fragmented into three separate buckets. Establish a naming convention document and enforce it across your entire team. For a deeper dive, learn what UTMs are and how marketers use them for campaigns.
Next, address the browser-side tracking problem. Cookie deprecation, Apple's App Tracking Transparency framework, and evolving browser privacy restrictions have made client-side tracking significantly less reliable. When a user blocks cookies or uses a privacy-focused browser, traditional pixel-based tracking misses that touchpoint entirely. You end up with data gaps that make your channel performance look worse than it actually is.
Server-side tracking solves this. Instead of relying on a browser cookie to fire a tag, server-side tracking processes conversion data directly from your server. It is not affected by ad blockers, browser restrictions, or iOS privacy changes. The result is more complete, more accurate data that reflects what is actually happening across your customer journeys.
CRM integration is the third pillar. Your website and ad platforms can tell you which clicks happened. Your CRM tells you which clicks became qualified leads, opportunities, and closed revenue. Without connecting these two data sources, you are missing the most important part of the story. Every marketing channel should be traceable from the first ad impression through to the CRM record.
This is exactly the kind of unified data infrastructure that Cometly is built to support. Cometly connects your ad platforms, CRM, and website data to track the entire customer journey in real time, giving you a single source of truth instead of five disconnected dashboards.
Get this foundation right before you move to attribution. Garbage in, garbage out. The most sophisticated attribution model in the world cannot compensate for broken tracking at the source.
Step 3: Map the Full Customer Journey Across Channels
Here is a scenario that plays out constantly in marketing teams: a customer clicks a Facebook ad in January, reads three blog posts in February, opens an email sequence in March, searches for your brand name in April, and finally converts through a Google search. Last-click attribution gives Google 100% of the credit. Facebook, content, and email get nothing.
That is not a measurement strategy. That is a blind spot factory.
Multi-touch journey mapping is the antidote. The goal is to identify every touchpoint a customer interacts with before converting, so you can understand the actual role each channel plays in the buying process. Successfully tracking omnichannel marketing campaigns is critical for businesses with longer sales cycles where the path from awareness to purchase spans weeks or months.
Single-channel reporting creates two specific problems. First, it inflates the perceived value of bottom-funnel channels like branded search and retargeting, because those channels are often the last click before conversion. Second, it systematically undervalues upper-funnel channels like social, display, and content, which are doing the heavy lifting of building awareness and intent.
The result is that teams cut the channels doing the most important work and over-invest in the channels that are simply finishing what others started.
To build an accurate journey map, start manually. Pull your ten most recent conversions and trace each one back through every touchpoint you can identify. Look at your CRM activity history, your email engagement logs, your ad platform click data, and your website analytics. You will quickly see patterns: common first-touch channels, typical nurture sequences, and the triggers that tend to drive final conversion.
This manual exercise gives you the intuition to set up automated journey tracking correctly. Cometly captures every touchpoint from ad clicks to CRM events, giving your team a complete, enriched view of each customer journey without the manual stitching. When you can see the full path in one place, you can finally have an honest conversation about which channels are contributing and at what stage.
Once you have your journey map, you are ready to apply an attribution model that reflects how your customers actually buy.
Step 4: Apply the Right Attribution Model to Your Data
Attribution models are frameworks for distributing credit across the touchpoints in a customer journey. Choosing the right model is not about finding the "true" answer. It is about choosing a model that aligns with your business goals and gives you actionable insight. For a comprehensive overview, explore this guide on marketing attribution modeling.
Here is a breakdown of the most common models and when to use them:
First-touch attribution: Gives 100% of the credit to the first interaction. Useful for understanding which channels are best at generating initial awareness and bringing new prospects into your funnel. It over-credits awareness channels and ignores everything that happens afterward.
Last-touch attribution: Gives 100% of the credit to the final interaction before conversion. This is the default in most analytics platforms and ad tools. It is easy to implement but systematically undervalues every channel that contributed before the closing touchpoint.
Linear attribution: Distributes credit equally across all touchpoints. Better than single-touch models for acknowledging the full journey, but it treats a quick blog visit the same as a 30-minute product demo, which may not reflect actual influence.
Time-decay attribution: Gives more credit to touchpoints that occurred closer to the conversion. This makes intuitive sense for short sales cycles where recency matters, but it can undervalue awareness-stage channels for businesses with long buying journeys.
Position-based (U-shaped) attribution: Gives the most credit to the first and last touchpoints, with the remainder distributed across the middle. A reasonable compromise for teams that want to recognize both acquisition and closing channels without ignoring nurture.
Data-driven attribution: Uses statistical modeling to assign credit based on each touchpoint's actual contribution to conversion. This is the most accurate approach when you have sufficient data volume, but it requires a meaningful number of conversions to produce reliable results. You can learn more about the differences between these approaches in this breakdown of types of marketing attribution models.
The most important recommendation here: never rely on a single model. Compare at least two models side by side. When you look at your channel performance through both a first-touch and a last-touch lens, channels that appear weak in one model often reveal surprising strength in another. That is exactly where you find undervalued investment opportunities.
Also, be cautious about trusting ad platform self-reported attribution exclusively. Every platform has an incentive to show its own numbers favorably. Meta will claim credit. Google will claim credit. And when you add up all the platform-reported conversions, the total often exceeds your actual conversion count. Cometly lets you compare attribution models and see which sources actually convert, giving you an independent view that is not filtered through any single platform's reporting lens.
Step 5: Calculate True Channel ROI and Cost Metrics
Once your attribution data is in order, it is time to translate touchpoint credit into financial metrics. This is where you move from "which channels get credit" to "which channels are worth the investment."
Start with the core formulas every channel value analysis needs:
ROAS (Return on Ad Spend): Revenue attributed to a channel divided by the ad spend for that channel. A ROAS of 4 means you generated four dollars in revenue for every dollar spent. Simple, but only useful when your attribution data is accurate. For a complete breakdown of this metric, read our guide on what ROAS is in marketing.
CAC by channel (Customer Acquisition Cost): Total spend on a channel divided by the number of new customers acquired through that channel. This metric reveals which channels are acquiring customers efficiently and which are burning budget on low-quality traffic.
Cost per qualified lead: Total channel spend divided by the number of leads that meet your qualification criteria. This is more meaningful than cost per lead because it filters out volume that will never convert to revenue.
Contribution margin by channel: Revenue attributed to a channel minus the cost of goods sold and channel spend. This gives you a true profitability view rather than just a revenue view.
When comparing channels, make sure you are working with normalized data. A channel that runs for 30 days should not be compared directly to one that ran for 90 days without adjusting for time. Similarly, channels with different average deal sizes need to be evaluated in context, not just by raw revenue numbers.
Upper-funnel channels require special treatment. A display campaign that never receives last-click credit still influences conversion rates for channels that do. Use assisted conversion data to quantify this influence. When you can show that prospects who saw your display ads converted at a higher rate through other channels, you have a defensible argument for the display budget. Learning how to track marketing ROI across channels ensures you capture both direct and assisted value accurately.
One often-overlooked factor is time lag. A channel might generate a lead today that does not close for 90 days. If you evaluate that channel's ROI at the 30-day mark, you will underestimate its value significantly. Build time lag into your ROI windows based on your actual average sales cycle length.
Finally, feeding enriched conversion data back to your ad platforms improves the quality of their optimization algorithms. When Meta or Google receives accurate signals about which clicks led to real revenue rather than just form fills, their bidding systems can target more effectively. Cometly's conversion sync capability makes this process straightforward, sending clean, revenue-level conversion data back to platforms so their algorithms work with the best possible signals.
Step 6: Build a Channel Value Report That Stakeholders Trust
Data without presentation is just noise. The final analytical step is packaging your findings into a report that non-technical stakeholders can understand, trust, and act on. A great channel value report does not just show numbers. It tells a story about where your marketing dollars are working and where they are not.
Here is the anatomy of a report that earns buy-in:
Executive summary: Two to three sentences that answer the core question: which channels are driving the most value, and what should we do about it? Leadership reads the summary first. Make it count.
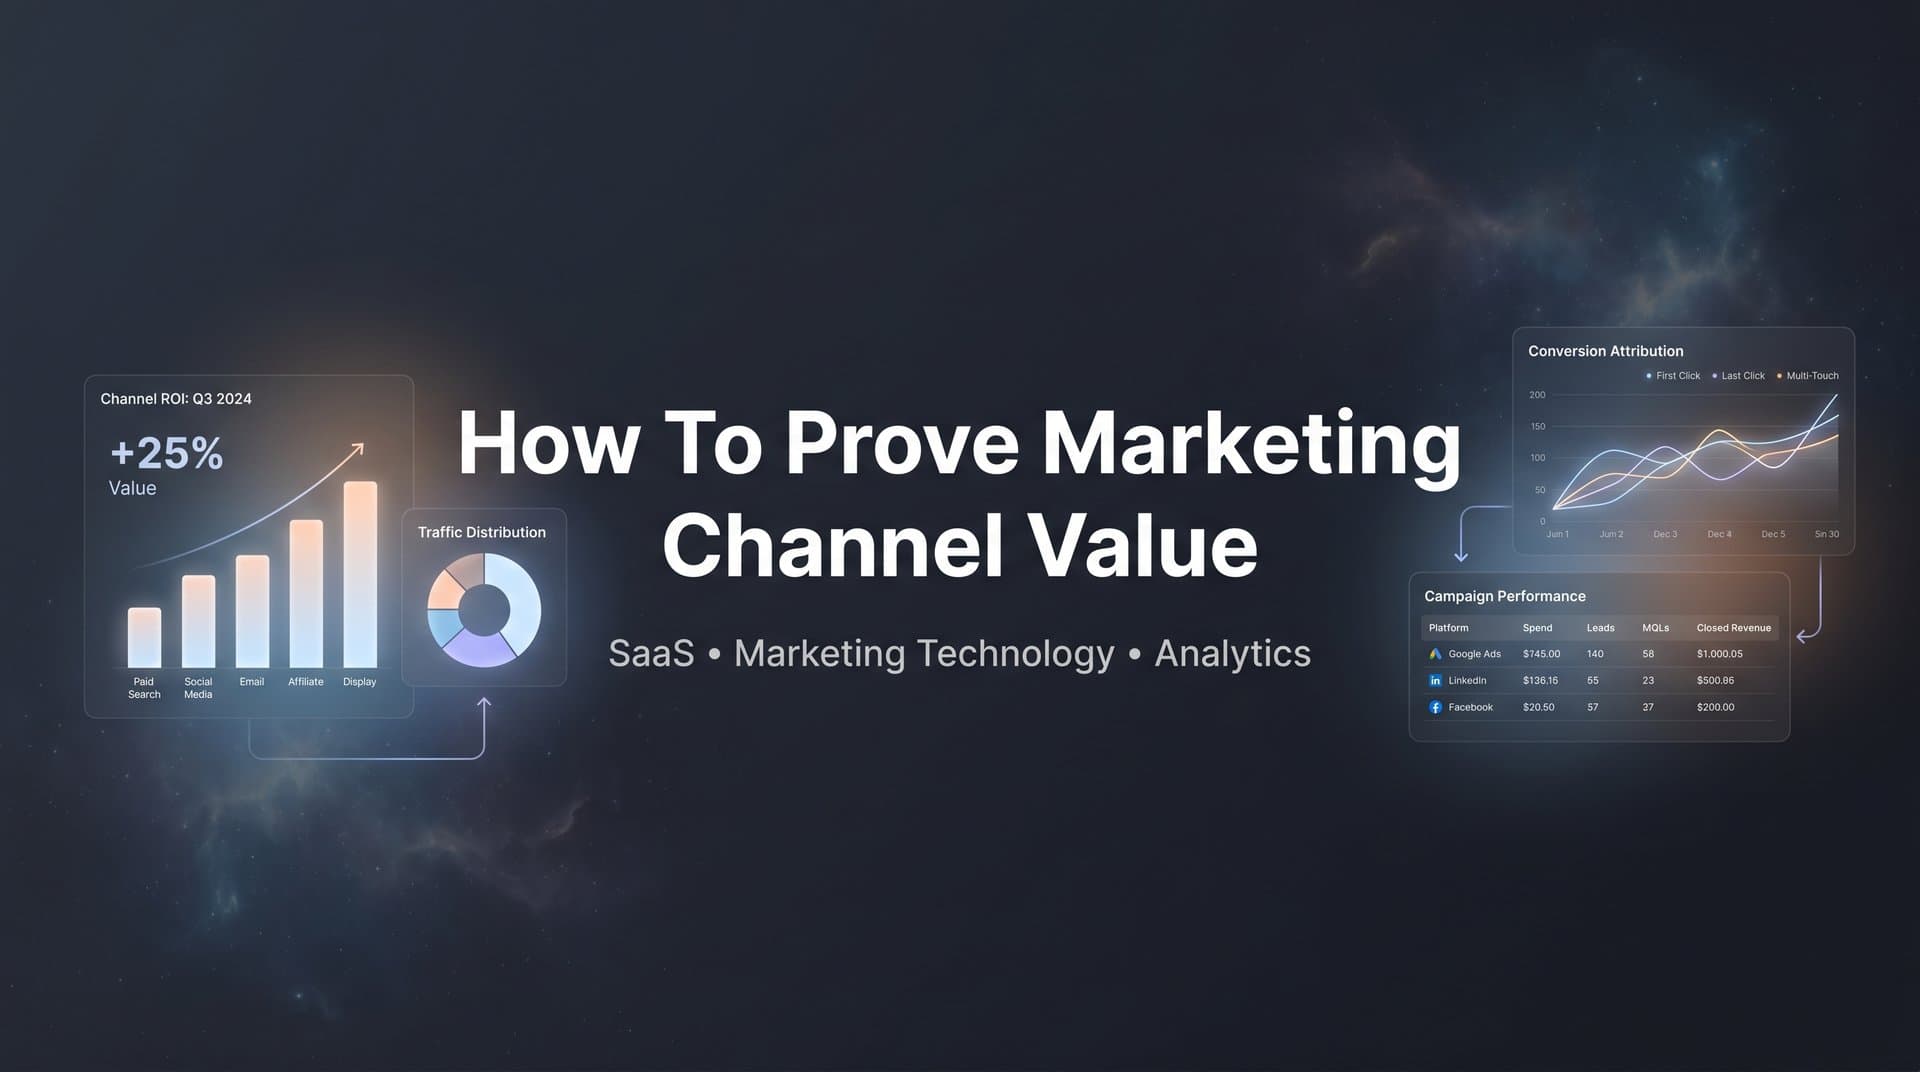
Channel-by-channel breakdown: Show each channel's spend, attributed revenue, ROAS, CAC, and cost per qualified lead. Include both direct and assisted conversion values so upper-funnel channels get fair representation. A channel that never gets last-click credit but consistently shows up in assisted conversions is doing meaningful work. Building unified dashboards for marketing and sales attribution makes this breakdown far easier to maintain and share.
Trend lines: Single-period snapshots can be misleading. Show performance over time so stakeholders can see whether channels are improving, declining, or holding steady. Trends are far more actionable than point-in-time numbers.
Attribution model comparison: Include a side-by-side view of at least two attribution models. This builds credibility by showing you have considered multiple perspectives, and it often surfaces channels that look very different depending on the model used.
Budget reallocation recommendation: This is what makes the report actionable. Based on your data, recommend specific budget shifts. Which channels deserve more investment? Which are underperforming relative to their cost? Give stakeholders a clear next step, not just a retrospective analysis. Understanding revenue attribution by marketing channel is what transforms a retrospective report into a forward-looking strategic document.
When it comes to visualization, keep it simple. Bar charts for channel comparisons, line charts for trends, and a simple table for the financial metrics. Avoid complex visualizations that require explanation. If a stakeholder needs a legend to understand your chart, simplify it.
AI-powered tools like Cometly can surface high-performing ads and campaigns across every channel and generate optimization recommendations based on your actual performance data. This means your report can include forward-looking insights, not just backward-looking analysis. Showing stakeholders what to do next, backed by AI-driven recommendations, is what separates a data report from a strategic asset.
Putting It All Together: Your Channel Value Checklist
Proving marketing channel value is a process, not a one-time project. Use this checklist as a quick reference every time you run a channel value analysis:
Step 1: Define value. Confirm that your channel KPIs are tied to revenue outcomes and that all stakeholders have agreed on the definitions before measurement begins.
Step 2: Audit your tracking. Verify that UTM parameters are consistent, server-side tracking is active, and your CRM is integrated with your ad and website data. Fix any gaps before analyzing results.
Step 3: Map customer journeys. Identify all touchpoints across your top recent conversions. Understand the typical path before drawing conclusions about channel contribution.
Step 4: Apply and compare attribution models. Run at least two models side by side. Never rely solely on ad platform self-reported data or default last-click attribution.
Step 5: Calculate true ROI. Use normalized, time-adjusted metrics. Account for assisted conversions and upper-funnel influence. Feed enriched data back to ad platforms to improve their optimization.
Step 6: Build and present your report. Include direct and assisted value, trend lines, and a concrete budget reallocation recommendation. Make the data actionable, not just informative.
The teams that do this consistently, not just at budget time, are the ones who earn the trust and the resources to scale. When you can walk into any meeting and show exactly which channels drove pipeline last quarter, you stop defending your budget and start directing it.
If you are looking for a platform that brings all of this together, including unified tracking, multi-touch attribution, AI-powered recommendations, and conversion sync back to ad platforms, Cometly is built for exactly this kind of work. Get your free demo today and start capturing every touchpoint to maximize your conversions.