Most B2B SaaS marketing teams know their total ROAS, but very few can tell you which specific campaigns, channels, or touchpoints are actually generating that revenue. That gap is expensive. When you cannot trace ad spend to closed deals, you end up over-investing in channels that look impressive on the surface and under-investing in the ones quietly building your pipeline.
Attribution fixes that. By connecting every touchpoint in the customer journey to real revenue outcomes, attribution gives you the clarity to make smarter budget decisions, cut underperforming spend, and double down on what actually works. The result is a measurable improvement in return on ad spend, not because you spent more, but because you spent smarter.
This guide covers seven actionable strategies B2B SaaS marketing teams can use to improve ROAS with attribution. Each strategy is designed to move you from guesswork to data-driven decision-making, whether you are running paid search, social ads, or a full multi-channel mix. If you have ever wondered why your ad platform dashboards show strong performance but your pipeline tells a different story, these strategies will help you close that gap.
1. Switch From Last-Click to Multi-Touch Attribution
The Challenge It Solves
Last-click attribution assigns 100% of conversion credit to the final touchpoint before a deal closes. In a simple, single-session buying process, that might be acceptable. In B2B SaaS, where buying cycles span weeks or months and involve multiple stakeholders, it is systematically misleading. Your awareness campaigns, your retargeting sequences, and your mid-funnel content all contribute to closed revenue, but last-click gives them zero credit.
The Strategy Explained
Multi-touch attribution distributes credit across all touchpoints in the customer journey. Depending on the model you choose, that credit can be distributed equally (linear), weighted toward recent interactions (time-decay), or concentrated at the first and last touch with credit shared across the middle (position-based). Each model tells a different story, but all of them are more accurate than last-click for B2B buying cycles. Understanding the difference between single-source and multi-touch attribution is the first step toward choosing the right model for your team.
The practical impact is significant. When you can see that a LinkedIn awareness campaign consistently appears in the early stages of deals that eventually close, you stop treating it as a low-ROAS channel and start treating it as a critical part of your pipeline engine. That shift in perspective directly improves how you allocate budget.
Implementation Steps
1. Audit your current attribution setup and identify whether you are relying on last-click or platform-native attribution models.
2. Choose a multi-touch model that fits your sales cycle length and team structure. Position-based or time-decay models tend to work well for B2B SaaS teams with longer cycles.
3. Implement a dedicated attribution platform that can ingest data from all your ad channels and apply a consistent model across them.
4. Run your current campaigns through the new model and compare credit distribution. Look for channels that gain or lose significant credit relative to last-click reporting.
Pro Tips
Do not switch attribution models in the middle of a reporting period. Establish a clean start date, run both models in parallel for at least 30 days, and document the differences before making budget decisions. This gives you a reliable comparison baseline and prevents reactive changes based on incomplete data.
2. Implement Server-Side Tracking to Recover Lost Conversion Data
The Challenge It Solves
Browser-based pixel tracking has become increasingly unreliable. Ad blockers, iOS privacy changes, and third-party cookie restrictions mean that a meaningful portion of your conversions may never be reported back to your ad platforms. When your conversion data is incomplete, your ROAS calculations are inaccurate, and the algorithms optimizing your campaigns are working with degraded signals.
The Strategy Explained
Server-side tracking via Conversion APIs sends conversion event data directly from your server to ad platforms like Meta and Google, bypassing browser-level restrictions entirely. Instead of relying on a pixel firing in a user's browser, the conversion signal travels server-to-server, making it immune to ad blockers and privacy settings.
The downstream effect on ROAS is direct. When your ad platforms receive more complete conversion data, they can attribute more revenue to your campaigns accurately, optimize bidding strategies more effectively, and build better-performing audiences. Higher event match quality on platforms like Meta is associated with improved ad delivery and optimization performance, which compounds over time. Learning how to improve ad tracking accuracy is essential before scaling any server-side implementation.
Implementation Steps
1. Audit your current pixel-based tracking setup and identify which conversion events are most likely losing data due to browser restrictions.
2. Set up server-side event tracking using your attribution platform's Conversion API integration for Meta, Google Enhanced Conversions, and any other active ad channels.
3. Deduplicate events carefully. When running both pixel and server-side tracking simultaneously, ensure your platform handles deduplication to avoid inflating conversion counts.
4. Monitor event match quality scores in your ad platforms after implementation and compare conversion volumes before and after to quantify the data recovery impact.
Pro Tips
Prioritize the conversion events that matter most to your ROAS calculation first. Start with purchase events, demo bookings, or trial signups before expanding to micro-conversions. Getting your highest-value events tracked accurately delivers the most immediate lift in attribution accuracy and ad platform optimization quality.
3. Connect Ad Spend Directly to Pipeline and Revenue
The Challenge It Solves
Many B2B SaaS marketing teams optimize their ad campaigns for MQLs or form fills because those are the metrics their attribution tools can measure. The problem is that MQLs are a proxy metric, not a revenue metric. A campaign that generates 200 MQLs at low cost might look like a ROAS winner while producing almost no closed revenue. Optimizing for the wrong metric means your ROAS improvement is illusory.
The Strategy Explained
True revenue-based ROAS optimization requires integrating your CRM and payment data with your attribution platform. When you connect tools like HubSpot, Salesforce, or Stripe to your ad data, you can measure what actually matters: cost per pipeline opportunity, cost per closed deal, and revenue generated per dollar of ad spend. Dedicated B2B revenue attribution software is purpose-built to make these CRM and payment integrations seamless.
This shift changes which campaigns you scale and which you cut. A campaign that looked expensive on a cost-per-MQL basis might show outstanding cost-per-closed-deal performance when CRM data is layered in. Conversely, a campaign generating cheap leads might reveal a poor close rate and a terrible true ROAS. Platforms like Cometly are built specifically to connect this data, giving B2B SaaS teams a real revenue picture rather than a lead volume picture.
Implementation Steps
1. Connect your CRM (HubSpot, Salesforce, or equivalent) to your attribution platform so that opportunity stage and deal status flow back to your campaign data.
2. If you use Stripe or another payment processor, integrate revenue data so that actual deal values are tied to the originating ad touchpoints.
3. Build reporting views that show cost per pipeline opportunity and cost per closed deal alongside your standard campaign metrics.
4. Identify campaigns where cost per lead is low but cost per closed deal is high, and reallocate budget accordingly.
Pro Tips
Give this analysis time to mature. B2B sales cycles mean that deals attributed to campaigns this month may not close for another 60 to 90 days. Build a reporting cadence that accounts for lag time, and avoid making premature budget cuts based on pipeline data that has not had time to convert.
4. Map the Full B2B Customer Journey Before Allocating Budget
The Challenge It Solves
Budget allocation decisions made without journey data are often wrong in the same direction: they reward the channels that close deals while penalizing the channels that start them. If you consistently cut awareness and mid-funnel campaigns because they show low last-click ROAS, you will eventually starve your pipeline of the prospects that your closing campaigns depend on.
The Strategy Explained
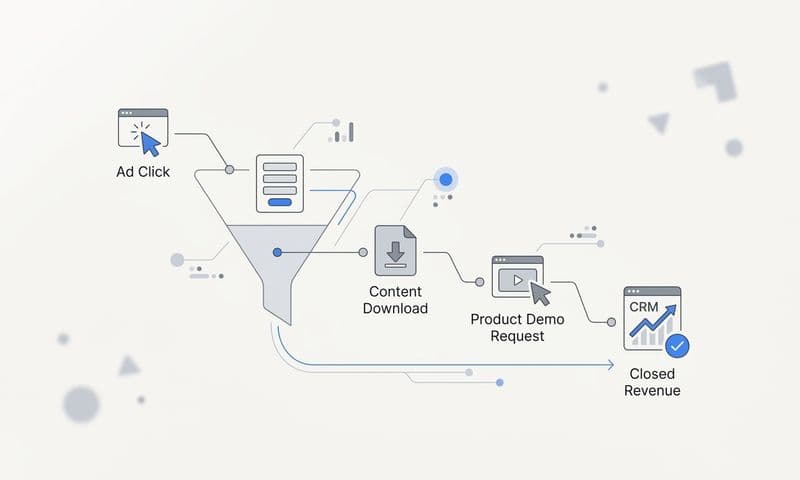
Attribution data reveals the actual sequence of touchpoints that precede closed deals. By analyzing which channels and campaigns appear most frequently at the awareness stage, the consideration stage, and the decision stage, you can build a clear picture of how your pipeline actually flows. Exploring B2B revenue attribution in SaaS across different growth models can sharpen how you interpret these journey patterns.
This journey map becomes your budget allocation guide. Channels that consistently appear as first-touch or assist touchpoints in closed deals deserve investment even if they never show up as the last-click source. Channels that appear only in deals that stall or churn deserve scrutiny regardless of how strong their surface-level metrics look. Understanding the journey prevents you from making cuts that feel rational in a spreadsheet but damage your pipeline six months later.
Implementation Steps
1. Use your attribution platform to pull a report showing all touchpoints for closed-won deals over the last 90 to 180 days.
2. Categorize touchpoints by journey stage: first touch, mid-funnel assists, and last touch before conversion.
3. Identify which channels and campaigns consistently appear as high-assist touchpoints but receive little credit in last-click reporting.
4. Build a budget allocation framework that accounts for assist value, not just closing credit. Protect high-assist channels from cuts driven by last-click ROAS data.
Pro Tips
Look for patterns in the journey data that correlate with deal size. High-value deals may follow a different touchpoint sequence than smaller deals. If your attribution platform supports revenue weighting, use it to identify which journey paths produce your most valuable customers, not just your most frequent customers.
5. Use Attribution Data to Cut Underperforming Ad Spend
The Challenge It Solves
Most marketing teams have campaigns running that generate clicks, impressions, and even leads but produce little to no attributed revenue. Without attribution, these campaigns are invisible problems. They consume budget that could be funding campaigns with proven revenue impact, quietly dragging down your overall ROAS while looking acceptable in platform dashboards.
The Strategy Explained
Attribution reporting enables a structured audit of every active campaign tied to downstream revenue outcomes. When you can see which campaigns have generated pipeline and which have generated only surface-level activity, the reallocation decisions become clear. Campaigns with high click volume but zero attributed revenue are not just underperforming. They are actively reducing your overall ROAS by diluting your ad budget. Knowing how to fix attribution discrepancies in your data ensures that your audit is based on accurate numbers rather than reporting artifacts.
This is one of the fastest ways to improve ROAS without increasing total spend. Cutting or pausing low-attribution campaigns and reallocating that budget to campaigns with proven revenue impact can produce meaningful ROAS improvement within a single reporting period. The key is having the data to make those decisions with confidence rather than gut instinct.
Implementation Steps
1. Pull a full campaign performance report from your attribution platform that includes attributed pipeline and revenue alongside standard metrics like spend, clicks, and conversions.
2. Sort campaigns by attributed revenue generated, not by platform-reported conversions or CTR.
3. Flag any campaign that has consumed meaningful budget over the past 60 to 90 days but shows zero or near-zero attributed pipeline.
4. Pause or significantly reduce spend on flagged campaigns and reallocate that budget to your top-performing campaigns by attributed revenue.
Pro Tips
Before cutting a campaign entirely, check whether it appears as an assist touchpoint in your journey data. A campaign with no last-touch attribution might still be contributing to pipeline through awareness or consideration-stage influence. Cut campaigns that show no attribution contribution at any stage of the journey, not just campaigns that fail to close deals directly.
6. Feed Enriched First-Party Data Back to Ad Platforms
The Challenge It Solves
Ad platform algorithms optimize based on the conversion signals they receive. If those signals are incomplete, delayed, or low quality, the algorithm builds audiences and adjusts bids based on a distorted picture of what a valuable conversion looks like. The result is ad delivery that drifts toward audiences that look like your lower-quality conversions rather than your best customers.
The Strategy Explained
Sending enriched first-party data back to Meta and Google via Conversion API creates a feedback loop that improves targeting quality over time. Instead of sending only a basic form fill event, you can send CRM-enriched signals that include deal stage, opportunity value, and even closed-won status. This tells the platform algorithm what a high-value conversion actually looks like, enabling it to optimize toward more of them. Understanding customer attribution tracking at this level of detail is what separates teams that scale efficiently from those that plateau.
The compounding effect is significant. Better signal quality leads to better audience targeting, which leads to higher-quality traffic, which leads to more high-value conversions, which provides even better signal. Over time, this loop drives down cost per acquisition for your most valuable customer segments and pushes ROAS higher without requiring manual intervention on every campaign. Cometly's Conversion API integration is designed to support exactly this kind of enriched data feedback across Meta, Google, and other major ad platforms.
Implementation Steps
1. Identify the highest-value conversion events in your funnel, such as demo bookings from qualified accounts, trial activations, and closed-won deals.
2. Configure your attribution platform to send these enriched events back to Meta and Google via their respective Conversion API integrations.
3. Include CRM data fields such as deal value, company size, or lead score in your event payloads where the platform supports custom parameters.
4. Monitor event match quality scores and audience performance metrics over the following 30 to 60 days to measure the impact on targeting quality.
Pro Tips
The quality of your first-party data matters as much as the quantity. Clean, accurate CRM data with complete contact information produces higher event match quality scores than incomplete records. Invest in CRM data hygiene before scaling your Conversion API integration, and you will see stronger results from the same volume of events.
7. Build a Single Source of Truth for All Marketing Performance
The Challenge It Solves
When you run campaigns across Meta, Google, LinkedIn, and other channels simultaneously, each platform reports its own ROAS using its own attribution methodology. The result is a set of dashboards that all tell different stories and collectively overstate your total conversions because every platform attributes the same deal to itself. Making budget decisions from these siloed reports is like navigating with four different maps that all disagree on where the roads are.
The Strategy Explained
A unified attribution platform normalizes performance data from all your ad channels under a single, consistent attribution model. Instead of comparing Meta's last-click ROAS against Google's view-through ROAS against LinkedIn's self-reported numbers, you see every channel evaluated on the same terms. This eliminates double-counting, surfaces accurate cross-channel attribution for marketing ROI, and gives you the confidence to make budget decisions that reflect reality.
The strategic benefit extends beyond cleaner reporting. When all your campaign data lives in one place with consistent attribution applied, you can identify cross-channel patterns that are invisible in siloed dashboards. You might discover that prospects who see a LinkedIn ad before clicking a Google search ad convert at a significantly higher rate, which has direct implications for how you sequence your campaigns and allocate budget across channels. A platform like Cometly brings together data from 70 or more native integrations to create exactly this kind of unified performance view for B2B SaaS marketing teams.
Implementation Steps
1. Audit your current reporting setup and identify how many separate dashboards or tools your team uses to evaluate campaign performance.
2. Connect all active ad platforms to a centralized attribution platform that applies a consistent attribution model across channels.
3. Establish a single reporting view that shows spend, attributed pipeline, and attributed revenue for every channel side by side.
4. Retire or deprioritize platform-native ROAS reports for budget decisions, and use your unified attribution data as the authoritative source.
Pro Tips
Involve your entire marketing team in the transition to unified reporting. If individual channel owners continue to rely on platform-native reports for their performance reviews, you will have two competing narratives. Align everyone on the unified attribution data as the shared standard for evaluating performance, and build team incentives around attributed revenue rather than platform-reported metrics.
Putting It All Together
Improving ROAS is not about spending more. It is about spending smarter. Each of these seven strategies gives you a different lever to pull, but they all point to the same outcome: connecting your ad investment to real revenue so you can make better decisions faster.
Start with the strategies that address your biggest blind spots. If you are still relying on last-click attribution, that is your highest-leverage fix. If your conversion tracking has gaps due to ad blockers or iOS restrictions, server-side tracking should be your next priority. Once your data foundation is solid, move into budget reallocation, journey mapping, and signal enrichment.
Think of it as building in layers. First-party data and server-side tracking give you accurate inputs. Multi-touch attribution and journey mapping give you the right analytical lens. Revenue-based optimization and spend audits give you the decision framework. And a unified attribution platform ties it all together into a system you can trust.
The teams that win on paid advertising are not the ones with the biggest budgets. They are the ones who know exactly where every dollar goes and what it returns. That level of clarity is achievable, and it starts with the right attribution foundation.
Cometly is built to support every one of these strategies. It connects your ad platforms, CRM, and website to give you a complete picture of what is driving revenue. From multi-touch attribution to server-side tracking and AI-powered recommendations, Cometly gives B2B SaaS marketing teams the tools to improve ROAS with confidence. Get your free demo today and start capturing every touchpoint to maximize your conversions.