Most B2B SaaS marketing teams are making decisions based on an incomplete picture of how their customers actually behave. They know someone clicked an ad. They know someone eventually signed a contract. But everything in between is a black box.
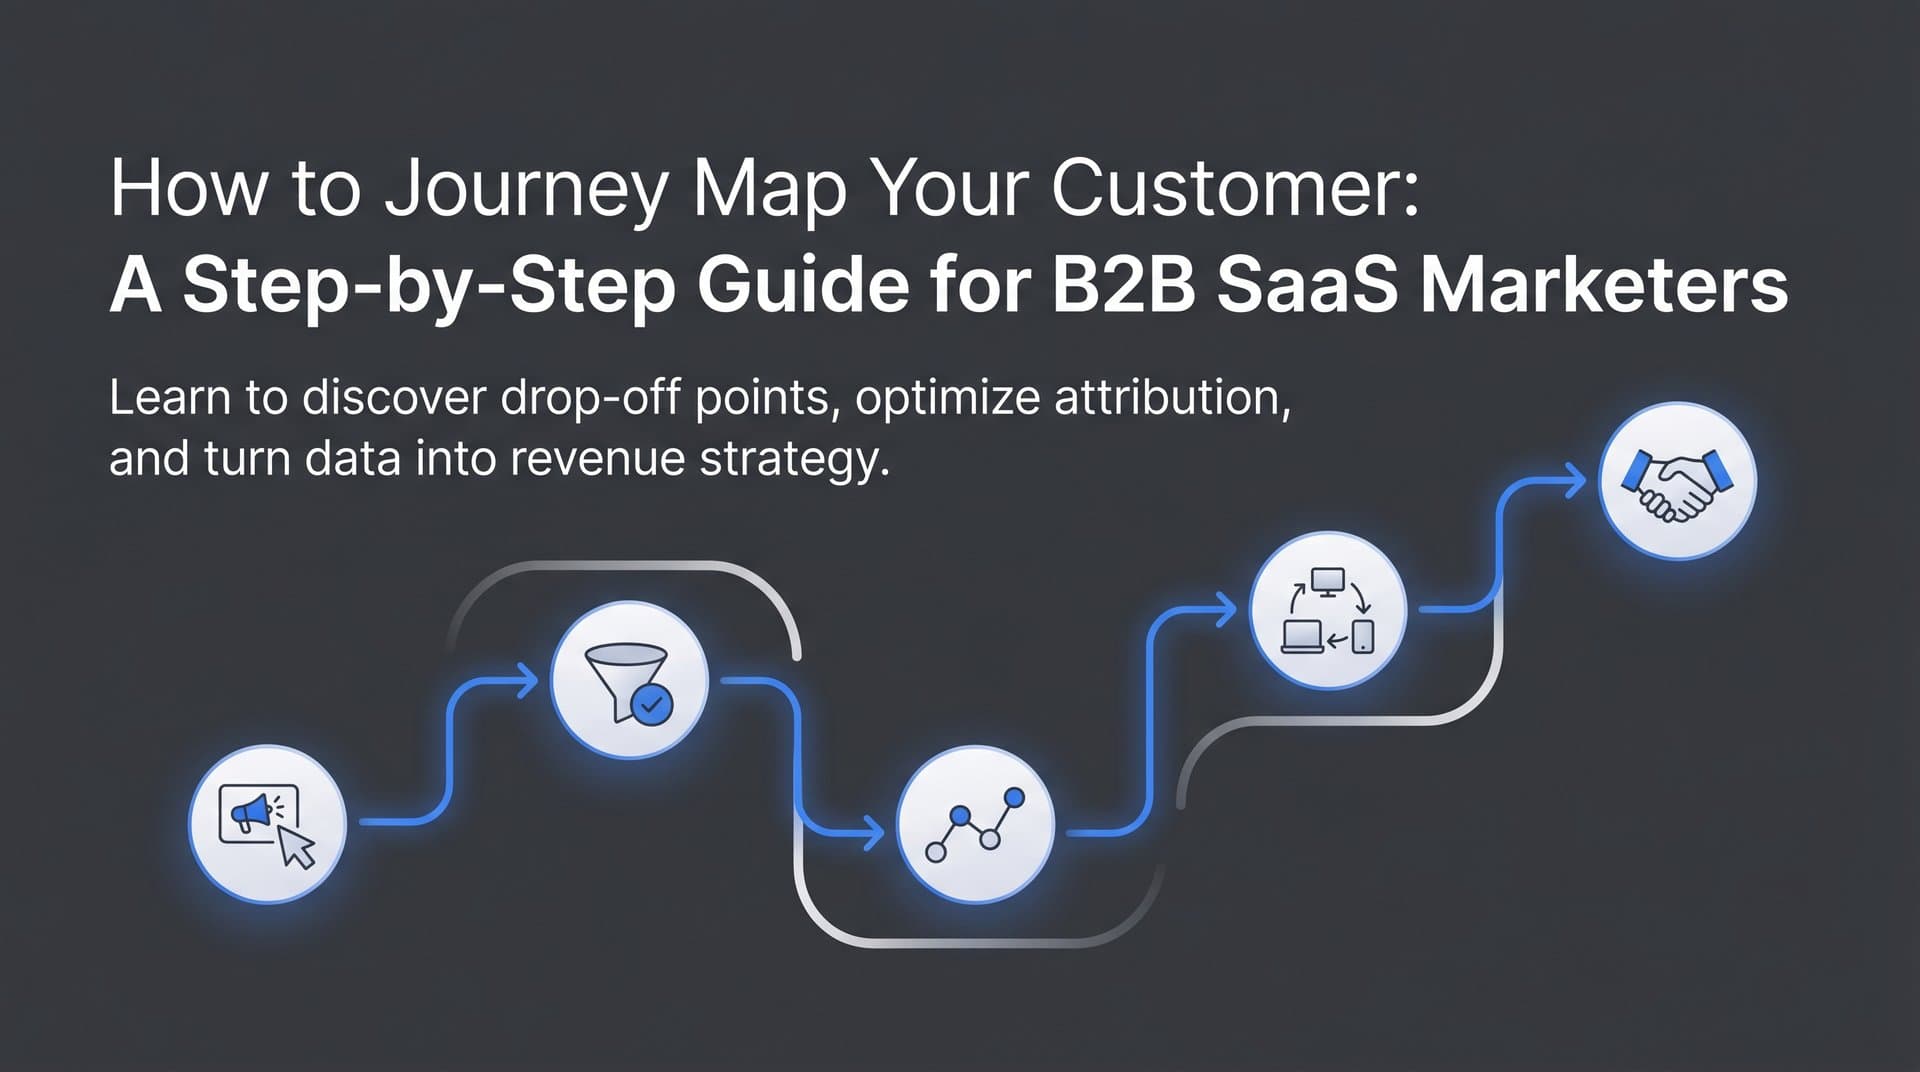
That gap is exactly where customer journey mapping comes in. A journey map customer exercise gives your team a structured, visual representation of every touchpoint a prospect experiences from the moment they first discover your brand to the moment they become a paying customer and beyond.
For B2B SaaS companies running paid ads across multiple channels, this is not just a UX exercise. It is a revenue strategy. When you understand the full journey, you can identify where leads drop off, which channels are actually driving pipeline, and where your attribution data needs to be stronger.
This guide walks you through building a customer journey map from scratch, with a focus on making it actionable for marketing and growth teams. You will learn how to gather the right data, define your stages, identify key touchpoints, and connect your map to real attribution insights so every decision you make is grounded in evidence.
By the end, you will have a repeatable framework your team can use to optimize campaigns, improve conversion rates, and scale what is working.
Step 1: Define Your Ideal Customer Profile and Buyer Persona
Before you draw a single line on your journey map, you need to know exactly who you are mapping. A journey map is only as useful as the persona it represents. If your ICP is vague, your map will be vague, and your conclusions will lead you in the wrong direction.
Start by pulling data from your CRM. Look at your best customers, the ones with the highest contract values, lowest churn rates, and shortest sales cycles. What job titles are represented? What company sizes and industries appear most often? What deal sizes are typical? This data gives you a factual foundation rather than a marketing team's best guess.
Next, conduct interviews with five to ten recent customers. These conversations are irreplaceable. Ask them what triggered their search for a solution, what alternatives they considered, who else was involved in the buying decision, and what ultimately pushed them to choose your product. The language they use to describe their pain points is often more valuable than the answers themselves.
In B2B SaaS, the buying committee structure matters enormously. A champion might discover your product, but a CFO might control the budget, and an IT leader might need to approve the security review. Each of these stakeholders has a different journey, different concerns, and different touchpoints. Your map needs to account for all of them, or at minimum, the primary decision-maker and the key influencer.
Common pitfall: Building a persona based on internal assumptions rather than real data. It is tempting to describe your ideal customer based on who you want to sell to rather than who actually buys from you. Ground every attribute in CRM data or direct interviews.
Success indicator: You have a one-page ICP document that includes firmographic data, role-based pain points, primary goals, and buying committee structure. Your sales and marketing teams have both reviewed it and agreed it reflects reality.
Step 2: Define the Stages Your Customer Moves Through
Once you know who you are mapping, you need to define the structure of the journey itself. For B2B SaaS, five core stages cover most customer experiences: Awareness, Consideration, Decision, Onboarding, and Retention.
Awareness is where a prospect first realizes they have a problem worth solving or discovers your brand for the first time. Consideration is where they actively evaluate solutions, compare vendors, and build internal consensus. Decision is where the final purchase choice is made. Onboarding is the critical post-purchase phase where the customer activates and starts seeing value. Retention is the ongoing relationship that drives expansion revenue and referrals.
Here is where B2B SaaS differs significantly from B2C: the Consideration stage is often longer and more complex. It can involve multiple product demos, a free trial period, security reviews, procurement processes, and several rounds of internal stakeholder sign-off. Mapping this stage in detail is worth the extra effort because it is where most deals are won or lost.
For each stage, define what the customer is thinking, feeling, and doing, not just what your marketing team is doing. The customer perspective is what makes a journey map genuinely useful. A stage that says "we send three nurture emails" is less valuable than one that says "the prospect is comparing two vendors and trying to build an internal business case."
Align your journey stages to your existing CRM pipeline stages wherever possible. This connection is what allows your map to be validated with real data rather than remaining a theoretical document. If your CRM has a "Demo Scheduled" stage, that maps to the Consideration phase. If it has "Proposal Sent," that maps to the Decision phase. The closer the alignment, the more actionable your map becomes.
Common pitfall: Skipping the post-purchase stages. Many marketing teams stop the map at the point of sale. For SaaS businesses where revenue is recurring, Retention and Expansion belong on the map because they represent significant revenue opportunity and are influenced by early marketing decisions.
Success indicator: Each stage has a clear entry condition and exit condition that both your sales and marketing teams agree on. There is no ambiguity about when a prospect moves from one stage to the next.
Step 3: Map Every Touchpoint Across Channels
With your stages defined, the next task is to identify every channel and interaction point where a prospect or customer encounters your brand at each stage. This is where the map starts to get detailed, and the detail is what makes it valuable.
Think across all channel categories. Paid channels include Google Ads, LinkedIn Ads, and Meta campaigns. Organic channels include SEO-driven content, YouTube, and social media. Direct outreach includes SDR emails, cold calls, and LinkedIn messages. Product touchpoints include the trial experience, onboarding emails, and in-app messaging. And then there are the channels your team does not control: G2 reviews, Capterra listings, community forums, peer recommendations, and word of mouth.
That last category is one most teams underestimate. Prospects often visit review sites before they ever visit your website. They ask peers in Slack communities before they book a demo. These touchpoints influence the journey even though they do not appear in your ad platform dashboards.
Use your attribution data to ground this exercise in reality. Rather than listing every possible touchpoint theoretically, look at the paths of customers who actually converted. Which channels appear most frequently? Which ones appear early in the journey versus late? This analysis separates the touchpoints that matter from the ones that feel important but rarely show up in winning paths.
Separate your touchpoints by their role in the journey. First-touch touchpoints create awareness and bring prospects into the funnel for the first time. Mid-funnel touchpoints build consideration and nurture intent. Last-touch touchpoints are the final interactions before a decision is made. Understanding this distinction is foundational to applying the right attribution model, which you will address in the next step.
Multi-touch attribution models distribute credit across all of these touchpoints rather than assigning all value to one. This matters because a prospect who converts after seeing a LinkedIn ad, reading three blog posts, attending a webinar, and then clicking a Google retargeting ad was influenced by all of those interactions, not just the last one.
Common pitfall: Only mapping touchpoints your team directly controls. The most influential touchpoints in a B2B buying journey are sometimes the ones you have the least visibility into, which is exactly why closing attribution gaps matters so much.
Success indicator: You have a complete list of touchpoints at each stage, including third-party channels, with data on which ones appear most frequently in the paths of customers who converted to closed-won deals.
Step 4: Layer in Real Attribution Data to Validate the Map
A journey map without data is a hypothesis. This step is what transforms it into a strategic asset. Without real attribution data layered in, your map reflects what your team believes is happening rather than what is actually happening.
The starting point is connecting your data sources. Your ad platforms, CRM, and website analytics need to be unified into a single view. When these systems are siloed, you end up with partial pictures. Your ad platform shows clicks and conversions. Your CRM shows pipeline stages and deal outcomes. Your website analytics shows sessions and page views. But none of them alone shows you the full path a customer took from first ad impression to closed revenue.
Server-side conversion tracking and first-party data are particularly important in B2B SaaS. Sales cycles can run for weeks or months, which means browser-based tracking frequently fails. Cookies expire. Prospects switch devices. Ad blockers prevent pixels from firing. Server-side tracking captures events at the data layer rather than the browser level, which means it records touchpoints that would otherwise disappear from your data entirely. In longer sales cycles, this is not a minor improvement. It is the difference between an accurate map and a misleading one.
Once your data is connected, analyze the customer paths of your best-fit, closed-won customers. Look for patterns. What is the most common sequence of touchpoints that precedes a conversion? Do customers who engage with a specific piece of content close at a higher rate? Do leads from certain campaigns stall at a particular pipeline stage more often than others?
Also look for gaps. If your journey map shows a touchpoint that should be happening but your attribution data shows no tracking coverage for it, that is a blind spot. Blind spots distort your understanding of the journey and lead to misallocated budget. A channel that appears to have low impact might actually be highly influential but simply unmeasured.
Cometly connects your ad platforms, CRM events, and website data in real time so you can see the actual paths customers take from first ad click to closed revenue. Instead of piecing together data from multiple disconnected tools, you get a unified view of the customer journey that fills in the gaps that surface-level analytics miss.
Common pitfall: Relying only on last-click attribution data. Last-click models make your map inaccurate by over-crediting the final touchpoint and ignoring all of the earlier interactions that built intent and moved the prospect through the funnel.
Success indicator: For your top customer segment, you can identify the three to five most common touchpoint sequences that precede a conversion. These sequences become the backbone of your campaign and content strategy.
Step 5: Find the Drop-Off Points That Are Costing You Revenue
Knowing where prospects enter your funnel is valuable. Knowing where they leave is where the real optimization opportunities live. This step focuses on identifying the friction points in your journey that are silently killing conversions.
Start by reviewing your funnel conversion rates at each stage transition. What percentage of prospects move from Awareness to Consideration? From Consideration to Decision? From Decision to Onboarding? Each transition rate tells you something about the health of that part of the journey. A sharp drop at any stage signals a problem worth investigating.
Cross-reference those drop-off points with your touchpoint map. If a large percentage of prospects drop off after a demo, is there a specific channel source that correlates with post-demo churn? Are leads from certain ad campaigns more likely to ghost after the first sales call? Segmenting your drop-off analysis by channel source reveals whether the issue is the experience itself or the quality of the traffic being sent into it.
Pipeline velocity data adds another dimension. Some prospects do not formally drop off. They simply stall. A deal that has been in the Consideration stage for sixty days without movement is experiencing friction, even if it has not been marked as lost. Slow stages signal problems that conversion rate data alone will not surface.
Qualitative data is essential here. Lost-deal interviews and win/loss analysis give you the context that quantitative data cannot provide. A prospect might have dropped off after the demo not because the demo was poor, but because a competitor offered a more favorable pricing structure. You would never know that from conversion rate data alone.
Common pitfall: Focusing exclusively on top-of-funnel drop-off. In B2B SaaS, mid-funnel churn during the trial or post-demo phase and post-purchase churn during onboarding often have a larger revenue impact than awareness-stage drop-off. Map the entire funnel before deciding where to focus.
Success indicator: You have ranked your top three drop-off points by revenue impact and have a hypothesis for why each one occurs, supported by both quantitative data and qualitative input from customer or lost-deal interviews.
Step 6: Build the Visual Map and Align Your Team Around It
You now have the raw material for a powerful customer journey map. The next step is turning that material into a format your team can actually use, reference, and act on together.
Choose a format that fits how your team works. A spreadsheet grid works well for data-heavy teams who want to layer in metrics directly. Dedicated journey mapping tools offer more visual flexibility. Collaborative whiteboard platforms are useful for the initial working session when you are gathering cross-functional input. The format matters less than the discipline of keeping it updated and accessible.
Structure your map with journey stages as columns. Within each column, include rows for: what the customer is doing at that stage, which touchpoints they are encountering, what they are thinking and feeling, where the pain points and friction are, and what opportunities exist to improve the experience. This structure keeps the map customer-centric rather than internally focused.
Add your attribution data and drop-off rates directly into the map. A journey map that includes real conversion rates at each stage transition, the most common touchpoint sequences for winning customers, and the identified friction points is a living dashboard. It is far more useful than a static diagram that describes the journey in theory.
Critically, do not build this map in isolation within the marketing team. Run a working session with your sales, marketing, and product teams together. Sales leaders observe the Consideration and Decision stages up close every day. Product teams see what happens during Onboarding and Retention. Their input will improve the accuracy of your map and create the cross-functional buy-in that turns a document into a shared operating model.
Assign ownership for each stage of the journey. Marketing might own Awareness and Consideration. Sales owns Decision. Customer success owns Onboarding and Retention. When each stage has a clear owner, there is accountability for improving the experience and tracking outcomes over time.
Common pitfall: Treating the map as a marketing team deliverable rather than a company-wide asset. The more cross-functional input you gather, the more accurate and actionable the map becomes.
Success indicator: Every team member who touches the customer journey can reference the map, understands their role in it, and knows what metrics they are responsible for improving.
Step 7: Turn Your Journey Map Into Campaign and Attribution Actions
A journey map that lives in a folder and never changes anything is a wasted effort. This final step is about converting your map into concrete decisions that improve your campaigns, your attribution setup, and ultimately your revenue.
Start with a campaign coverage audit. Look at each stage of the journey and ask: are we running ads and publishing content at every stage where our prospects are actively researching? Many B2B SaaS teams are heavily invested in bottom-of-funnel campaigns because those are easiest to attribute to revenue. But if prospects are forming opinions and building shortlists at the Consideration stage without encountering your brand, you are losing deals before they even reach your sales team.
Identify stages where you have high drop-off but low ad investment. These are likely under-resourced parts of the funnel worth testing. If your map shows that prospects frequently stall between the demo and the decision, but you have no retargeting campaigns or nurture content targeting that specific stage, you have found a clear opportunity.
Update your attribution model based on what the journey map reveals. If your data shows that a specific mid-funnel touchpoint, such as a webinar or a comparison page visit, consistently appears in the paths of customers who convert, that touchpoint deserves more credit in your attribution model than a last-click approach would give it. Your model should reflect where real influence happens, not just where the final click occurred.
Use your map to prioritize which conversion events to track and send back to your ad platforms via Conversion API integrations. Ad platform algorithms optimize toward the signals you send them. If you are only sending last-click purchase events, the algorithm optimizes for clicks, not for the high-quality leads that actually close. Sending richer, more meaningful conversion signals, such as demo completions, trial activations, or CRM opportunity creations, trains the algorithm to find more of the right prospects.
Cometly allows you to send enriched, conversion-ready events back to Meta, Google, and other platforms so their algorithms optimize toward the touchpoints and audiences that actually drive revenue. Instead of feeding ad platforms surface-level click data, you give them the full picture of what a valuable conversion looks like for your business.
Finally, set a quarterly cadence to revisit and update the journey map. Customer behavior changes. Your product evolves. Market conditions shift. A journey map that was accurate six months ago may no longer reflect how your best customers are finding and evaluating you today.
Common pitfall: Treating the journey map as a one-time deliverable. The teams that get the most value from journey mapping are the ones that treat it as a living document, updated regularly with fresh attribution and pipeline data.
Success indicator: You have made at least one concrete change to your campaign strategy or attribution setup based on what the journey map revealed, and you have a scheduled date for the next review.
Putting It All Together: Your Journey Map Checklist
Building a customer journey map is one of the highest-leverage exercises a B2B SaaS marketing team can complete. It forces alignment between what you assume is happening and what is actually happening in your pipeline. It reveals where budget is being wasted, where leads are being lost, and where the real opportunities for growth are hiding.
Here is a quick checklist to confirm you have covered the key steps:
1. You have defined a specific ICP grounded in real CRM data and direct customer interviews.
2. You have mapped all five journey stages with clear entry and exit conditions that sales and marketing both agree on.
3. You have listed every touchpoint across paid, organic, direct, and third-party channels.
4. You have layered in real attribution data to validate the map against actual customer paths.
5. You have identified your top three drop-off points by revenue impact and formed a hypothesis for each.
6. You have built a visual map that your full go-to-market team has reviewed and contributed to.
7. You have translated the map into specific campaign and attribution actions with a quarterly review cadence.
The most important thing to remember is that a journey map is only as good as the data behind it. If your tracking has gaps, your map will have gaps, and your decisions will reflect those gaps. Platforms like Cometly are built to close those gaps by connecting every ad click, CRM event, and conversion into a single, accurate picture of how your customers actually move from first touch to closed revenue.
Ready to elevate your marketing with precision and confidence? Discover how Cometly's AI-driven recommendations can transform your ad strategy. Get your free demo today and start capturing every touchpoint to maximize your conversions.