Most B2B SaaS marketing teams operate with a fragmented view of how prospects move from first awareness to paid customer. They know traffic numbers, they track form fills, but they rarely understand the full arc of the product journey. That gap is expensive.
When you cannot see which touchpoints actually move buyers forward, you end up investing in channels that look productive on the surface but contribute little to revenue. Paid campaigns get credit for leads they did not really generate. Organic content that warms up prospects for weeks goes unrecognized. Sales follows up on leads that were never ready to begin with.
A product journey map solves this. It gives your team a shared, structured view of every stage a buyer moves through, from the moment they encounter your brand to the point they become a loyal, expanding customer. More importantly, it connects that journey to the marketing and product data you already have, so decisions stop being based on gut feel and start being grounded in evidence.
Think of it like building a map before a road trip. You might know your starting point and your destination, but without a clear route, you are guessing at every turn. A product journey map gives you the route, and attribution data tells you which roads are actually worth taking.
This guide walks you through how to build a product journey map designed specifically for B2B SaaS companies. You will learn how to define the stages that matter for your business, gather the right data to validate each stage, identify where buyers stall or drop off, and connect your journey map to attribution data so you can see which campaigns and channels are actually driving progression.
By the end, you will have a working product journey map that your marketing, sales, and product teams can use as a shared source of truth for growth decisions. Let's get into it.
Step 1: Define the Stages of Your Product Journey
Before you can map anything, you need to agree on what the map actually covers. This sounds obvious, but it is where most teams go wrong. They either borrow a generic funnel framework that does not reflect how their buyers actually behave, or they create so many stages that the map becomes too granular to act on.
For B2B SaaS, the product journey typically spans two distinct phases: the marketing journey, which covers everything before a prospect signs up or requests a demo, and the product journey, which covers everything that happens after. Mapping both together is what makes a product journey map more powerful than a traditional marketing funnel. Understanding the full B2B customer journey is what separates teams that grow predictably from those that guess their way through every quarter.
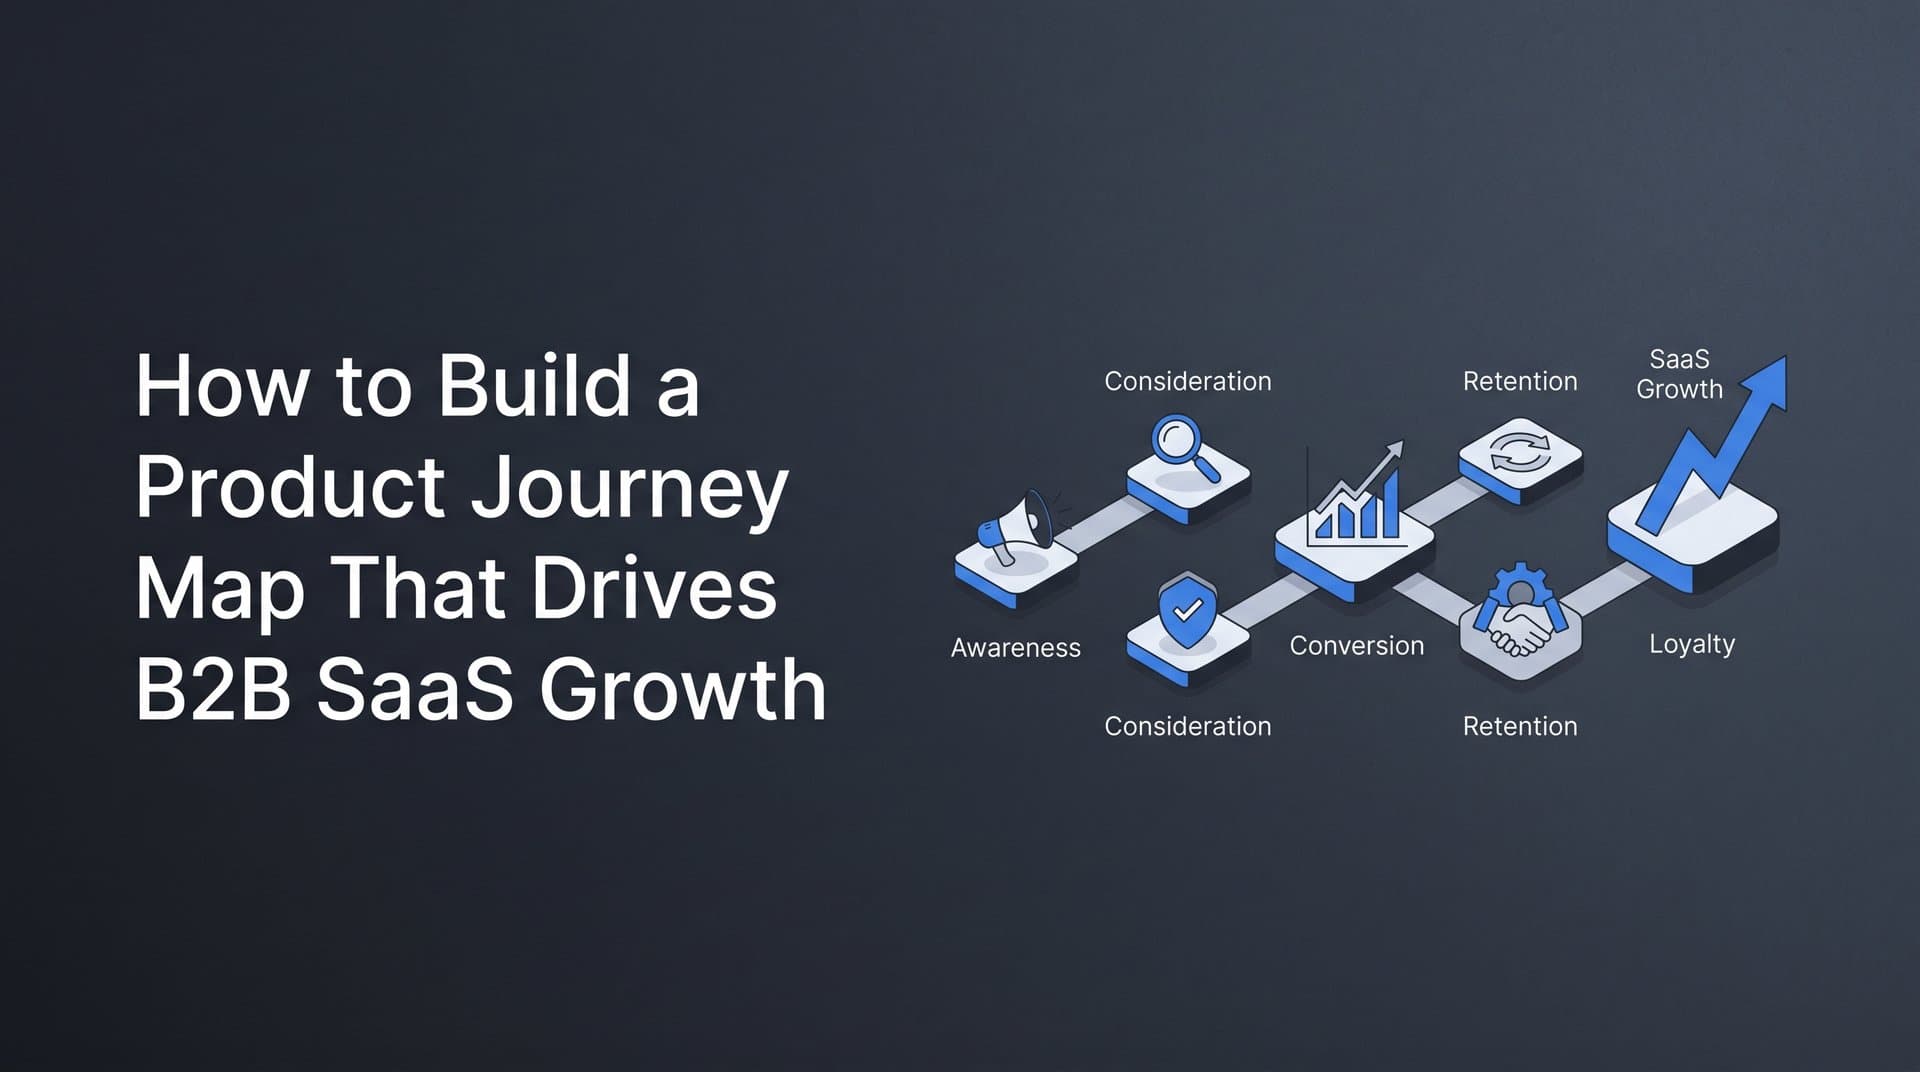
Here are the core stages to consider as your starting point:
Awareness: The buyer discovers your product through a paid ad, a piece of content, a referral, or organic search. They may not yet know they have a problem you can solve.
Consideration: The buyer is actively researching solutions. They visit your pricing page, read reviews on G2 or Capterra, and compare you against alternatives.
Trial or Demo: The buyer takes a direct action to evaluate your product. This might be requesting a demo, starting a free trial, or signing up for a freemium tier.
Activation: The buyer reaches a meaningful value moment inside your product. This is the stage most commonly ignored by marketing teams, even though it is often the deciding factor in whether a trial converts to a paid plan.
Conversion: The buyer becomes a paying customer.
Retention: The customer continues using the product, renewing their subscription, and deriving ongoing value.
Expansion: The customer upgrades, adds seats, or expands their usage in ways that increase revenue.
Now, here is where you need to be thoughtful. These seven stages are a starting framework, not a template to copy verbatim. If you run a sales-led model, your "Trial or Demo" stage looks very different from a product-led growth company where self-serve trial is the primary entry point. If you run a hybrid model, you may have parallel paths that need to be reflected in the map.
Tailor stage names and definitions to match how your buyers actually move through your business. The goal is not a textbook-perfect funnel. The goal is a map that every team member can look at and immediately understand.
Aim for five to seven clearly distinct stages. Fewer than five and you lose the nuance needed to identify where things break down. More than seven and you create noise that makes it harder to act on what the map reveals.
The success indicator for this step is simple: every member of your marketing, sales, and product team can name the stages and agree on what moves a buyer from one to the next. If you cannot get alignment on that, the map will not hold up in practice.
Step 2: Gather Behavioral and Attribution Data for Each Stage
A product journey map without data is just a diagram of assumptions. The next step is to ground every stage in actual behavioral and attribution data so the map reflects reality rather than what you wish were true.
Start by identifying your data sources. For a complete picture across the full product journey, you typically need to pull from several systems:
Ad platform data: Impressions, clicks, and conversion events from Google Ads, Meta, LinkedIn, and any other paid channels. This covers the top of your journey.
Website analytics: Page visits, session behavior, and form submissions. This tells you how prospects move through your site during the consideration stage.
CRM records: Lead creation, demo requests, deal stages, and closed-won data. This bridges the gap between marketing activity and sales outcomes.
Product usage data: Feature activations, login frequency, and in-app events. This is the data that most marketing teams do not have direct access to, but it is critical for understanding activation and retention.
Conversion events: Specific actions tied to each stage transition, such as a form submission, a trial signup, a first feature use, or a subscription upgrade.
Once you have identified your sources, the next challenge is connecting them. This is where many teams hit a wall. Ad platform data lives in one system, CRM data lives in another, and product usage data lives in a third. Without a way to connect these, you cannot trace a buyer's path from the ad that introduced them to your brand all the way through to the revenue they eventually generated.
This is also where server-side tracking becomes important. Browser-based tracking misses a growing share of conversion events due to ad blockers, iOS privacy restrictions, and third-party cookie limitations. In longer B2B buying cycles, where a prospect might interact with your brand across multiple sessions and devices over several weeks, those gaps compound quickly. Server-side tracking through Conversion APIs, such as Meta's Conversion API or Google's Enhanced Conversions, captures events that would otherwise fall through the cracks.
For each stage in your journey map, identify the specific event that signals a buyer has entered or exited that stage. For example:
Awareness: Ad click or organic landing page visit
Consideration: Pricing page visit, review site click-through, or return session
Trial or Demo: Demo request form submission or trial signup
Activation: First key feature use or completion of onboarding milestone
Conversion: Subscription payment or contract signed
Retention: Renewal or continued active usage past a defined period
Expansion: Upgrade event or seat addition
One critical warning here: relying on last-click attribution alone will distort your picture of which channels are driving journey progression. Last-click models give all the credit to the final touchpoint before conversion, which often means paid search or a direct visit gets credited while the LinkedIn ad that started the conversation three weeks earlier goes unrecognized. For journey mapping purposes, you need attribution data that distributes credit across all touchpoints.
The success indicator for this step is that you have a mapped data source for every stage, with no unexplained gaps between your ad platforms, your website, and your CRM. If you cannot trace a buyer's path from first click to closed revenue, your journey map will have blind spots that lead to bad decisions.
Step 3: Map Touchpoints to Each Journey Stage
Now that you have your stages defined and your data sources connected, it is time to map the specific touchpoints that influence buyer movement at each stage. This is where the journey map starts to become genuinely useful for campaign and budget decisions.
For each stage, list every channel and content type that plays a role in moving buyers forward. This typically includes:
Paid advertising: Search ads, display ads, LinkedIn sponsored content, and Meta retargeting campaigns
Organic content: Blog posts, SEO landing pages, YouTube videos, and podcast appearances
Email sequences: Nurture campaigns, trial onboarding emails, and post-demo follow-up sequences
Sales outreach: Discovery calls, demo presentations, and proposal follow-ups
In-product experience: Onboarding flows, tooltips, in-app messaging, and feature prompts
Customer success: Check-in calls, QBRs, and expansion conversations
The key is to base this mapping on actual attribution data, not assumptions. It is easy to assume that your blog drives awareness and your demo page drives conversion, but the data often tells a more complicated story. A piece of mid-funnel content comparing you to a competitor might be the touchpoint that tips a buyer from consideration to demo request. A LinkedIn retargeting ad might re-engage a prospect who went cold after an initial website visit.
Multi-touch attribution data is your best tool here. Look at which touchpoints appear most frequently in paths that actually lead to conversion, not just which ones appear last. This analysis often surfaces touchpoints that are doing significant work in moving buyers forward but getting little credit under simpler attribution models. Understanding what customer journey touchpoints actually influence purchase decisions is what separates data-driven teams from those still relying on gut feel.
Pay particular attention to commonly overlooked touchpoints. Mid-funnel content like comparison pages and case study landing pages often influences buyers during the consideration stage but is rarely tracked rigorously. LinkedIn retargeting ads frequently re-engage prospects who visited your site but did not convert. In-product onboarding emails and tooltips play a direct role in activation but are rarely connected to marketing attribution data.
Here is where touchpoint mapping earns its value: it reveals which channels are doing the heavy lifting at each stage versus which ones are getting credit they do not deserve. When you can see that a particular campaign consistently appears in the paths of buyers who eventually activate and convert, you have a strong signal to invest more there. When you can see that a channel generates a lot of first touches but rarely appears in paths that lead to revenue, that is a signal to reassess.
The success indicator for this step is that each stage in your journey map has at least two to three validated touchpoints backed by actual conversion data, not just marketing intuition.
Step 4: Identify Drop-Off Points and Friction in the Journey
Every product journey has stages where buyers stall or disappear. Identifying exactly where those drop-offs happen, and why, is one of the most actionable outputs of the entire mapping process.
Start by calculating the conversion rate between each stage. What percentage of buyers who reach the awareness stage move into consideration? What percentage of trial signups reach activation? What percentage of activated users convert to paying customers? These stage-to-stage conversion rates will quickly surface where the largest drops occur.
Once you know where the biggest drop-offs are, the next step is to segment that analysis. Not all drop-off is created equal. A buyer who found you through a highly targeted LinkedIn campaign and then dropped off after the demo request is a very different problem from a buyer who clicked a broad awareness ad and never came back. Segmenting drop-off by traffic source, campaign, and audience helps you distinguish between universal product friction and friction that is specific to certain channels or messaging.
One of the most common sources of post-click drop-off is misalignment between ad messaging and product experience. If your ad promises a specific outcome or feature, and the landing page or trial experience does not immediately deliver on that promise, buyers will disengage. This is not a product problem. It is a messaging problem, and it shows up clearly when you segment drop-off by campaign.
Use funnel analytics to distinguish between two different types of stalling. Some buyers stall because they hit genuine product friction: the onboarding is confusing, a key feature is hard to find, or the product does not clearly demonstrate value in the first session. Other buyers stall because the follow-up process breaks down: no nurture email sequence, no sales outreach after a demo request, no re-engagement campaign for trial users who went quiet.
Both types of friction are fixable, but they require very different solutions. Product friction requires changes to onboarding, UX, or feature design. Follow-up friction requires changes to your marketing automation, sales process, or retargeting strategy. Conflating the two leads to wasted effort.
A common pitfall here is treating all drop-off as a product problem when much of it may stem from poor targeting or mismatched ad creative. If your paid campaigns are bringing in buyers who are not a strong fit for your product, no amount of onboarding improvement will fix the drop-off at the activation stage. Understanding the aha moment in B2B SaaS product adoption can help you identify what value signals buyers need to experience before they commit. The fix starts upstream, in the targeting and messaging of the campaigns that bring those buyers in.
The success indicator for this step is that you can name the top two or three stages where buyers most commonly stall and have a clear hypothesis about whether the root cause is product friction, messaging misalignment, or a gap in follow-up.
Step 5: Connect Your Journey Map to Revenue Attribution
A product journey map that stops at leads or signups is only telling you half the story. The stages you have mapped represent activity. What you actually need to know is which paths through those stages generate revenue, and at what cost.
This is where revenue attribution transforms the journey map from a useful diagram into a decision-making tool.
Start by connecting your ad spend data to pipeline and closed-won revenue. This means linking the campaigns and channels that brought buyers into the journey to the actual deals those buyers eventually became. When you can see that a specific LinkedIn campaign contributed to a set of deals worth a certain amount of pipeline, you can calculate the revenue return on that campaign's spend with real accuracy.
Pipeline attribution takes this a step further. Rather than waiting for deals to close before assigning credit, pipeline attribution connects marketing touchpoints to the value of deals currently in your pipeline. This gives you a forward-looking view of which campaigns are generating not just leads but revenue-quality opportunities. It also helps you make smarter budget decisions in real time rather than waiting for end-of-quarter reporting.
To make this work, you need to integrate your payment or CRM data with your ad platform data. This is the connection that most marketing teams are missing. CRM data tells you which leads became customers and what those deals were worth. Ad platform data tells you which campaigns and touchpoints those leads interacted with. Connecting the two gives you a full-funnel view from first click to closed revenue. Building a robust customer journey tracking system is what makes this connection reliable and scalable over time.
This connection also changes how you evaluate channel performance. Instead of comparing channels by cost per lead, you can compare them by revenue per dollar spent. A channel that generates expensive leads but closes at a high rate with high deal values may be far more efficient than a channel that generates cheap leads that rarely convert or expand.
One of the most common mistakes at this stage is stopping attribution at the lead stage. When you optimize for lead volume or cost per lead, you are optimizing for a metric that may have little relationship to actual revenue. Marketing teams that do this often find themselves celebrating campaigns that generate lots of activity but contribute little to the bottom line, while underinvesting in campaigns that generate fewer but far more valuable buyers.
A platform like Cometly is built specifically to make this connection. It links ad platform data, CRM events, and product conversions into a single view so you can see which campaigns are driving pipeline and revenue, not just clicks and form fills. With Stripe revenue integration and 70+ native integrations, Cometly pulls together the data from across your stack so the journey map stays grounded in actual revenue outcomes.
The success indicator for this step is that you can identify which campaigns generate the highest revenue per dollar spent, not just the lowest cost per lead. If you can answer that question with confidence, your journey map is connected to the metrics that actually matter.
Step 6: Build the Visual Map and Share It Across Teams
You have defined your stages, gathered your data, mapped your touchpoints, identified your drop-off points, and connected everything to revenue. Now it is time to turn all of that into something your entire organization can actually use.
The format matters less than you might think. A well-structured spreadsheet can be just as effective as a beautifully designed diagram in Miro or Figma. What matters is that the format is accessible to everyone who needs to use it: marketing, sales, and product teams alike. Choose the format that your teams will actually open and reference, not the one that looks most impressive in a presentation. Exploring dedicated customer journey mapping tools can help you find a format that your whole team will actually adopt and maintain.
For each stage in the visual map, include the following elements:
Stage name: The agreed-upon label that every team uses consistently
Key buyer actions: What the buyer is doing at this stage, from their perspective
Primary touchpoints: The channels and content types that influence movement through this stage
Responsible team: Which team owns this stage: marketing, sales, or product
Conversion metric: The specific event or rate that measures progress through this stage
Known friction points: The drop-off patterns or obstacles you have identified at this stage
Here is the most important thing to get right about the visual map: it is a living document, not a one-time deliverable. Buyer behavior changes. New channels emerge. Product updates shift activation patterns. A journey map that is accurate today may be misleading in six months if it is not updated as new data comes in. Build a cadence for reviewing and updating the map, whether that is monthly or quarterly, and assign someone to own that process.
Sharing the map across teams is what gives it organizational value. When marketing, sales, and product all work from the same journey map, they stop optimizing for their own isolated metrics and start optimizing for the outcomes that actually matter. Marketing stops celebrating lead volume in isolation. Sales stops treating every lead as equivalent. Product stops building features without understanding where buyers are dropping off before they even reach the product. Leveraging customer journey optimization principles ensures the map drives continuous improvement rather than sitting as a static artifact.
The success indicator for this step is straightforward: the journey map is referenced in at least one recurring team meeting and updated on a regular cadence. If it lives in a slide deck and never gets opened again, it has not done its job.
Putting Your Product Journey Map to Work
Building the map is only the beginning. The value comes from acting on what it reveals.
Here is a quick-reference checklist of the six steps covered in this guide:
1. Define five to seven clearly distinct journey stages aligned with your actual business model
2. Gather behavioral and attribution data from ad platforms, CRM, website analytics, and product usage tools
3. Map validated touchpoints to each stage using multi-touch attribution data, not assumptions
4. Identify the top two or three drop-off points and diagnose whether the root cause is product friction, messaging misalignment, or a gap in follow-up
5. Connect your journey map to pipeline and revenue attribution so you can evaluate channels by revenue quality, not just lead volume
6. Build a visual map that every team can access, and commit to updating it on a regular cadence
Once the map is in place, use it to drive ongoing decisions. Reallocate budget toward the channels that appear most frequently in high-value conversion paths. Improve onboarding for the activation stage where you are seeing the most drop-off. Fix messaging misalignment between your top-of-funnel ads and the experience buyers encounter after they click.
The journey map also becomes your framework for continuous campaign optimization. As attribution data flows in, you can see in real time which channels are driving progression through each stage and which ones are falling short. That feedback loop is what separates teams that scale efficiently from teams that scale spend without scaling results.
Cometly is built to power exactly this kind of attribution-connected journey mapping. It links your ad platform data, CRM events, and product conversions into a single view so you always know which campaigns are driving real revenue, not just activity. With AI-driven recommendations, server-side tracking, and deep integrations across your entire marketing stack, Cometly keeps your journey map grounded in the data that actually reflects how your buyers move.
Ready to see every touchpoint in your product journey connected to real revenue data? Get your free demo and start building a journey map backed by the attribution data your growth decisions deserve.