Every marketing team knows the feeling. You spend weeks running campaigns, optimizing ads, and hitting your internal targets. Then budget season arrives and someone in the boardroom asks a simple question: "What did marketing actually contribute this quarter?" Suddenly, your slide deck full of impressions and click-through rates feels inadequate.
This is not a data problem. It is a translation problem.
Leadership evaluates the business through the lens of pipeline, revenue, and return on investment. When marketing reports arrive filled with engagement metrics and platform-specific jargon, executives are left to make their own connections between marketing activity and business outcomes. Those connections are rarely favorable.
The good news is that this gap is entirely closeable. Marketing teams that invest in the right tracking infrastructure, attribution models, and reporting frameworks can walk into any leadership conversation with a clear, credible story about their contribution to revenue. Not just a story they believe, but one backed by data that finance and sales teams can verify and rely on.
This guide walks you through a seven-step system for proving marketing value to leadership. Each step builds on the last, moving from foundational alignment and tracking setup through customer journey mapping, dashboard design, and boardroom-ready presentations. Whether you are preparing for a quarterly business review, defending your ad budget, or building the case for new tools, this process gives you a repeatable framework that earns credibility over time.
By the end, you will have the structure, the language, and the data infrastructure to change how leadership sees marketing: not as a cost center, but as a measurable driver of growth.
Step 1: Align on the Metrics That Actually Matter to Leadership
Before you build a single report or pull a single data point, you need to answer one question: what does leadership actually use to evaluate marketing performance?
The answer is almost never impressions. It is rarely click-through rate. In most organizations, finance and executive teams think in terms of pipeline generated, customer acquisition cost, revenue influenced, and return on ad spend. If your reports are not built around those numbers, you are reporting to yourself.
The first step is to draw a clear line between vanity metrics and business metrics. Vanity metrics like impressions, reach, and engagement rate are useful for internal optimization. They tell you whether your creative is resonating or your targeting is on point. But they do not appear in revenue forecasts or board decks, which means they do not move the needle in leadership conversations.
Business metrics, on the other hand, answer the questions executives are already asking. How many qualified leads did marketing generate? What percentage of closed revenue was marketing-sourced? What is our cost per acquired customer? These are the numbers that connect marketing activity to business outcomes.
Here is how to get this step right:
Schedule a brief alignment conversation: Sit down with your CFO, VP of Sales, or whoever owns the revenue forecast. Ask them directly which numbers they use to evaluate marketing's contribution. You may be surprised to find they have a very specific answer, and it may not match what you have been reporting.
Clarify shared definitions: Terms like MQL (Marketing Qualified Lead) are common in marketing circles but often misunderstood or undervalued by sales and finance teams. If leadership does not trust or recognize your definitions, your numbers will not land. Agree on what counts as a qualified lead, a marketing-sourced opportunity, and an attributed conversion.
Document the agreed-upon KPIs: Write them down and share them with your team. Every future report, dashboard, and presentation should map back to these definitions. This creates consistency and prevents the "we're measuring different things" objection from derailing future conversations.
Watch out for the language gap: One of the most common pitfalls at this stage is assuming that because you understand a metric, leadership does too. Always confirm. A term that is second nature to a performance marketer may mean nothing to a CFO who is focused on gross margin and customer lifetime value.
When you complete this step, you have a shared vocabulary and a clear target. Every subsequent step in this process is built on that foundation.
Step 2: Set Up Accurate Cross-Channel Tracking
Here is a hard truth: if your data is wrong, your case falls apart. You can have the most compelling narrative in the room, but if a skeptical CFO pokes a hole in your numbers, you lose credibility fast. Accurate tracking is not just a technical requirement. It is the foundation of your entire argument.
The challenge is that modern tracking is genuinely difficult. iOS privacy updates, ad blockers, and cookie deprecation have made browser-based tracking increasingly unreliable. Conversions that happen after a user clicks an ad but before a cookie fires often go unrecorded. The result is that marketing looks less effective than it actually is, which is exactly the wrong story to tell leadership.
Server-side tracking solves this problem. Instead of relying on a pixel in the browser to fire and record a conversion, server-side tracking captures the event at the server level, where ad blockers and browser restrictions cannot interfere. This produces more complete, more accurate conversion data, which in turn produces a more accurate picture of marketing performance.
Beyond fixing the tracking gaps, you also need to consolidate your data. Most marketing teams run campaigns across multiple platforms: Meta, Google, LinkedIn, and potentially others. Each platform has its own reporting interface, its own attribution window, and its own methodology for claiming credit. When you add up the conversions each platform reports, the total almost always exceeds your actual conversion count. Every platform is claiming full credit for the same customers.
To prove marketing value to leadership, you need a single, deduplicated view of performance across all channels. Here is how to build it:
Connect all paid platforms to a single attribution source: Use a third-party attribution tool that pulls data from Meta, Google, LinkedIn, and any other active channels into one place. This gives you a neutral view that is not inflated by platform-level double-counting.
Implement server-side tracking: Set up server-side event tracking to capture conversions that browser-based tools miss. Cometly's server-side tracking is built specifically for this purpose, ensuring that every meaningful conversion event is recorded regardless of the user's browser settings or device.
Sync conversion data back to ad platforms: Use Cometly's Conversion Sync to send enriched, first-party conversion data back to Meta and Google. This does two things: it ensures the data feeding your reports matches what the platforms are optimizing against, and it improves the quality of signals the platform algorithms use for targeting. Better signals mean better performance, which means better results to report.
Connect your CRM: Make sure CRM events, such as opportunity creation, deal stages, and closed-won revenue, are tied to the same tracking system as your website conversion events. This is what allows you to track campaigns across every channel and connect an ad click to a closed deal weeks or months later.
The success indicator for this step is straightforward: every touchpoint from first ad click to closed deal should appear in a single customer journey view. When you can see the full path, you can tell the full story.
Step 3: Map the Full Customer Journey to Revenue
Most buyers do not convert the first time they encounter your brand. They click a social ad, read a blog post, attend a webinar, see a retargeting ad, and eventually fill out a form or book a call. The journey from first touch to closed deal often spans weeks, multiple channels, and several distinct interactions.
If you are only measuring the last click, you are only seeing the final step of that journey. And you are giving all the credit to the channel that happened to be last, while ignoring every channel that built the relationship along the way.
This is where multi-touch attribution becomes essential. Instead of assigning 100 percent of the credit to one touchpoint, multi-touch models distribute credit across every meaningful interaction in the customer journey. This gives you a much more accurate picture of which channels and campaigns are actually driving results.
Understanding the differences between attribution models helps you choose the right one for your reporting context:
First-touch attribution gives all the credit to the first interaction a customer had with your brand. This is useful for understanding which channels are best at generating awareness and bringing new prospects into the funnel.
Last-touch attribution gives all the credit to the final interaction before conversion. This is the default model in most ad platforms and systematically undervalues top-of-funnel channels like paid social and content marketing.
Linear attribution distributes credit equally across all touchpoints in the journey. This is a balanced starting point and easy to explain to leadership who are new to multi-touch thinking.
The most important thing is to use a model that reflects how your buyers actually behave, and to be consistent so that trends over time are comparable.
Once you have chosen your model, the next step is connecting your CRM data so that pipeline stages and closed-won deals tie back to specific campaigns. When you can show that a particular LinkedIn campaign appears in the early journey of your highest-value customers, or that a specific Google search campaign consistently drives the lowest cost per opportunity, you are telling leadership something they cannot get from platform reports alone.
The common pitfall at this stage is relying on platform-reported attribution. Meta says it drove 200 conversions. Google says it drove 180. LinkedIn says it drove 90. But you only closed 150 deals. Each platform is using its own attribution window and claiming full credit for shared customers. A neutral third-party attribution tool like Cometly gives you the deduplicated, accurate view that is actually defensible in a leadership conversation.
Step 4: Build a Revenue-Connected Marketing Dashboard
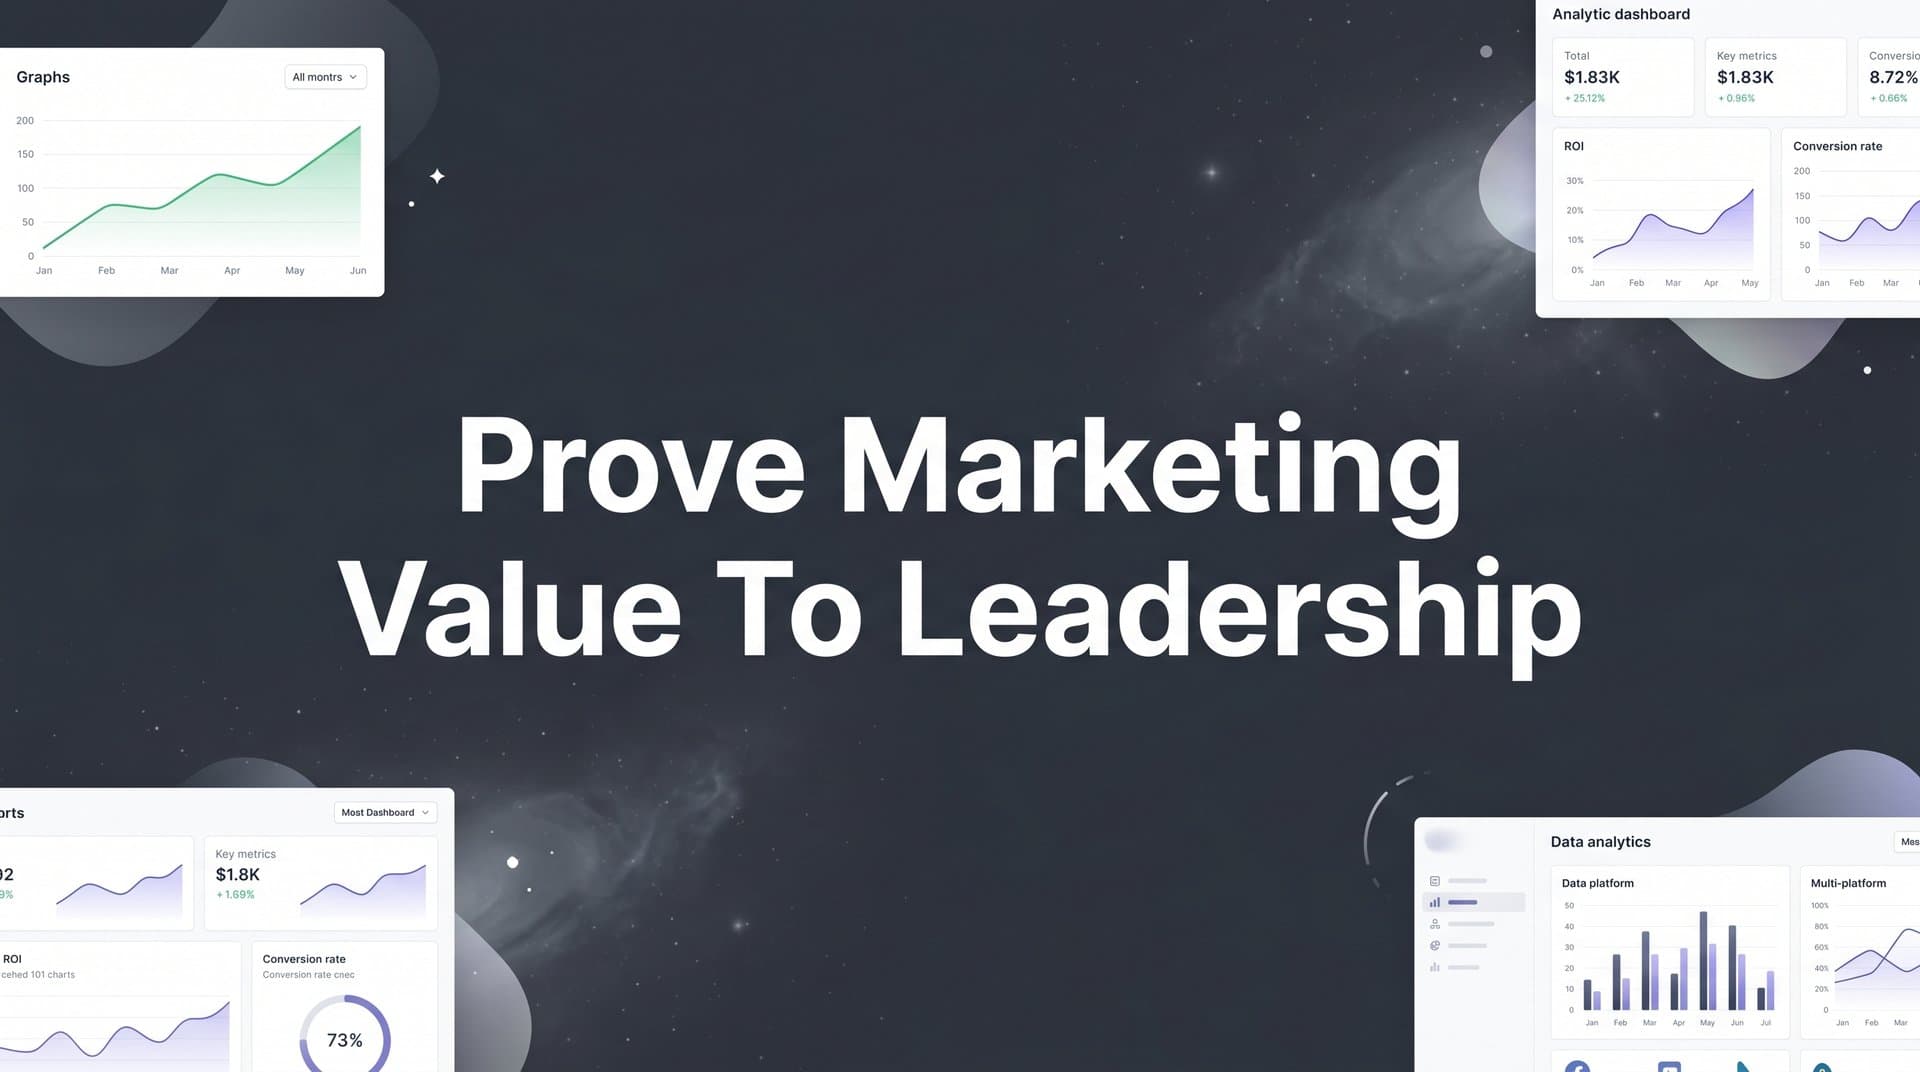
A dashboard that only marketing understands is not a leadership tool. It is a documentation tool. The goal of this step is to build something that answers leadership's most important question without requiring them to ask you: what did marketing contribute?
The key design principle is connecting marketing spend directly to pipeline generated and revenue closed. When those numbers sit side by side, the conversation shifts from "what did you do?" to "what return did we get?" That is a much better conversation to be in.
Here is what your revenue-connected marketing dashboard should include:
Marketing spend by channel: Show how much was invested in each platform over the selected time period. This gives leadership the cost side of the equation.
Pipeline generated by channel: Show how much pipeline each channel contributed, using your multi-touch attribution data from Step 3. This connects spend to opportunity creation.
Revenue closed by channel: Where your CRM data allows, show how much closed revenue was sourced or influenced by marketing. This is the number that resonates most with finance and executive teams.
Cost per acquisition by channel: Calculate the total spend divided by the number of customers acquired through each channel. This lets leadership compare efficiency across channels at a glance.
Return on ad spend (ROAS): Show the revenue return for every dollar of ad spend. Segment this by channel and by campaign so leadership can see where performance is strongest.
Marketing-sourced revenue percentage: Show what share of total company revenue was sourced or influenced by marketing. This single metric does more to establish marketing's strategic importance than almost any other number.
Cometly's analytics dashboard is built to centralize this kind of cross-platform data. Instead of pulling numbers from Meta, Google, and your CRM separately and stitching them together in a spreadsheet, you get a unified view of marketing and sales attribution that updates in real time. That means leadership can check the dashboard between formal reviews without needing to request a report.
That last point matters more than it sounds. When leadership can access marketing data on their own terms, marketing becomes part of the ongoing business conversation rather than a quarterly presentation. Avoid cluttering the dashboard with operational metrics that only matter internally, such as quality scores, frequency caps, or platform-specific engagement rates. Keep it focused on the business-level numbers you aligned on in Step 1.
Step 5: Translate Campaign Performance Into Business Language
Data does not speak for itself. If you present raw numbers without interpretation, leadership will draw their own conclusions, and those conclusions are often less favorable than the reality. Your job is not just to report what happened. It is to explain what it means.
The most effective translation is financial framing. Instead of saying "we generated 500 leads last quarter," say "we generated X in pipeline at a cost per opportunity of Y." Instead of "our CPL dropped by 20 percent," say "we are now acquiring customers at a lower cost, which improves our unit economics and extends our budget runway." Same data, completely different impact.
Here are the key translation techniques that work in leadership conversations:
Use pipeline and revenue language: Every campaign result should be expressed in terms of what it contributed to the funnel. Leads become opportunities. Opportunities become revenue. Connect those dots explicitly rather than leaving leadership to make the leap themselves.
Show the cost of inaction: One of the most powerful arguments you can make is what revenue would have been missed without specific campaigns. If a retargeting campaign drove a significant share of closed deals at a low cost per acquisition, show leadership what the pipeline would have looked like without it. This reframes the conversation from "is this worth the spend?" to "what is the cost of cutting it?"
Present trends, not snapshots: A single quarter's results can look like an anomaly. Three to four quarters of consistent contribution tells a story of reliable performance. Whenever possible, present performance trends over time to demonstrate that marketing is a consistent contributor, not a one-off win.
Identify your highest-efficiency channels: Use your attribution data to show which channels deliver the lowest customer acquisition cost and the highest lifetime value. This helps leadership see not just what marketing spent, but where it should spend more.
Prepare a one-page executive summary: Distill your full dashboard into three to five key takeaways that leadership can absorb in two minutes. The summary should answer: what did we invest, what did it return, and what is the recommended next step? This is what gets read before the meeting and referenced after it.
The common pitfall here is presenting data without a point of view. Leadership does not have time to interpret raw numbers. They need you to tell them what the data means and what it implies for the business. When you prove marketing ROI to executives, be the expert in the room, not just the reporter.
Step 6: Use AI-Driven Insights to Strengthen Your Recommendations
Reporting what happened is table stakes. The marketers who earn the most trust and the most budget are the ones who can tell leadership what should happen next, and back it up with data.
This is where AI-driven insights change the conversation entirely. Instead of walking into a review and saying "here is what we did last quarter," you walk in and say "here is what we did, here is what the data tells us about what is working, and here is where we recommend shifting investment to improve returns." That is a strategic conversation, not a defensive one.
AI-powered attribution platforms can surface patterns in campaign data that are genuinely difficult to detect through manual analysis. Which audience segments are converting at the highest rate? Which channel combinations appear most often in the journeys of your highest-value customers? Which campaigns are trending upward and deserve more budget before they plateau? These are the insights that turn a reporting session into a strategy session.
Here is how to bring AI-driven insights into your leadership presentations:
Lead with optimization recommendations: Present AI-identified opportunities alongside historical performance data. Show that marketing is not just measuring results but actively using data to improve them. Cometly's AI-driven marketing optimization surfaces these recommendations across every active channel, giving you a clear view of where budget reallocation would improve returns.
Show the feedback loop: One of the most compelling arguments you can make to leadership is that your marketing system is self-improving. When you feed enriched conversion data back to Meta and Google through Conversion Sync, the platform algorithms get better signals for targeting and optimization. Better signals lead to better ad performance, which produces stronger results in the next reporting period. This is a virtuous cycle that leadership can understand and value.
Position marketing as a revenue driver with an active optimization loop: The framework is simple: track, analyze, recommend, act, measure. When you can show leadership that this loop is running continuously, not just at quarterly reviews, you elevate marketing from a reporting function to a strategic growth function.
This step transforms the conversation from "here is what we spent" to "here is how we are making smarter decisions with every dollar." That shift in framing is what separates marketing teams that allocate marketing budget based on data from those that fight for it defensively.
Step 7: Present Your Case and Establish a Reporting Cadence
Everything you have built across the previous six steps comes together in how you present and sustain the conversation with leadership. A single great presentation is not enough. What you are building is an ongoing relationship between marketing data and executive decision-making.
Structure every leadership presentation around three core questions: What did we do? What did it produce? What should we do next? This framework is simple enough that leadership can follow it without a briefing, and it covers the full arc from accountability to strategy.
Anchor every slide and every talking point back to the KPIs you agreed on in Step 1. This is not just good practice. It is your defense against scope creep and moving goalposts. When the metrics are pre-agreed, the evaluation criteria are fixed, and you are being judged on terms you helped define.
Anticipate the hardest objection in the room: "How do we know marketing caused this?" This is a fair question, and you should have a clear answer ready. Your attribution data from Steps 2 and 3 is your evidence. Walk through the customer journey data. Show the multi-touch model. Explain why a neutral third-party view is more reliable than platform-reported numbers. The more specific and transparent you are, the more credible you become.
Propose a regular reporting cadence rather than waiting to be asked. Monthly or quarterly reviews position marketing as a strategic function with ongoing accountability. Ad hoc reporting, by contrast, positions marketing as reactive. When you show up consistently with clean data and clear recommendations, leadership starts to rely on that input rather than question it.
Share dashboard access so leadership can explore data between formal reviews. This removes the "I have to wait for the marketing team to pull that" friction and keeps your numbers in the conversation even when you are not in the room.
The success indicator for this step is behavioral: leadership begins referencing marketing data in their own conversations about growth strategy. When the CFO mentions your cost per acquisition in a board meeting, or the VP of Sales references a campaign's pipeline contribution in a forecast call, you have achieved something more valuable than a good presentation. You have become a trusted source of business intelligence.
Your Next Steps: Building a System That Compounds Over Time
Proving marketing value to leadership is not a one-time presentation. It is a system. When you align on the right metrics, build accurate tracking, map the customer journey, and translate performance into business language, you create a foundation of credibility that compounds with every reporting cycle.
Leadership stops questioning marketing's contribution and starts relying on it. Budget conversations shift from defense to strategy. And marketing earns the institutional trust that supports both short-term requests and long-term investment.
If your tracking foundation is not solid yet, start with Steps 1 and 2. Getting alignment and accurate data in place is the prerequisite for everything else. If you already have clean data flowing, jump to Steps 4 and 5 to sharpen how you communicate results to the people who control the budget.
The marketers who earn the most trust are not always the ones running the best campaigns. They are the ones who can prove it, consistently, in language that resonates with finance, sales, and executive stakeholders.
Cometly helps marketing teams do exactly that. By connecting every ad touchpoint to revenue, surfacing AI-driven insights through the AI Ads Manager, and giving you a single source of truth for cross-channel performance, Cometly turns attribution data into a strategic asset. From server-side tracking that captures what other tools miss, to Conversion Sync that feeds better signals back to Meta and Google, every feature is built to make your marketing data more complete, more accurate, and more defensible.
If you are ready to build the reporting foundation that earns leadership's confidence, start with your attribution data. Get your free demo and see how Cometly gives you the complete, revenue-connected view of marketing performance that turns budget conversations into growth conversations.