
Paid social campaigns represent a significant portion of most B2B SaaS marketing budgets. Yet many growth teams are still flying blind when it comes to understanding which campaigns are actually driving pipeline and revenue.
Clicking into Meta Ads Manager or LinkedIn Campaign Manager gives you impressions and clicks. It rarely tells you which ad influenced a deal that closed three months later. That gap between ad spend and revenue is where most attribution breaks down.
This guide walks you through a practical, step-by-step process to track paid social campaigns from the first ad impression all the way through to closed-won revenue. Whether you are running campaigns on Meta, LinkedIn, TikTok, or a combination of platforms, the framework here applies across channels.
You will learn how to set up your tracking infrastructure, define the right conversion events, connect your ad data to your CRM, choose attribution models that reflect how B2B buyers actually behave, and use that data to make smarter budget decisions.
By the end of this guide, you will have a clear system for measuring what your paid social spend is actually producing. Not just surface-level metrics like cost per click or click-through rate, but real pipeline and revenue impact. Each step builds on the last, so follow them in order the first time through.
Step 1: Define Your Conversion Events Before You Spend a Dollar
Before you touch a single ad platform setting or fire a single tracking pixel, you need to know exactly what you are measuring. This sounds obvious, but it is the step most teams skip, and it causes problems downstream that are very difficult to fix.
Start by identifying the specific actions that represent real business value for your company. For most B2B SaaS teams, these include demo requests, free trial signups, MQL form fills, and sales-qualified opportunities. These are your macro-conversions: the events that directly correlate with pipeline and revenue.
Then map your conversion events to each stage of your funnel. B2B sales cycles are long and multi-touch. A prospect might first engage with your brand six weeks before they ever fill out a form. If you only track the final conversion, you lose visibility into everything that contributed to it.
Micro-conversions to track: Content downloads, webinar registrations, pricing page visits, and case study views. These signals indicate intent and help you understand which campaigns are warming up your audience even when they are not yet ready to convert.
Macro-conversions to track: Demo booked, free trial started, contact sales form submitted, and qualified opportunity created in your CRM. These are the events you will optimize your ad campaigns toward.
Before you write a single line of tracking code or configure any ad platform settings, document everything. Write down each event name, the parameters you will pass with it (like lead source, form name, or product tier), and the estimated revenue value of each conversion type. This documentation becomes your source of truth when you are debugging discrepancies later.
One common pitfall to avoid: tracking page views as conversions. When you send page view data to Meta or LinkedIn as a conversion signal, you are telling their algorithms to optimize for people who visit pages, not people who take meaningful action. This inflates your reported conversion numbers and trains the algorithm to find the wrong audience. It feels like progress in the dashboard while quietly degrading your campaign performance. Understanding mastering conversion tracking from the start will save you from these costly mistakes.
The rule here is simple. If an event does not represent a real step toward revenue, do not treat it as a conversion event in your ad platforms.
Step 2: Set Up Server-Side Tracking and Conversion APIs
Once you know what you are measuring, you need to make sure you can actually measure it accurately. This is where most B2B SaaS teams have a significant blind spot.
Browser-based pixel tracking has become increasingly unreliable. Ad blockers prevent pixels from firing. iOS App Tracking Transparency changes limit the data that can be collected from Apple devices. Third-party cookie restrictions across major browsers mean that attribution windows are shorter and match rates are lower than they used to be. If you are relying solely on browser pixels, you are working with incomplete data. Understanding what a tracking pixel is and how it works helps clarify why server-side solutions have become essential.
Server-side tracking solves this problem by moving event collection from the browser to your server. Instead of a pixel firing in the user's browser (where it can be blocked or limited), your server sends conversion events directly to the ad platform's API. The data travels server-to-server, bypassing the browser entirely.
The two most critical integrations for paid social tracking accuracy are the Meta Conversion API (CAPI) and Google Enhanced Conversions. Meta's CAPI allows you to send web events, app events, and offline events directly from your server to Meta. Google Enhanced Conversions supplements your standard tag-based tracking with hashed first-party data, improving match rates for Google Ads conversions.
When you set up server-side tracking alongside your existing browser pixel, you need to configure event deduplication. Both your pixel and your server will attempt to report the same event. Without deduplication rules, you end up counting the same conversion twice. Meta uses an event ID parameter to deduplicate: when both the pixel and CAPI send the same event with the same event ID, Meta counts it once. This configuration is not optional; it is required for accurate reporting.
There is another significant benefit to server-side tracking that goes beyond accuracy. When you send events from your server, you can include richer first-party data. Hashed email addresses, phone numbers, and CRM identifiers can all be passed alongside conversion events. This improves your event match rate, which is the percentage of events that Meta or Google can successfully match to a user profile. Higher match rates mean the ad platform's algorithm has better data to optimize with, which translates directly to better campaign performance.
The pitfall to avoid here is setting up CAPI without deduplication. It is a common mistake, and the result is inflated conversion reporting that makes campaigns look far more effective than they are. Before you declare server-side tracking complete, verify your deduplication setup by checking for duplicate events in your Meta Events Manager or Google Tag diagnostics.
Step 3: Connect Your CRM and Ad Platforms to a Single Attribution Layer
Here is the core problem with relying on native ad platform reporting: every platform tells a different story. Meta reports one conversion count. LinkedIn reports another. Your CRM shows a third number. And none of them agree. This is not a bug; it is a structural limitation of siloed data.
Each ad platform uses its own attribution window and its own matching logic. Meta might claim credit for a conversion that LinkedIn also claims credit for, because the same prospect saw ads on both platforms before filling out your form. Without a unified layer that sits above all of these platforms, you cannot know which one is actually responsible.
A unified attribution layer ingests data from every source: your ad platforms, your website, your CRM, and your payment processor. It normalizes that data into a single view of the customer journey, so you can see every touchpoint a prospect had before becoming a customer, regardless of which platform it happened on. Building a proper attribution tracking setup is the foundation that makes this unified view possible.
The integrations you need to build this layer include your ad platform connections (Meta, LinkedIn, TikTok, Google Ads), your CRM sync (HubSpot or Salesforce), and your revenue data source (Stripe or your billing system). Each of these data sources tells part of the story. The attribution layer connects them.
UTM parameters are the connective tissue that makes this work. Every paid social ad you run should have UTM parameters appended to the destination URL. These parameters pass campaign data from the ad platform into your analytics tool and CRM when a user clicks through. The five standard parameters are utm_source (the platform, such as linkedin or meta), utm_medium (the channel, such as paid-social), utm_campaign (the campaign name), utm_content (the ad creative or ad set), and utm_term (keyword or audience targeting). When a lead fills out a form on your site, their UTM data gets captured alongside their contact record in your CRM, giving you a direct line between that lead and the ad that brought them there. If you are new to this concept, learning what UTM tracking is and how it helps will make this step much clearer.
This is exactly what Cometly is built to do. Cometly connects your ad platform data, CRM records, and revenue data in real time, giving you a single source of truth for your marketing performance. Instead of toggling between Meta Ads Manager, LinkedIn Campaign Manager, and HubSpot trying to reconcile numbers, you see the full customer journey in one place.
The success indicator for this step is clear: you should be able to open a lead record in your CRM and trace it back to the exact ad, campaign, and channel that generated it. If you cannot do that today, your attribution layer is not fully connected.
Step 4: Choose the Right Attribution Model for Your Sales Cycle
Attribution models determine how credit for a conversion gets distributed across the touchpoints in a customer journey. Choosing the wrong model does not just affect your reports; it affects where you invest your budget and which campaigns you scale or cut.
B2B buyers interact with multiple touchpoints before converting. A prospect might see a LinkedIn sponsored post, click through to read a blog post, register for a webinar two weeks later, and then book a demo after receiving a retargeting ad on Meta. That is four distinct touchpoints across multiple channels over several weeks. A single-touch model cannot accurately represent that journey.
Here is a quick breakdown of the main models and when each one applies:
First touch attribution assigns 100% of the credit to the first interaction. It is useful for understanding which channels are generating initial awareness, but it ignores everything that happened between awareness and conversion.
Last click attribution assigns 100% of the credit to the final touchpoint before conversion. It is simple and widely used, but it systematically undervalues upper-funnel campaigns that initiated the buying journey. For B2B SaaS with long sales cycles, last click will make your awareness campaigns look ineffective even when they are doing critical work.
Linear attribution distributes credit equally across all touchpoints. It is a more balanced approach and works reasonably well for longer B2B journeys where every touchpoint contributed meaningfully.
Time decay attribution gives more credit to touchpoints that occurred closer to the conversion. This reflects the reality that later-stage interactions often have more direct influence on the decision to buy.
Data-driven attribution uses machine learning to assign credit based on the actual contribution of each touchpoint, based on patterns across your conversion data. It is the most accurate model when you have sufficient data volume.
For most B2B SaaS teams, multi-touch attribution is the right direction. It distributes credit across the full customer journey rather than collapsing it into a single touchpoint. You can explore the nuances of different attribution models for ad campaigns in more depth when evaluating which model fits your specific sales cycle length and deal complexity.
One of the most valuable practices is comparing models side by side. When you look at the same campaign through a first-touch lens versus a last-click lens, you often see very different performance rankings. That comparison tells you which channels are driving awareness versus which ones are closing deals. Both are valuable; they just serve different strategic purposes.
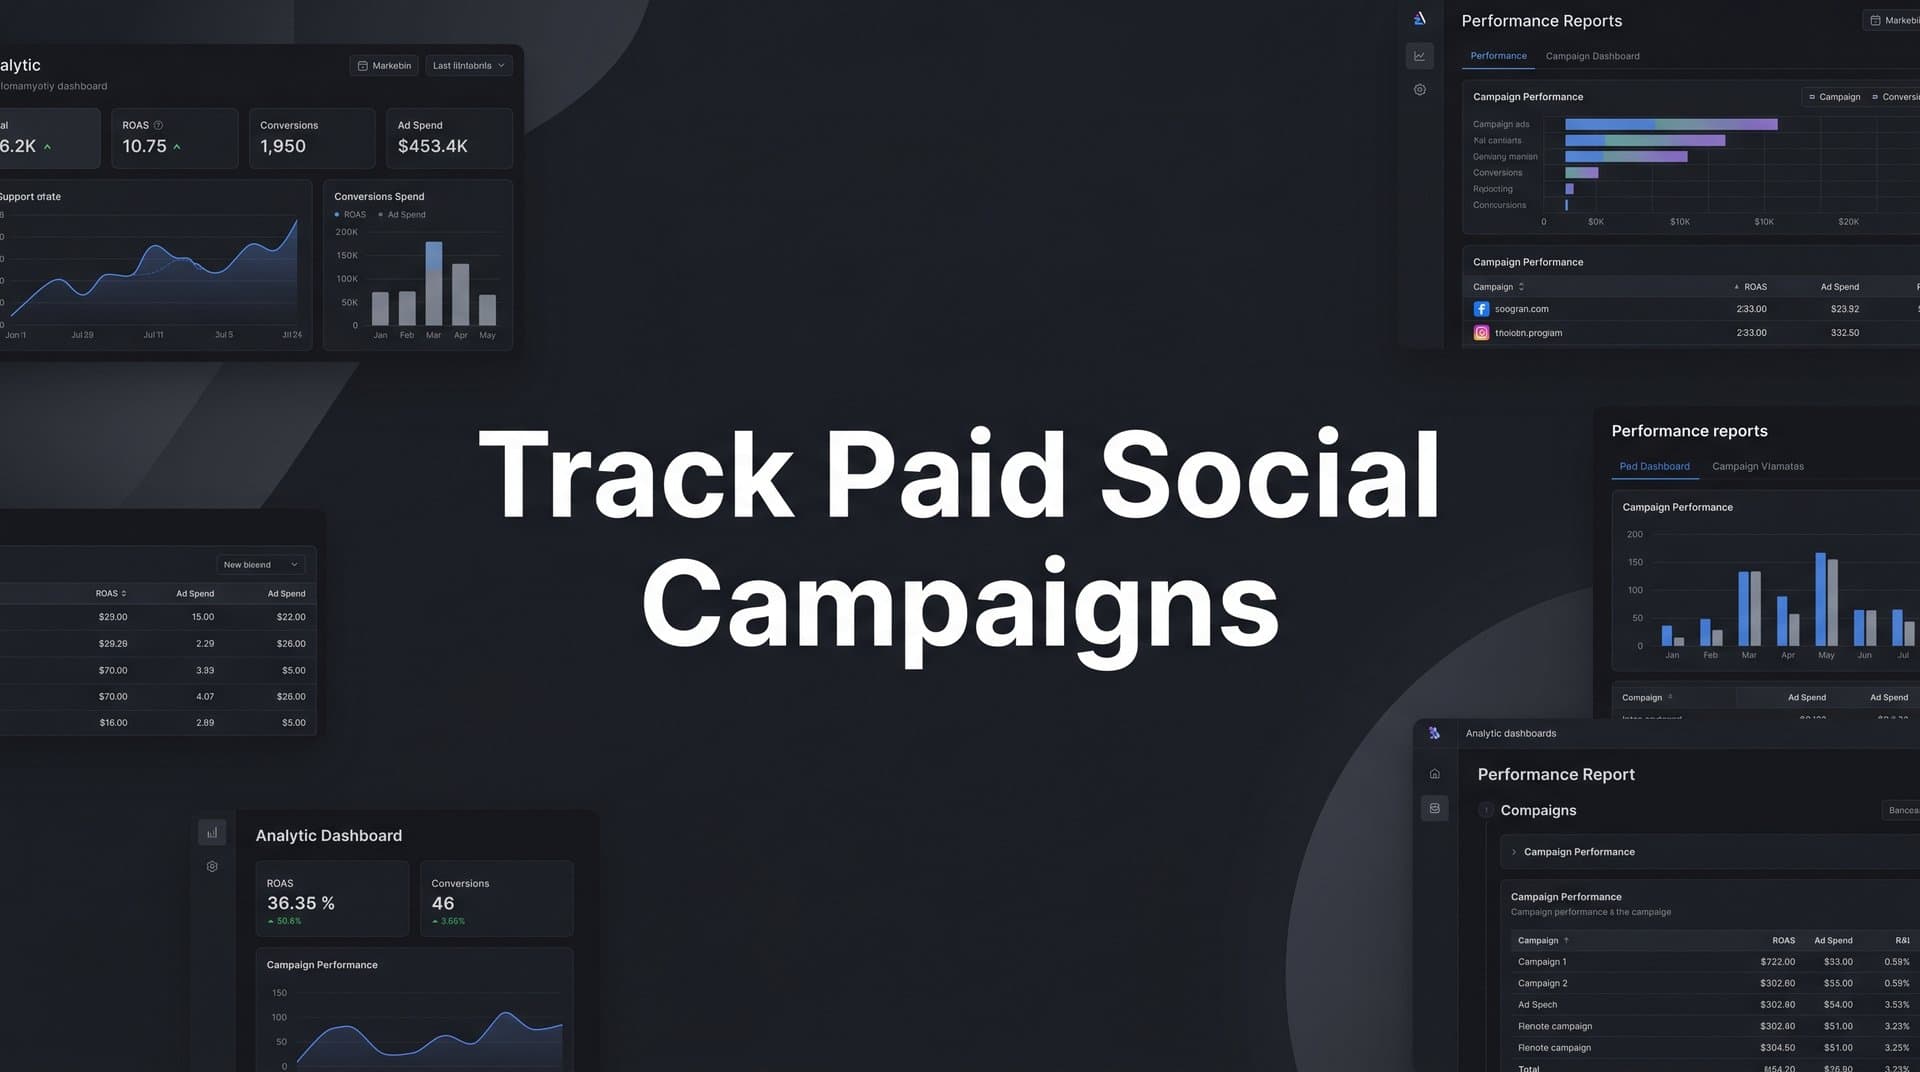
Step 5: Build a Campaign Reporting Dashboard That Connects Spend to Revenue
A reporting dashboard is only as useful as the metrics it surfaces. Most default dashboards in ad platforms show you impressions, clicks, and platform-reported conversions. Those metrics are useful for tactical optimization, but they do not answer the question that actually matters: how much revenue did this campaign generate?
Your paid social dashboard should include these core metrics at minimum: cost per lead, cost per opportunity, cost per acquisition, pipeline generated, revenue attributed, and return on ad spend (ROAS). These metrics connect your ad spend to the business outcomes your leadership team cares about. Reviewing paid media analytics best practices can help you identify which additional metrics deserve a place in your reporting stack.
It is important to understand that platform-reported metrics and attribution-reported metrics will never match exactly. Meta will always report more conversions than your CRM shows, because Meta uses its own attribution window and matching logic. That discrepancy is expected and normal. What matters is that you have a consistent methodology in your attribution layer that you use for decision-making, rather than toggling between platform dashboards and getting confused by the differences.
Structure your dashboard at three levels. At the campaign level, you want to see total spend, pipeline generated, and revenue attributed so you can compare performance across your major initiatives. At the ad set level, you want to see cost per lead and cost per opportunity to understand which audience segments are most efficient. At the ad creative level, you want to see which specific ads are driving the most qualified conversions so you can inform your creative strategy.
Pipeline attribution is a particularly powerful concept for B2B SaaS teams. Rather than just counting leads, pipeline attribution connects each ad and campaign to the revenue value of the opportunities it created. A campaign that generates ten leads worth a combined $500,000 in pipeline is clearly more valuable than a campaign that generates fifty leads worth $50,000, even if the second campaign looks better on a cost-per-lead basis. Learning how to attribute revenue to specific campaigns gives you the framework to make these comparisons with confidence.
Cometly surfaces this kind of revenue-level insight automatically. Its AI identifies high-performing ads and campaigns across channels, so instead of manually cross-referencing spreadsheets, you can see which campaigns are generating real pipeline and scale them with confidence. The goal is simple: you should be able to open your dashboard and answer the question "which campaign generated the most pipeline this month" in under 60 seconds.
Step 6: Analyze Performance and Feed Better Data Back to Ad Platforms
Tracking paid social campaigns is not a one-way street. The data you collect does not just inform your internal decisions; it directly influences how ad platform algorithms optimize your campaigns. This feedback loop is one of the most underutilized levers in B2B SaaS paid social.
Here is how it works. When you send offline conversion data back to Meta and Google, you are telling their algorithms which leads actually became opportunities or customers. Instead of optimizing toward everyone who filled out a form, the algorithm learns to find more people who look like your best customers: the ones who converted into revenue, not just the ones who submitted a form. Understanding how to track offline conversions is the key to closing this attribution gap between your ad spend and actual revenue.
In practice, this means syncing your CRM stage changes back to your ad platforms. When a lead reaches "sales qualified opportunity" status in HubSpot or Salesforce, that event should be sent back to Meta as an offline conversion. When a deal closes in your CRM, that closed-won event should also be sent back. Over time, this trains the algorithm on what a high-value conversion actually looks like for your business.
Enriched first-party data improves this process further. When you pass hashed email addresses and phone numbers alongside your conversion events, ad platforms can match those events to specific user profiles with higher accuracy. Better match rates mean the algorithm has more signal to work with, which improves lookalike audience quality and reduces wasted spend on low-intent audiences.
Use your attribution data to drive budget allocation decisions. If your dashboard shows that LinkedIn campaigns are generating pipeline at a lower cost per opportunity than Meta campaigns, that is a signal to shift budget toward LinkedIn. If a particular ad creative is consistently producing qualified opportunities while another is generating high click volume but low conversion rates downstream, pause the latter and invest in scaling the former. Using the right performance marketing tracking software makes these cross-platform comparisons far more reliable.
Cometly's AI recommendations make this analysis faster and more reliable. Rather than manually analyzing campaign data across platforms, Cometly identifies which ads and campaigns to scale, pause, or test based on revenue-level data. This moves you from reactive reporting to proactive optimization.
The pitfall to avoid here is optimizing based on platform-reported conversions without CRM validation. Ad platforms will always show you their best numbers. Without checking those numbers against your CRM data, you risk scaling campaigns that generate leads but not revenue, which is one of the most expensive mistakes in paid social.
Putting It All Together: Your Paid Social Tracking Checklist
You now have a complete framework for tracking paid social campaigns from first impression to closed-won revenue. Before you move on, use this checklist to confirm each step is in place:
1. Conversion events defined: You have documented all macro and micro-conversions, including event names, parameters, and revenue values, before touching any ad platform settings.
2. Server-side tracking active: Meta CAPI and Google Enhanced Conversions are configured with proper event deduplication. You are passing first-party data to improve match rates.
3. Unified attribution layer connected: Your ad platforms, CRM, and revenue data are synced into a single system. UTM parameters are consistently applied across all paid social campaigns.
4. Attribution model selected: You have chosen a multi-touch attribution model appropriate for your sales cycle length, and you are comparing models to understand channel roles.
5. Dashboard built: Your reporting dashboard shows cost per lead, cost per opportunity, pipeline generated, and revenue attributed at the campaign, ad set, and creative levels.
6. Feedback loop active: Offline conversion data is flowing back to Meta and Google from your CRM. Budget decisions are based on pipeline and revenue data, not platform-reported conversions.
Tracking paid social campaigns is an ongoing process, not a one-time setup. Your conversion definitions will evolve as your product changes. Your attribution model may need adjustment as your sales cycle shifts. Your dashboard should be reviewed and refined regularly as you learn what metrics actually drive decisions.
Accurate attribution is the foundation for confident budget decisions and sustainable growth. Most B2B SaaS teams are leaving significant insight on the table by relying on native platform reporting alone. Cometly ties all of these components together, from the first ad click to closed-won revenue, giving your growth team a single source of truth for every dollar you spend on paid social.
Ready to elevate your marketing game with precision and confidence? Discover how Cometly's AI-driven recommendations can transform your ad strategy. Get your free demo today and start capturing every touchpoint to maximize your conversions.


