
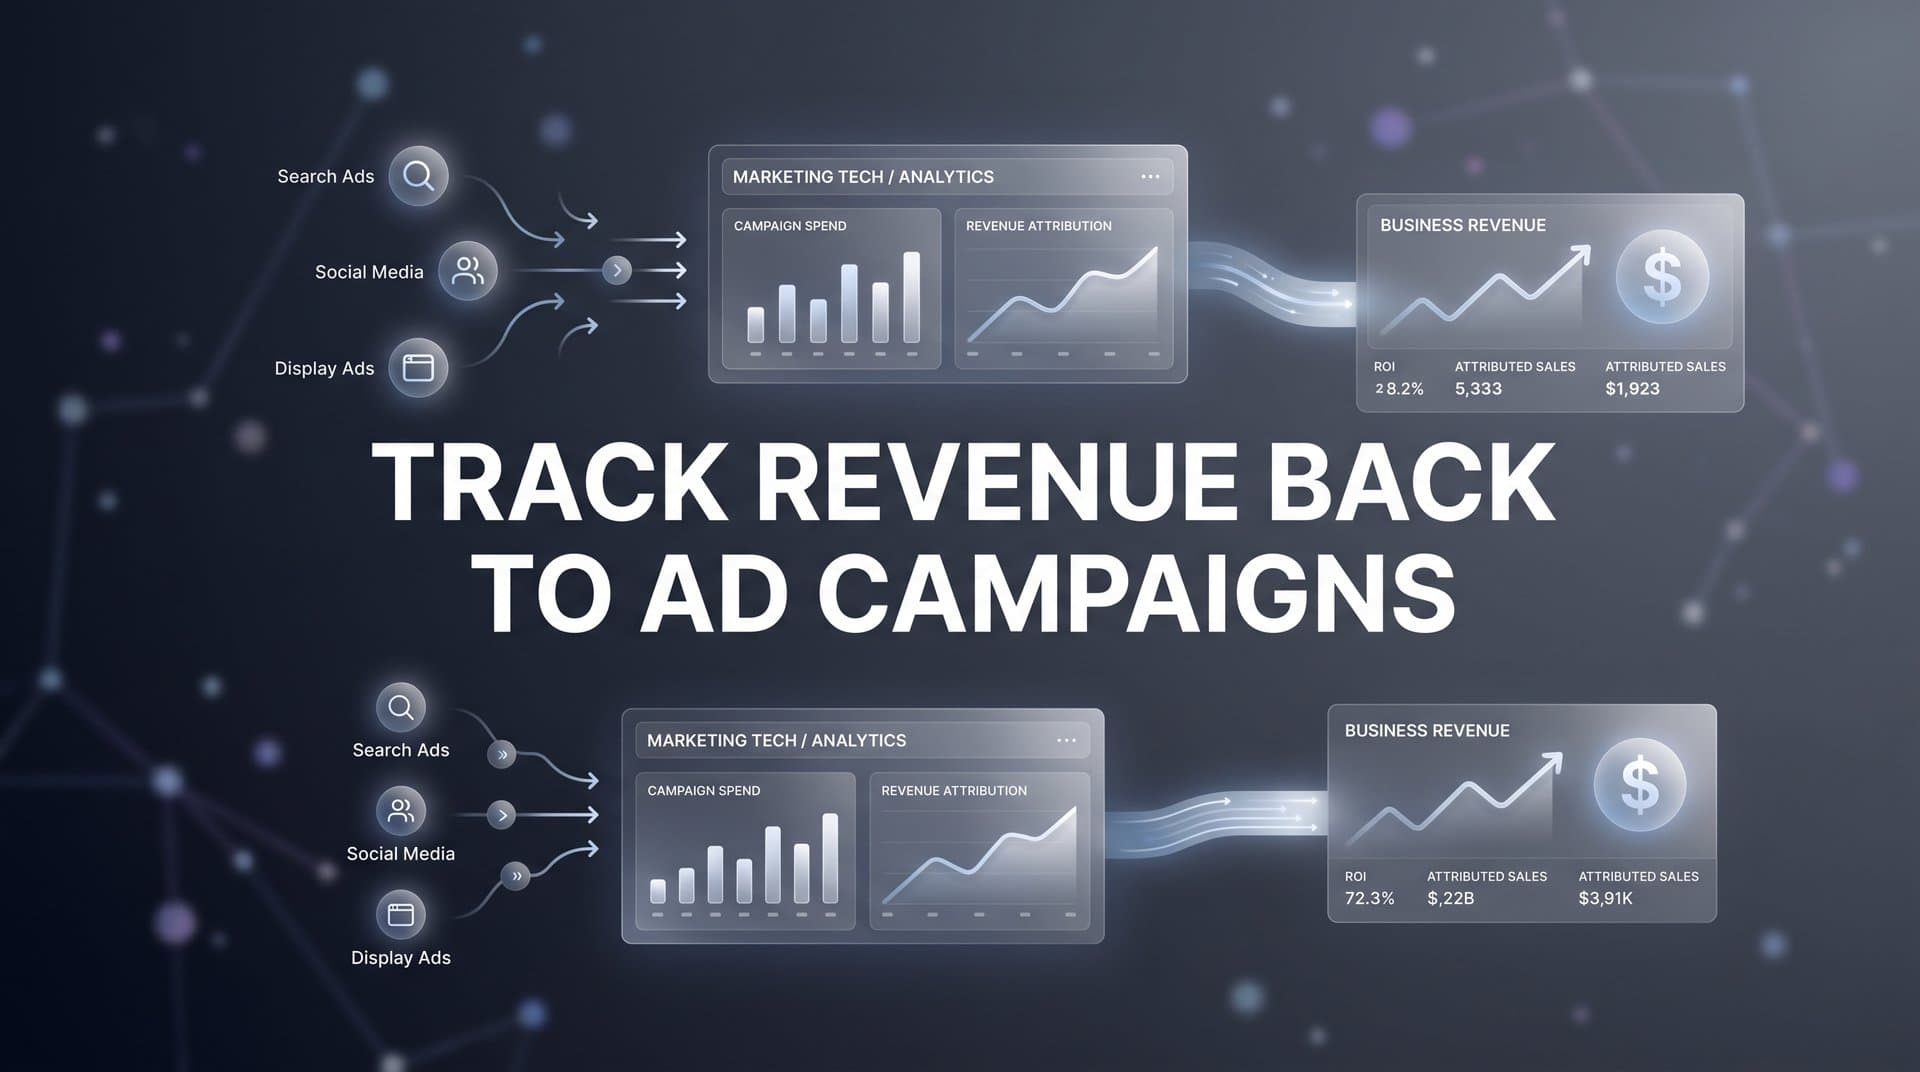
You are spending thousands of dollars across Meta, Google, TikTok, and LinkedIn every month. You can see clicks, impressions, and even conversions inside each ad platform. But when your CFO asks which campaign actually generated last quarter's revenue, you draw a blank.
This is the gap that most marketing teams struggle with: connecting actual dollars earned back to the specific ads and campaigns that drove them. The problem is not a lack of data. It is a lack of connected data.
Ad platforms report in silos. CRMs track deals separately. Website analytics measure sessions without tying them to closed revenue. The result is a fragmented picture that makes it nearly impossible to confidently track revenue back to ad campaigns.
Privacy changes over the past several years, including Apple's App Tracking Transparency framework and ongoing third-party cookie restrictions, have made the problem worse. Client-side pixels miss more conversions than ever, meaning the data you do have is likely incomplete before you even try to connect it to revenue.
This guide walks you through a clear, actionable process to close that gap. You will learn how to set up the infrastructure, connect your data sources, implement proper tracking, choose the right attribution model, and use revenue insights to optimize your ad spend. By the end, you will have a repeatable system that ties every dollar of revenue to the campaign that earned it, so you can scale what works and cut what does not.
Step 1: Map Your Full Customer Journey from Click to Closed Deal
Before you can track revenue back to ad campaigns, you need to understand every step a prospect takes between seeing your ad and becoming a paying customer. Most revenue tracking failures do not start with a technology problem. They start with an incomplete picture of how customers actually move through the funnel.
Start by listing every touchpoint in your customer journey. A typical B2B journey might look like this: a prospect sees a LinkedIn ad, clicks through to a landing page, fills out a form, books a demo, joins a sales call, receives a follow-up proposal, and eventually signs a contract. Each of those moments is a potential tracking point, and each one needs to be accounted for in your system.
Pay close attention to the handoff points between marketing and sales. This is where tracking most commonly breaks down. Marketing might track the lead through a form fill, then pass it to the CRM, where the sales team takes over. If the CRM record is not linked back to the original ad campaign, the revenue that closes weeks or months later becomes invisible to your marketing data. Learning how to properly track sales leads through these handoffs is essential for maintaining attribution accuracy.
Define what counts as a conversion at each stage of the funnel. You need clear definitions for lead, marketing qualified lead (MQL), sales qualified lead (SQL), opportunity, and closed-won revenue. When everyone on the team uses the same definitions, your attribution data stays consistent and comparable over time.
Do not forget offline touchpoints. Phone calls, in-person meetings, and trade show conversations can all influence a deal, especially in longer sales cycles. These interactions may not leave a digital footprint by default, but they can be logged in your CRM and factored into your attribution model.
Why this step matters: You cannot track what you have not mapped. Skipping this step means you will build tracking infrastructure on top of a broken foundation, and the revenue data you eventually collect will have gaps you cannot explain.
Action to take: Draw out your customer journey on a whiteboard or in a spreadsheet. Include every touchpoint, every handoff, and every stage definition. This map becomes the blueprint for everything that follows.
Success indicator: You have a documented journey from first ad impression to closed deal, with clear stage definitions and identified handoff points between marketing and sales.
Step 2: Connect Your Ad Platforms, Website, and CRM into One Data Layer
Once your customer journey is mapped, the next challenge is technical: getting all of your data sources to talk to each other. Right now, your ad platforms, website, and CRM are almost certainly operating independently. Revenue tracking requires them to work as one connected system.
Start with your ad platforms. Meta, Google Ads, TikTok, and LinkedIn each have their own reporting interfaces, their own conversion definitions, and their own attribution logic. When you look at revenue across all four platforms simultaneously, you are almost guaranteed to see inflated numbers because each platform takes credit for the same conversions. The solution is to route all campaign data into a central attribution tool that normalizes the data and applies a consistent attribution model across every channel.
Next, connect your CRM. Whether you use HubSpot, Salesforce, Pipedrive, or another platform, your CRM holds the ground truth on deal values and close dates. When a prospect becomes a customer, that revenue event needs to flow back into your attribution system so it can be matched to the original ad campaign that started the journey. Having a reliable process for tracking closed-won revenue is what separates teams that guess from teams that know.
On your website, you need two layers of tracking working together. The first is client-side tracking: pixels, tags, and JavaScript-based events that fire in the browser. The second is server-side tracking, which captures conversion data directly from your server rather than relying on the browser.
Why server-side tracking matters: Browser restrictions, ad blockers, and iOS privacy changes make client-side pixels unreliable. A user who has an ad blocker installed or who opted out of tracking on their iPhone will not be captured by a standard pixel. Implementing a robust server-side tracking approach bypasses these limitations, giving you a more complete and accurate picture of conversions.
This is where having a unified platform makes a significant difference. Cometly connects your ad platforms, CRM, and website tracking into a single view of the customer journey. Instead of manually stitching together exports from four different platforms, you get one consistent data layer that shows you exactly how each campaign contributes to revenue from first click to closed deal.
Action to take: Audit your current integrations. Identify which platforms are connected and which are operating in silos. Prioritize connecting your CRM to your attribution tool, as this is the link that makes revenue tracking possible.
Success indicator: Campaign data from all ad platforms, website events, and CRM deal values are flowing into one system where they can be analyzed together.
Step 3: Implement UTM Parameters and First-Party Tracking at Scale
UTM parameters are the connective tissue of revenue attribution. They are the tags you append to your ad URLs that tell your analytics system where a visitor came from, which campaign sent them, and which specific ad they clicked. Without clean, consistent UTMs, tracking revenue back to ad campaigns becomes nearly impossible.
Build a consistent UTM naming convention and enforce it across every campaign. The five standard UTM parameters are source, medium, campaign, content, and term. A well-structured UTM might look like this: utm_source=facebook, utm_medium=paid-social, utm_campaign=q2-lead-gen, utm_content=video-ad-v1, utm_term=marketing-software. For a deeper dive into how these tags work, check out this guide on UTM tracking and how it helps your marketing.
The most common pitfall is inconsistent naming. If one team member uses "facebook" and another uses "Facebook" and a third uses "fb," your analytics system will treat these as three separate sources. When you try to roll up revenue by channel, the data will be fragmented and unreliable. Standardize your naming convention in a shared document and make it mandatory for every campaign launch.
Use dynamic UTM parameters wherever your ad platforms support them. Google Ads offers ValueTrack parameters that automatically populate campaign IDs, ad group IDs, and keyword information. Meta offers URL parameters that auto-fill ad set names and ad IDs. These dynamic parameters reduce human error and ensure that granular campaign data is captured even across large accounts with hundreds of ad variations.
Capture UTM data on your landing pages and pass it through form submissions into your CRM using hidden fields. This is the critical step that connects the ad click to the CRM record. When a prospect fills out a form, the hidden fields capture the UTM values from their session and store them alongside the contact record. Now when that contact closes as a customer, you can trace the revenue back to the original campaign.
Supplement UTMs with first-party cookies and server-side event tracking. First-party cookies are set by your own domain and are not subject to the same restrictions as third-party cookies. Combined with server-side tracking, they help maintain attribution accuracy even when browsers block or expire cookies faster than they used to. A thorough attribution tracking setup ensures these layers work together seamlessly.
Action to take: Create a UTM naming convention document and share it with everyone who launches campaigns. Audit your existing campaigns for naming inconsistencies and correct them before they contaminate your revenue data further.
Success indicator: Every active campaign URL contains properly formatted UTM parameters, and UTM data is being captured in your CRM on every form submission.
Step 4: Choose the Right Attribution Model for Your Business
Attribution models determine how revenue credit is distributed across the touchpoints in a customer journey. Choosing the right model is not just a technical decision. It shapes how you evaluate campaign performance, where you allocate budget, and which channels you prioritize for growth.
Here is a quick breakdown of the core models:
First-touch attribution gives all revenue credit to the first interaction a prospect had with your brand. This is useful for understanding which channels drive awareness and top-of-funnel entry, but it ignores everything that happened between that first click and the eventual purchase.
Last-touch attribution gives all credit to the final touchpoint before conversion. This is the default in many ad platforms and CRMs, but it systematically undervalues the channels that introduced the prospect and nurtured them through the funnel.
Linear attribution distributes revenue credit equally across every touchpoint in the journey. This is more balanced than first or last touch, but it treats a quick homepage visit the same as a demo booking, which is rarely an accurate reflection of how influence actually works.
Time-decay attribution gives more credit to touchpoints that occurred closer to the conversion. This makes intuitive sense for shorter sales cycles where recent interactions are likely more influential.
Position-based attribution (also called U-shaped or W-shaped) assigns the most credit to specific high-value touchpoints, such as the first touch and the lead conversion moment, while distributing the remaining credit across middle touchpoints. This model is popular with B2B teams because it acknowledges both the acquisition moment and the conversion moment.
How do you choose? Consider your sales cycle length. If your customers typically convert within a few days, a simpler model like last-touch or time-decay may be sufficient. If your sales cycle spans weeks or months with multiple touchpoints across different channels, multi-touch attribution gives you a far more accurate picture of what is actually driving revenue. For a detailed comparison, explore this resource on which attribution model is best for optimizing ad campaigns.
The practical challenge is that no single model is perfect, and the right answer often depends on what decision you are trying to make. This is why comparing models side by side is so valuable. Cometly lets you view revenue attribution through multiple models simultaneously, so you can see how credit shifts depending on the model and make more informed budget decisions based on the full picture rather than a single perspective.
For a deeper look at how these models compare, explore resources on common attribution models and how to apply them to your specific funnel.
Action to take: Identify your average sales cycle length and the number of touchpoints in a typical customer journey. Use this to select a starting attribution model, knowing you can refine it as your data matures.
Success indicator: You have selected an attribution model that aligns with your sales cycle, and your attribution tool is applying it consistently across all campaigns.
Step 5: Sync Conversion Data Back to Your Ad Platforms
Most marketers think of attribution as a one-way street: data flows from ad platforms into your analytics system, and you use it to evaluate performance. But there is a second direction that is equally important and often overlooked. Sending revenue data back to your ad platforms closes the loop and makes your campaigns significantly more effective over time.
Here is why this matters. Meta, Google, TikTok, and LinkedIn all use machine learning algorithms to optimize your campaigns. These algorithms need conversion signals to learn what a high-value customer looks like. If the only signal you are sending back is a form fill or a page view, the algorithm optimizes for those surface-level events, which may have little correlation with actual revenue.
When you send CRM-verified revenue events back to the ad platforms, you are teaching the algorithm what a real customer looks like. Over time, this shifts the targeting toward prospects who are more likely to generate revenue, not just more likely to click or submit a form. The result is a feedback loop: better data in means better targeting out, which means higher-quality leads and more revenue per dollar spent.
This process is often called offline conversion tracking or conversion sync. Each major ad platform has its own mechanism for receiving this data. Google Ads has offline conversion imports. Meta has the Conversions API. TikTok and LinkedIn have similar server-side event capabilities. For a comprehensive walkthrough of this process, see this guide on how to track offline conversions and close the attribution gap.
This is where Cometly's Conversion Sync becomes particularly valuable. It automates the process of sending enriched, conversion-ready revenue events back to Meta, Google, and other platforms. Instead of managing separate offline conversion setups for each platform, you configure it once and let the system handle the data flow. The ad platforms receive accurate revenue signals, their algorithms improve, and your campaigns become more efficient without you having to manually manage each integration.
Action to take: Identify which ad platforms you are currently running campaigns on and check whether you have offline conversion or server-side event tracking configured for each. If not, prioritize setting this up for your highest-spend platform first.
Success indicator: Revenue events from your CRM are flowing back to your ad platforms, and you can verify in each platform's event manager that revenue signals are being received and matched.
Step 6: Build a Revenue Attribution Dashboard and Analyze Results
All of the infrastructure you have built in the previous steps only delivers value if you can actually see and act on the data. A revenue attribution dashboard is where everything comes together: campaign spend, revenue generated, ROAS, and cost per acquisition all in one place, broken down by channel, campaign, ad set, and creative.
Your dashboard should answer the questions that matter most to your team and your leadership. Which campaigns generated the most revenue this quarter? Which channels deliver the highest return on ad spend? Which ad creatives are driving high-value customers versus low-quality leads? What is the cost per acquisition when measured against actual closed revenue rather than just form fills?
Build your dashboard around these key metrics:
Revenue by campaign: The total closed revenue attributed to each campaign, broken down by channel and time period. This is the core metric that connects your ad spend to business outcomes.
Return on ad spend (ROAS) tied to revenue: Not the platform-reported ROAS, which is often inflated and based on incomplete conversion data, but the actual ROAS calculated from verified CRM revenue divided by campaign spend.
Cost per acquisition (CPA) by channel: How much you spend in ad costs to generate one closed customer, segmented by source. This reveals which channels are truly efficient and which are generating leads that never close.
Customer lifetime value by source: If your business has repeat purchases or subscription revenue, tracking which ad channels bring in higher-lifetime-value customers can completely change how you allocate budget.
Look for patterns beyond the top-line numbers. A channel that drives fewer conversions might consistently bring in higher-value customers. A campaign that looks expensive on a cost-per-lead basis might have the lowest cost per closed revenue. These insights only emerge when you are looking at actual revenue data rather than proxy metrics. Mastering analytics for paid campaigns is what turns raw data into actionable budget decisions.
Use AI-powered recommendations to surface insights you might miss manually. Cometly's AI Ads Manager analyzes performance across every channel and identifies high-performing ads and underperforming spend, giving you specific recommendations on where to scale and where to pull back. Instead of spending hours in spreadsheets, you get actionable guidance based on your actual revenue data.
Review your dashboard on a weekly or bi-weekly cadence. Revenue attribution data is most valuable when you act on it quickly. Catching a budget drain early in a campaign saves significantly more than discovering it at the end of the month. For more on building effective analytics workflows, explore resources on marketing analytics techniques and growth marketing analytics.
Action to take: Set up a revenue attribution dashboard that includes spend, revenue, ROAS, and CPA for every active campaign. Schedule a recurring review meeting to analyze the data and make budget decisions based on what you find.
Success indicator: You can answer the question "which campaign generated the most revenue this month?" in under two minutes, without exporting spreadsheets or switching between platforms.
Your Revenue Tracking System: Final Checklist and Next Steps
Tracking revenue back to ad campaigns is not a one-time setup. It is an ongoing system that gets more powerful over time as your data deepens and your attribution models sharpen. The more revenue events flow through the system, the more accurate your insights become.
Use this checklist to confirm you have everything in place:
1. Customer journey fully mapped from ad click to closed revenue, with stage definitions and handoff points documented.
2. Ad platforms, website, and CRM connected into one data layer with server-side tracking active.
3. UTM parameters implemented consistently across all campaigns with a shared naming convention enforced.
4. Attribution model selected and configured to match your sales cycle length and funnel complexity.
5. Conversion data syncing back to ad platforms so algorithms optimize for revenue, not just clicks.
6. Revenue attribution dashboard built and reviewed on a regular cadence to guide budget decisions.
When this system is running, every budget conversation shifts from guesswork to evidence. You will know exactly which campaigns generate revenue, which ones waste budget, and where to invest your next dollar for maximum return. Your CFO will get a clear answer. Your team will have the confidence to scale.
Cometly brings all of these pieces together in one platform. It connects your ad platforms, CRM, and website tracking, applies multi-touch attribution across every channel, syncs revenue events back to ad platforms to improve targeting, and surfaces AI-powered recommendations to help you scale what works. It is built for marketers who want clear, accurate data without the manual work of stitching together a dozen tools.
Ready to stop guessing where your revenue comes from? Get your free demo today and start building a revenue tracking system that gives you the clarity and confidence to grow your ad spend based on real data.


