If you are running paid ads on Meta, Google, LinkedIn, and TikTok simultaneously, you already know the frustration. A lead converts, a deal closes, and you have no clear answer for which channel actually drove it. Without a reliable system to track sales from multiple marketing sources, your budget decisions are based on guesswork rather than data.
This guide walks you through a practical, repeatable process for connecting every marketing touchpoint to actual closed revenue. You will learn how to set up proper source tracking, implement conversion events across channels, choose the right attribution model for your business, and build a reporting layer that gives your team a single source of truth.
Whether you are a marketing leader trying to justify ad spend or a growth operator optimizing campaigns for pipeline efficiency, this framework applies directly to how B2B SaaS companies operate. By the end, you will have a clear system for knowing exactly which sources drive leads, which drive pipeline, and which drive revenue so you can scale what works and cut what does not.
Step 1: Define What a Sale Means Across Your Funnel
Before you configure a single tracking pixel or write your first UTM parameter, you need to answer one foundational question: what does a sale actually mean in your system? This sounds obvious, but it is where most multi-source tracking efforts quietly fall apart.
Start by mapping your full funnel from top to bottom. In a typical B2B SaaS context, that means identifying stages like Marketing Qualified Lead (MQL), Sales Qualified Lead (SQL), open opportunity, and closed-won. Each stage represents a distinct event, and your attribution system needs to know which one counts as a sale for reporting purposes.
The most common pitfall here is tracking form fills or demo requests as conversions. Form fills are useful signals, but they are not sales. When you optimize ad campaigns toward form fills, you are telling the algorithm to find more people who fill out forms, not more people who actually buy. That distinction matters enormously when you are spending real budget across multiple channels.
Work with your sales team to identify the exact CRM stage or event that represents a closed deal. In most CRMs, this is a closed-won opportunity with an associated revenue value. That event should become the anchor of your attribution reporting. Understanding how to track sales leads through each pipeline stage is essential before any tracking infrastructure is built.
Next, determine which conversion events need to be tracked server-side versus client-side. High-value revenue events like closed-won deals should always be tracked server-side to ensure reliability. Lower-stakes events like page views or form submissions can often be handled client-side, though server-side is increasingly the preferred approach for all events as browser-based tracking becomes less reliable.
Finally, document these definitions in a shared resource your marketing and sales teams both reference. When both teams agree on what a conversion is before any tracking is configured, you eliminate a significant source of data conflict downstream.
Success indicator: You can name the exact CRM stage or event that represents a closed sale, and both your marketing and sales teams agree on that definition before any tracking is set up.
Step 2: Tag Every Marketing Source with UTM Parameters
UTM parameters are the foundation of multi-source attribution. They tell your analytics tools exactly where a visitor came from, which campaign brought them, and which specific ad or content piece drove the click. Without consistent UTM tagging, your traffic data becomes a fragmented mess that makes cross-channel comparison nearly impossible.
A complete UTM structure covers five parameters. Source identifies the platform, such as google or linkedin. Medium identifies the channel type, such as cpc or email. Campaign identifies the specific campaign name. Content identifies the specific ad or creative variation. Term identifies the keyword or audience segment. Together, these five fields give you a precise fingerprint for every inbound session. If you are new to this approach, learning what UTM tracking is and how it helps will give you a strong foundation before building your naming system.
The critical word here is consistent. Inconsistent UTM naming is one of the most common reasons multi-source attribution breaks down. If one team member tags a campaign as "Google_Ads" and another tags it as "google-ads" and a third uses "GoogleAds," your analytics tool treats these as three separate sources. You end up with fragmented data that understates the true contribution of any single channel.
Build a shared UTM naming convention document and make it the single source of truth for your entire team. Define the exact format for each parameter, specify which fields are required versus optional, and include examples for every channel you run. Enforce lowercase conventions across all fields to prevent case-sensitivity issues in reporting.
For paid ad platforms, use auto-tagging features where available. Google Ads auto-tagging with GCLID handles UTM-like tracking natively. For Meta, LinkedIn, and TikTok, you can configure UTM templates at the account or campaign level so every ad is automatically tagged without relying on manual entry.
Apply UTMs to every traffic-generating asset: paid ads, email campaigns, social posts, partnership links, and any external content that links back to your site. If a link can send traffic to your site, it should carry a UTM.
You can also reference Cometly's guidance on ad naming conventions to build a tagging structure that aligns your UTM parameters with your campaign naming across ad platforms, making reporting cleaner at every level.
Success indicator: Every inbound session in your analytics tool shows a clean, identifiable source. You have no unexplained spikes in direct traffic that could indicate untagged campaigns sending visitors to your site without attribution.
Step 3: Implement Server-Side Conversion Tracking for Accurate Data
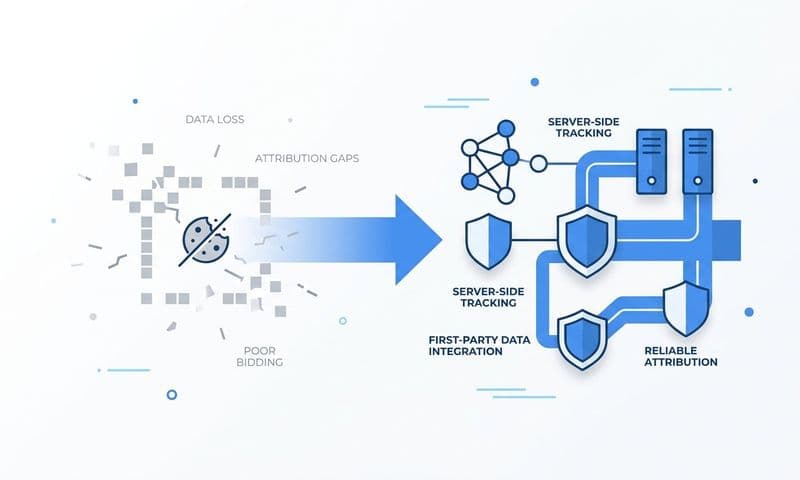
Here is a reality that many marketing teams are still catching up to: browser-based pixel tracking alone is no longer sufficient for accurate conversion data. Ad blockers, browser privacy settings, iOS privacy changes, and cookie restrictions have steadily eroded the reliability of client-side tracking. In some audience segments, a meaningful portion of conversions simply never get recorded by a standard pixel.
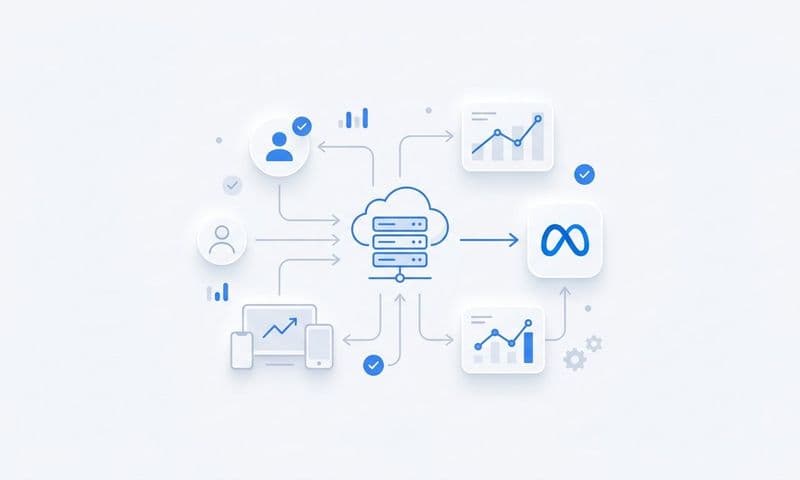
Server-side tracking solves this problem by sending conversion event data directly from your server to the ad platform, bypassing the browser entirely. Instead of relying on a pixel firing in a user's browser, your server sends the event data through a direct API connection. The result is more complete, more accurate conversion data that ad platform algorithms can actually use. Exploring how ad tracking tools help you scale with accurate data illustrates exactly why this infrastructure investment pays off.
The two most important implementations for most B2B SaaS teams are Meta's Conversion API (CAPI) and Google Enhanced Conversions. Meta CAPI allows you to send events like lead form submissions, trial signups, and closed-won deals directly from your server to Meta's platform. Google Enhanced Conversions works similarly, allowing you to send hashed first-party data alongside your standard conversion events to improve match rates.
When setting up server-side tracking, you will typically configure your backend or a middleware layer to capture the relevant event data, including any available user identifiers such as email address, phone number, or client ID, and then send that data to the platform's API endpoint. The more user identifiers you can include, the higher your match rate will be, which directly improves how well the platform can attribute conversions to specific ads.
One critical detail: if you are running both a browser pixel and server-side tracking simultaneously, you must implement event deduplication. Without it, the same conversion event gets counted twice. Once by the pixel when it fires in the browser, and once by your server when it sends the API event. Duplicate conversions inflate your reported ROAS and distort every budget decision that follows.
Deduplication works by assigning a unique event ID to each conversion event and passing that ID in both the pixel event and the server-side API call. The ad platform uses the event ID to recognize that both signals refer to the same conversion and counts it only once.
First-party data enrichment is another significant benefit of server-side tracking. When you send enriched event data that includes customer identifiers back to ad platforms, you improve the quality of signals available to their machine learning algorithms. Better signals lead to better audience targeting and more efficient campaign optimization over time.
Success indicator: Your server-side event volume matches or exceeds the event volume your pixel was previously capturing, and your deduplication logic is confirmed to be working correctly so conversion counts are not inflated.
Step 4: Connect Your CRM and Ad Platforms to a Central Attribution Layer
Most B2B SaaS teams have a tracking gap that sits right in the middle of their funnel. They can see which channels drive website visits and form fills. But once a lead enters the sales pipeline and starts moving through opportunity stages, the connection to the original marketing source gets lost. The result is that marketing reports on cost per lead while sales reports on revenue, and nobody can connect those two numbers to the same campaign.
Closing this gap requires integrating your CRM with your attribution platform so that pipeline stages and closed-won events are tied back to the original ad source that generated the lead. When a deal closes in your CRM, your attribution system should be able to trace that revenue back to the specific campaign, ad set, and even individual ad that first brought that prospect into your funnel. Reviewing the best marketing attribution platforms for revenue tracking can help you evaluate which integration approach fits your existing stack.
This is where a platform like Cometly becomes essential. Cometly connects your ad platforms, CRM data, and website events to create a unified view of the customer journey. Instead of stitching together data from three separate tools, you get a single source of truth that shows the full path from first ad click to closed-won revenue.
Beyond CRM integration, syncing your billing system is equally important. If you use Stripe or a similar payment platform, connecting it to your attribution layer allows you to pass actual revenue values back into your reporting. This matters because deal values in a CRM are often estimates, while actual billed revenue is the real number. When you can report on true ROAS based on collected revenue rather than estimated deal size, your budget decisions become significantly more defensible.
The practical output of this integration is a report that shows cost per closed deal by channel, not just cost per lead. That is a fundamentally different view of your marketing performance. A channel that generates cheap leads but rarely closes deals looks very different when you measure it against actual revenue. Conversely, a channel that generates fewer but higher-quality leads may look undervalued in a cost-per-lead report but proves its worth when you see its closed revenue contribution.
For more context on how this integration works in practice, exploring how to track offline conversions and lead attribution resources can help you understand the technical architecture behind connecting these systems.
Success indicator: You can pull a report showing which ad campaign sourced a specific closed deal, including the actual revenue amount associated with that deal, without having to manually cross-reference data from multiple tools.
Step 5: Choose an Attribution Model That Reflects Your Sales Cycle
Attribution models determine how credit for a conversion is distributed across the touchpoints in a customer's journey. Choosing the wrong model does not just affect your reporting. It actively shapes where you invest your budget, which means a poor model choice compounds over time into meaningful misallocation of spend.
The core models each tell a different story. First-touch attribution gives all credit to the first interaction a prospect had with your brand. Last-click attribution gives all credit to the final touchpoint before conversion. Linear attribution distributes credit equally across every touchpoint in the journey. Data-driven attribution uses statistical modeling to assign credit based on which touchpoints actually influenced conversion outcomes.
The right model for your business depends heavily on your sales cycle length. Short sales cycles with minimal research phases can work reasonably well with last-click attribution because the final touchpoint is often genuinely decisive. But in B2B SaaS, where sales cycles routinely span weeks or months and involve multiple decision-makers, last-click attribution systematically distorts your view of what is working.
Think about it this way: a prospect might first discover your product through a LinkedIn thought leadership ad, then read a blog post from an organic search, then attend a webinar, and finally convert after seeing a retargeting ad. Last-click attribution gives all the credit to the retargeting ad. That leads you to over-invest in retargeting and undervalue every awareness and consideration touchpoint that built the relationship in the first place.
For most B2B SaaS teams with longer sales cycles, linear attribution or a position-based model provides a more honest picture. Linear attribution gives equal credit to every touchpoint, which at minimum prevents you from completely ignoring top-of-funnel channels. Data-driven attribution is the most accurate approach when you have sufficient conversion volume, because it uses your actual data to determine which touchpoints correlate with closed deals.
One useful exercise is to run the same campaign performance data through multiple attribution models and compare the results. Channels that look strong under every model are genuinely strong. Channels that only look strong under last-click may be benefiting from the work done by earlier touchpoints. Understanding the full range of ways marketing attribution software improves digital marketing can help you see how model selection connects to broader campaign optimization.
For deeper reading on this topic, resources on the most common attribution models and revenue attribution models can help you evaluate which approach fits your specific funnel structure.
Success indicator: Your chosen attribution model produces consistent, explainable results that your marketing and sales teams both agree reflect how customers actually move through your funnel and make purchase decisions.
Step 6: Build a Reporting Dashboard That Shows Revenue by Source
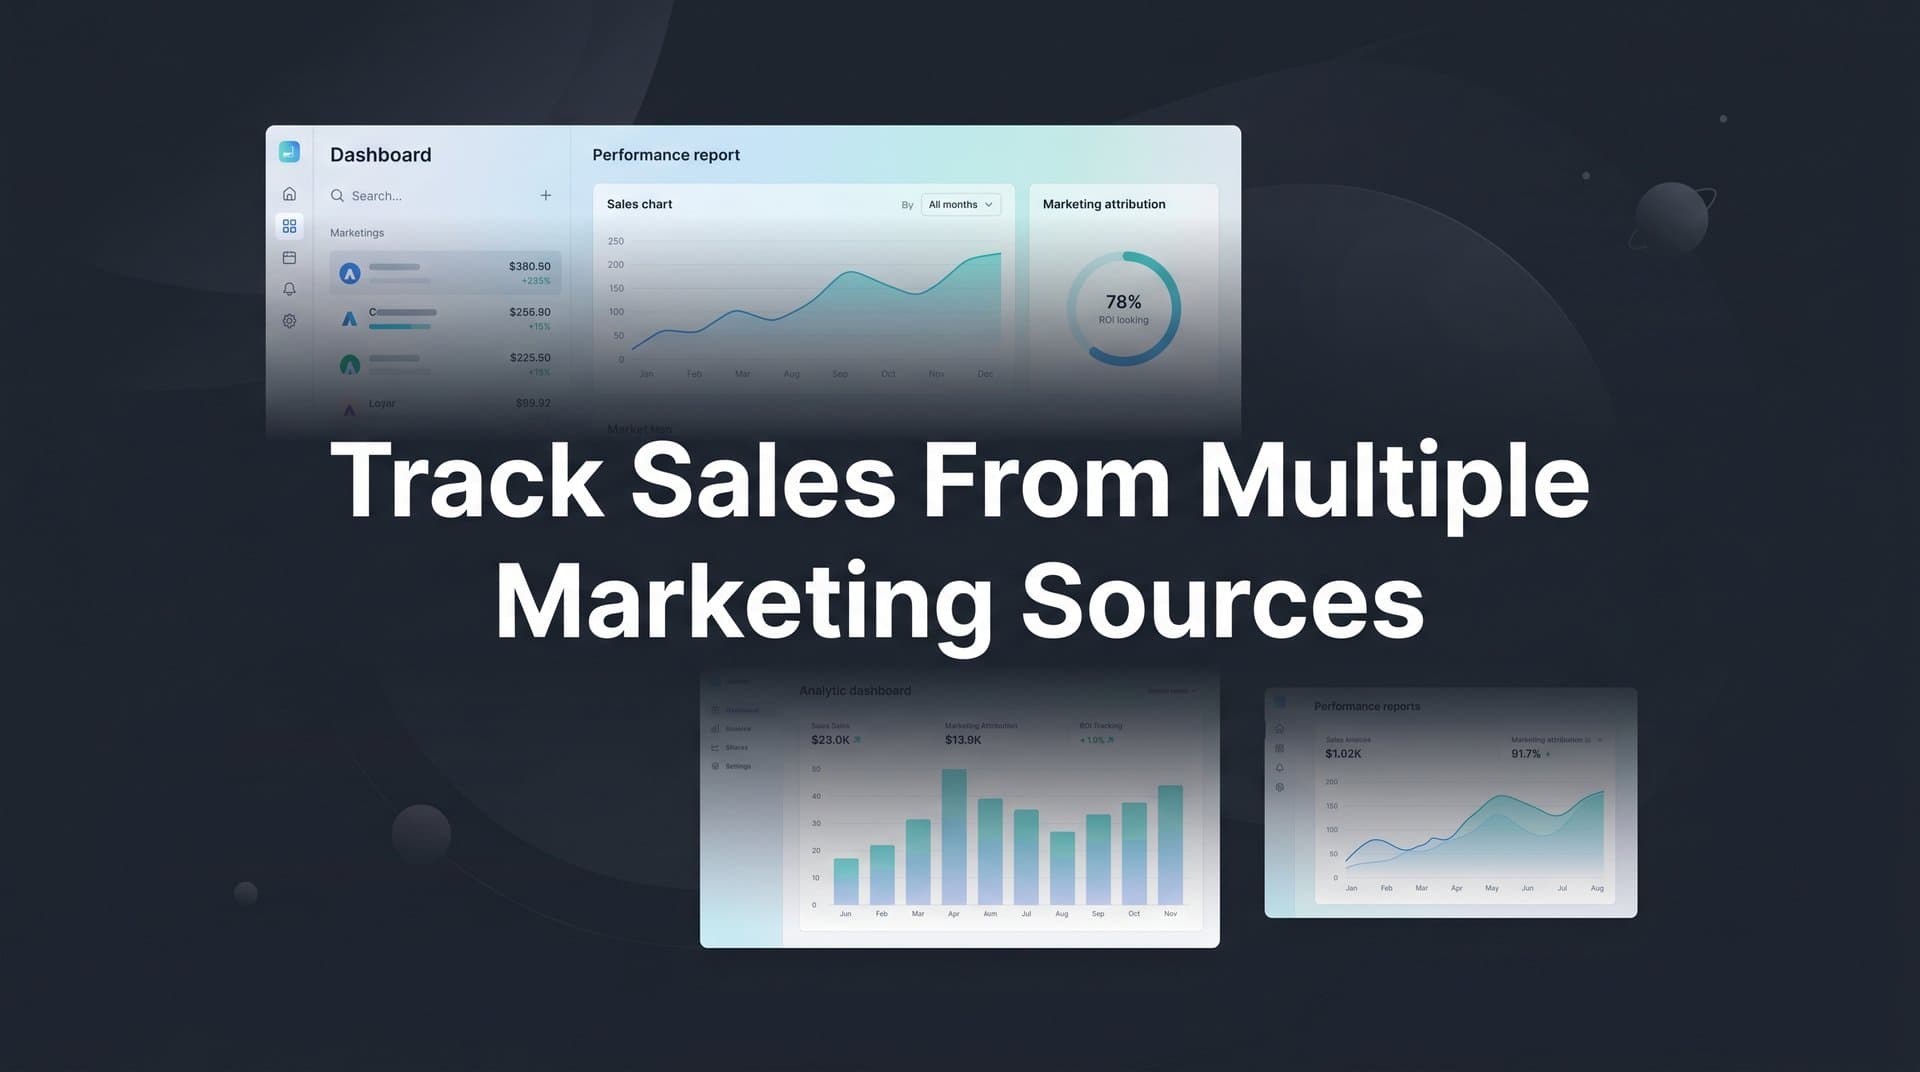
All of the tracking infrastructure you have built in the previous steps only creates value if it feeds into a reporting layer your team actually uses to make decisions. A dashboard that shows clicks and impressions but not pipeline or revenue is a vanity metrics dashboard. It looks busy, but it does not tell you where to put your next dollar.
A useful multi-source attribution dashboard includes a specific set of metrics. You need spend by channel so you can see where budget is going. You need pipeline generated by channel so you can see which sources are producing qualified opportunities. You need closed revenue by channel so you can measure actual return. And you need calculated metrics like customer acquisition cost (CAC) and return on ad spend (ROAS) based on real revenue, not estimated deal values.
Segment your reporting at multiple levels. Start at the channel level to understand which platforms are performing. Then drill into campaign level to see which specific campaigns are driving revenue. Then go deeper into ad set and individual ad to identify the specific creative or targeting combination that is producing results. The goal is to be able to answer not just "is LinkedIn working?" but "which LinkedIn campaign, targeting which audience, with which creative, is driving closed revenue?" A structured approach to measuring marketing campaign effectiveness gives you the framework to answer these questions consistently.
AI-powered recommendations add another layer of value at this stage. When your attribution platform has access to enriched conversion data connected to actual revenue, it can surface patterns that are difficult to spot manually. Platforms like Cometly use this data to identify high-performing campaigns across channels and recommend where to scale budget and where to cut, based on revenue attribution rather than surface-level engagement metrics.
Use your dashboard in weekly marketing reviews as the primary decision-making tool for budget reallocation. When a channel shows declining revenue attribution despite stable spend, that is a signal to investigate or reallocate. When a campaign shows improving cost per closed deal, that is a signal to scale.
There is also a compounding benefit to feeding enriched conversion data back to ad platforms. When Meta and Google receive better conversion signals, their algorithms improve targeting over time. The dashboard becomes not just a reporting tool but a feedback loop that continuously improves campaign performance.
For context on what metrics matter most in this type of reporting, exploring sales and marketing analytics can help you refine what your dashboard should prioritize.
Success indicator: Your team can answer the question "which channel drove the most revenue this month?" in under two minutes using the dashboard, without needing to pull data from multiple separate tools or build a manual spreadsheet.
Putting It All Together: Your Multi-Source Sales Tracking Checklist
Here is a quick-reference summary of the six-step framework for tracking sales from multiple marketing sources.
Step 1: Define your conversion events. Align your marketing and sales teams on the exact CRM stage that represents a closed sale before configuring any tracking.
Step 2: Tag every source with UTMs. Build a consistent naming convention, enforce it across your team, and apply UTMs to every traffic-generating asset and campaign.
Step 3: Implement server-side tracking. Set up Meta CAPI and Google Enhanced Conversions, configure event deduplication, and enrich your conversion events with first-party data.
Step 4: Connect your CRM and billing system. Integrate your CRM pipeline stages and Stripe revenue data with your attribution platform so closed-won revenue is tied to original ad sources.
Step 5: Choose the right attribution model. Select a model that reflects your actual sales cycle length, and revisit it periodically as your conversion volume grows and data-driven modeling becomes viable.
Step 6: Build a revenue-focused dashboard. Report on spend, pipeline, closed revenue, CAC, and ROAS by channel, campaign, and ad, and use it weekly to drive budget decisions.
It is worth emphasizing that accurate multi-source tracking is an ongoing process, not a one-time setup. Channels evolve, campaigns change, and your funnel will shift over time. The real value of this system is in the decisions it enables: cutting underperforming channels before they drain budget, scaling proven sources with confidence, and continuously improving ad platform AI with better conversion signals.
Cometly is built to unify all six of these steps in one place. From UTM tracking and server-side Conversion API integration to CRM connection, attribution modeling, and revenue reporting, Cometly gives B2B SaaS marketing teams the single source of truth they need to move from guesswork to revenue-backed decisions.
If you are ready to stop attributing revenue to gut instinct and start connecting every marketing dollar to actual closed deals, Get your free demo and see how Cometly can transform the way your team tracks, analyzes, and scales marketing performance.