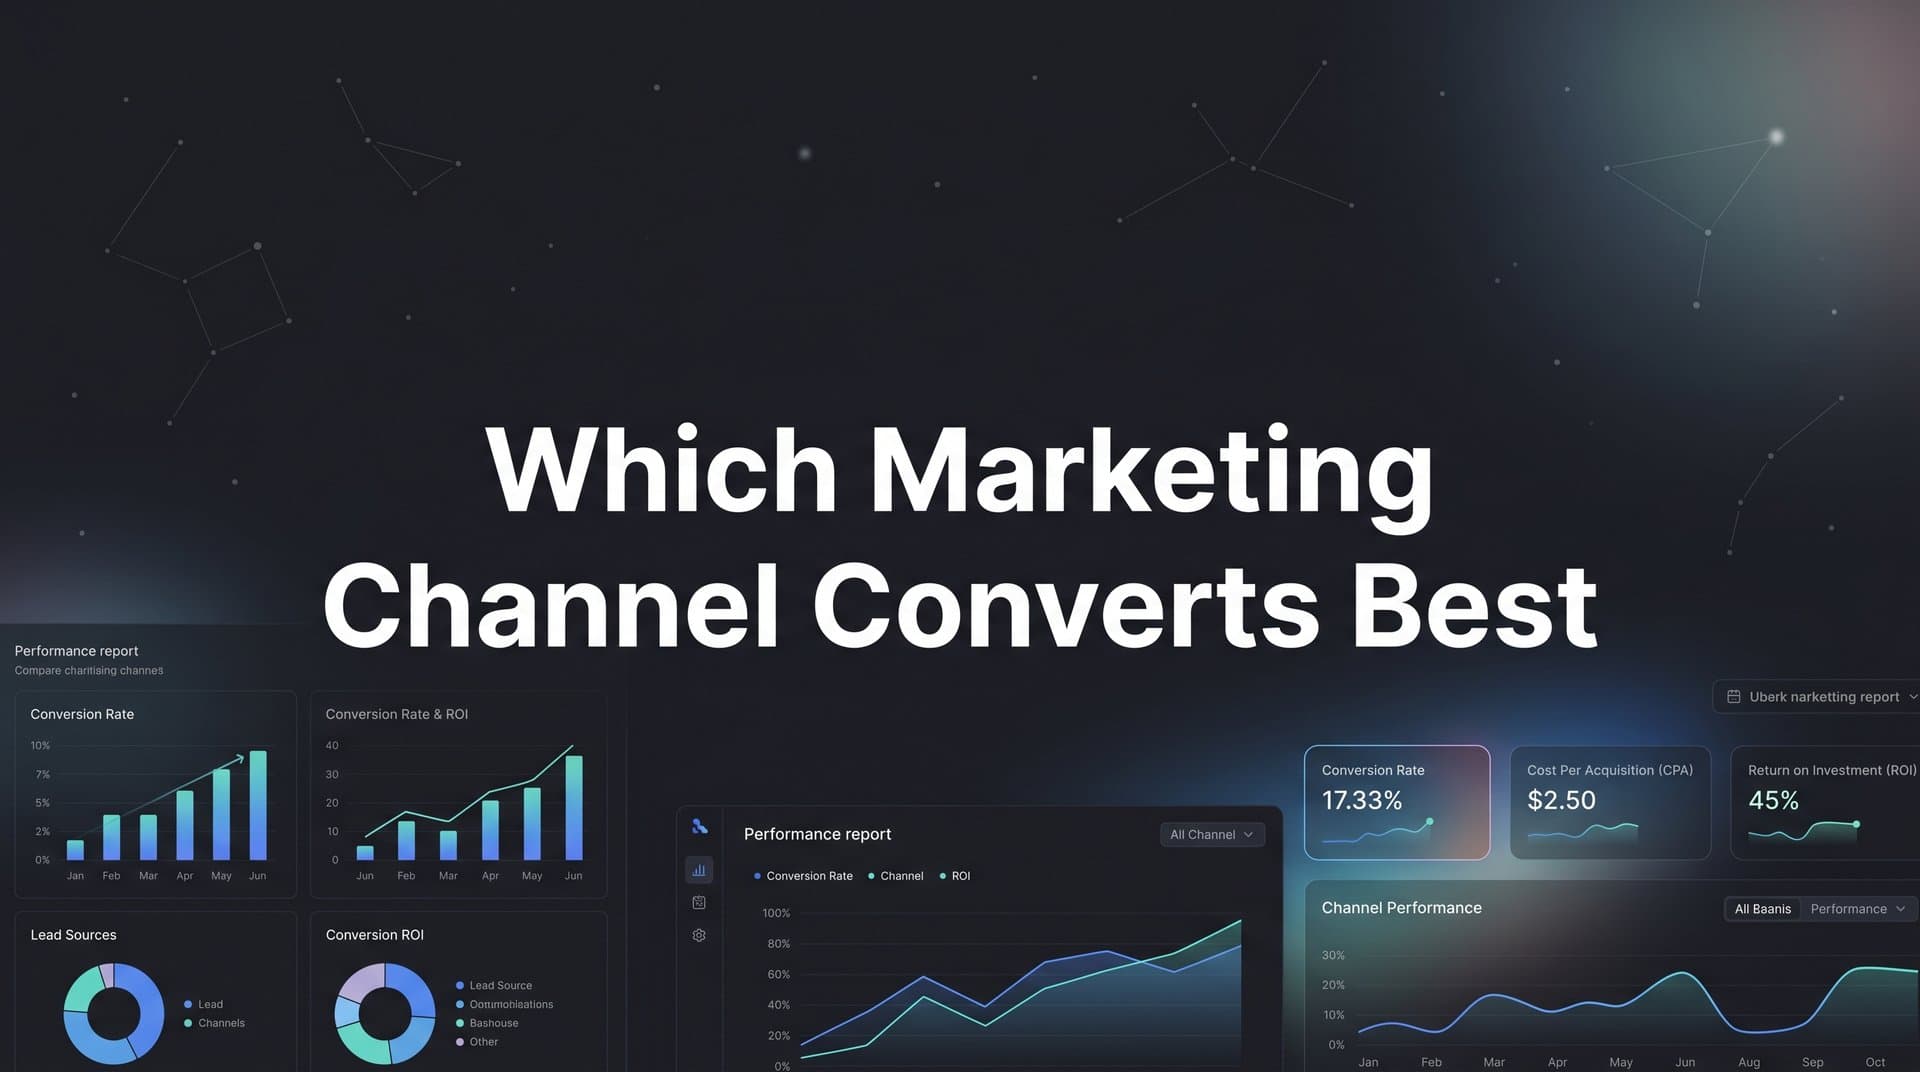
Every B2B SaaS marketing team faces the same frustrating question: where should we actually spend our budget? You run campaigns across Google, LinkedIn, email, organic search, and paid social. Leads come in from multiple directions. But when a deal closes, you have no clear answer for which channel actually drove it.
This is not a minor inconvenience. It is a strategic blind spot that leads to wasted spend, misallocated resources, and growth teams making decisions based on gut feel instead of data.
The challenge is compounded by the reality of modern B2B buying. Prospects rarely convert on a single touchpoint. They might discover you through a LinkedIn ad, read a blog post a week later, click a retargeting ad, attend a webinar, and then finally book a demo after receiving a nurture email. If you only look at last-click attribution, email gets all the credit. If you only look at first-touch, LinkedIn wins. Neither picture is accurate.
This article covers seven proven strategies to cut through the noise and identify which marketing channels are genuinely converting for your business. These are not theoretical frameworks. They are practical approaches used by data-driven B2B SaaS marketing teams to connect ad spend to pipeline and revenue. Whether you are building your attribution foundation from scratch or optimizing an existing measurement system, these strategies will help you make smarter, faster decisions about where to invest for growth.
1. Stop Relying on Last-Click and Choose the Right Attribution Model
The Challenge It Solves
Last-click attribution is the default setting for most marketing platforms, and it is one of the most misleading ways to evaluate channel performance in B2B SaaS. When every conversion credit goes to the final touchpoint before a form fill or demo booking, you end up systematically undervaluing the channels that create awareness and build consideration. Channels that work at the top and middle of your funnel get starved of budget because they never show up as the "converter."
The Strategy Explained
Multi-touch attribution models distribute conversion credit across the entire customer journey rather than awarding it all to a single interaction. The most common rule-based models include linear (equal credit to every touchpoint), time-decay (more credit to touchpoints closer to conversion), and position-based (heavy credit to first and last touch, with the remainder split across the middle).
For B2B SaaS teams with sufficient conversion volume, data-driven attribution goes further by using machine learning to assign credit based on which touchpoints statistically correlate with conversion. If your conversion volume is lower, a position-based or linear model is a more reliable starting point than trying to force a data-driven model on sparse data.
The critical insight here is that the model you choose directly changes which channel appears to convert best. This is not a bug. It is a feature, because it forces you to think carefully about what "converting best" actually means for your business.
Implementation Steps
1. Audit your current attribution setup and document which model each platform is using by default. Most ad platforms default to last-click unless you change the setting.
2. Map your average sales cycle length. B2B SaaS companies with longer cycles benefit from models that give more weight to early touchpoints, since awareness channels often drive the process even when they are not present at the close.
3. Run your conversion data through at least two different attribution modeling approaches simultaneously and compare the channel rankings side by side. Note which channels gain or lose credit when you shift models.
4. Select a primary model that aligns with how your buyers actually behave and apply it consistently across your reporting so comparisons are apples-to-apples.
Pro Tips
Avoid switching attribution models frequently. Consistency matters more than perfection when you are trying to track trends over time. Choose a model, document your reasoning, and only revisit it when you have a clear strategic reason to do so. Platforms like Cometly let you compare multiple attribution models within a single interface, which removes the need to manually reconcile data across different tools.
2. Implement Server-Side Tracking to Capture Accurate Conversion Data
The Challenge It Solves
If your channel performance data is built on incomplete conversion tracking, every comparison you make is unreliable. Browser-based pixels, which most marketers still rely on as their primary tracking method, are increasingly blocked by ad blockers, restricted by browser privacy settings, and affected by iOS changes that limit cross-site data sharing. When pixels miss conversions, some channels appear to underperform simply because their conversions are not being recorded accurately.
The Strategy Explained
Server-side tracking sends conversion events directly from your server to ad platforms and analytics tools, bypassing the browser entirely. Instead of relying on a pixel firing in a user's browser (where it can be blocked or lost), your server captures the event and transmits it reliably regardless of the user's browser settings or device.
Conversion API (CAPI) integrations, available on platforms like Meta and Google, work on the same principle. When you implement CAPI alongside your browser pixel, you create a redundant tracking system that captures conversions the pixel would have missed. This directly improves the accuracy of your channel performance data and gives ad platform algorithms better signals for optimization and targeting.
For B2B SaaS teams, this matters especially when comparing paid social channels like LinkedIn and Meta against channels like organic search or email, where tracking gaps tend to be distributed unevenly across platforms.
Implementation Steps
1. Audit your current pixel coverage by comparing browser-reported conversions against server-side or CRM-confirmed conversions. Any significant gap indicates tracking loss that is distorting your channel comparisons.
2. Set up server-side tracking for your highest-value conversion events first, typically demo requests, trial signups, and contact form submissions.
3. Implement Conversion API integrations for each ad platform you run. Prioritize Meta CAPI and Google Enhanced Conversions as starting points if you are running paid social and search.
4. Validate your setup by checking event match quality scores on each platform and confirming that server-side events are being received and attributed correctly.
Pro Tips
Do not assume your tracking is accurate just because your pixel appears to be firing. Always cross-reference pixel-reported conversions against a ground truth source like your CRM or payment processor. Cometly's server-side tracking and Conversion API integration capabilities are designed specifically to close these gaps, ensuring that channel performance comparisons are built on complete data rather than partial signals.
3. Map the Full Customer Journey Before Judging Channel Performance
The Challenge It Solves
Different channels serve different roles in the buying process. Organic content and LinkedIn awareness campaigns introduce prospects to your brand. Retargeting and comparison content move them toward a decision. Email nurture and branded search close the loop. When you judge all of these channels by the same conversion metric without accounting for their role in the journey, you end up penalizing the channels doing the most important early-stage work.
The Strategy Explained
Customer journey mapping for attribution purposes means assigning each channel a functional role based on where it typically appears in the touchpoint sequence. This is not about creating a static diagram. It is about using actual touchpoint data to understand whether a given channel primarily appears at the awareness stage, the consideration stage, or the decision stage for your specific audience.
Once you understand the roles your channels play, you can set more appropriate performance benchmarks for each. An awareness channel should be evaluated on its ability to introduce qualified prospects into the funnel, not on its last-touch conversion rate. A decision-stage channel should be evaluated on conversion efficiency and deal quality, not on reach or impression volume.
This approach also reveals which channels are genuinely versatile and which are narrowly effective. Some channels, like Google Search, tend to appear across multiple funnel stages depending on the keyword intent. Others, like LinkedIn Sponsored Content, tend to cluster at the top of the funnel for most B2B SaaS audiences.
Implementation Steps
1. Pull your multi-touch attribution data and analyze the position distribution of each channel across all recorded customer journeys. Note which channels appear most frequently as first touch, mid-funnel, and last touch.
2. Segment your journeys by deal size or customer segment if possible. High-value enterprise deals often have longer, more complex journeys than SMB deals, and channel roles may differ significantly between segments.
3. Define appropriate success metrics for each funnel stage. Awareness channels might be measured on qualified reach and first-touch pipeline influence. Decision-stage channels get measured on conversion rate and deal quality.
4. Revisit your channel performance reports and apply stage-appropriate benchmarks rather than comparing every channel against a single conversion metric.
Pro Tips
Journey mapping is not a one-time exercise. Revisit your touchpoint data every quarter, because channel roles shift as your audience evolves and as you add or remove channels from your mix. Tools that provide customer journey analytics in real time make this ongoing analysis far more manageable than manual data exports.
4. Connect Channel Data to Pipeline and Revenue, Not Just Leads
The Challenge It Solves
Lead volume is one of the most commonly used proxies for channel performance, and one of the most misleading. A channel that generates a high volume of leads but produces deals that stall in the pipeline, close at low values, or churn quickly is not a high-performing channel. It is a lead generation machine that creates sales team workload without delivering revenue. If you are optimizing for lead volume, you may be systematically scaling the wrong channels.
The Strategy Explained
Revenue attribution means connecting the channel and campaign data from your ad platforms to the actual closed-won outcomes in your CRM. When you can see which channel sourced a lead and also see what happened to that lead across the entire sales cycle, including deal size, time to close, and whether the customer retained, you have a fundamentally different picture of channel quality.
This approach often reveals surprising channel rankings. A channel that produces fewer leads might consistently generate larger deals with shorter sales cycles. Another channel might look impressive on a leads dashboard but produce deals that take twice as long to close and churn at higher rates. Without revenue-level data, you would never see this distinction.
Pipeline velocity is a particularly useful metric here. It measures how quickly leads from a given channel move through the funnel, and it captures both conversion rate and speed in a single number. Channels that generate fast-moving, high-value pipeline are almost always more valuable than channels that generate slow, low-value volume. Understanding how to evaluate marketing channels at the revenue level is what separates high-growth teams from those stuck optimizing vanity metrics.
Implementation Steps
1. Integrate your CRM with your ad platforms and attribution tool so that lead source data flows through the entire sales cycle, not just the initial conversion event.
2. Define the revenue metrics you will use to evaluate channels: closed-won revenue, average deal size, sales cycle length, and customer lifetime value are the most informative starting points.
3. Build a channel performance report that shows both lead volume and revenue contribution side by side. Look for channels where the ratio diverges significantly, because those gaps reveal the biggest optimization opportunities.
4. Share this data with your sales team. They often have qualitative insights about lead quality by source that can help you interpret the quantitative patterns you are seeing.
Pro Tips
Cometly integrates directly with Stripe and CRM platforms to connect ad spend data with actual revenue outcomes. This is the kind of end-to-end visibility that transforms channel comparison from a guessing game into a data-driven decision. If your current stack requires manual data exports to connect these dots, you are introducing both lag and error into your analysis.
5. Use Cohort Analysis to Compare Channel Performance Over Time
The Challenge It Solves
Point-in-time conversion reports answer the question "what converted this month?" but they do not answer the more important question: "which channels are producing customers who actually stay and grow?" In B2B SaaS, the difference between a customer who churns after three months and one who expands their contract over two years is enormous. A channel comparison that only looks at initial conversion rates will never surface this distinction.
The Strategy Explained
Cohort analysis groups customers by their acquisition source and then tracks their behavior over time. When you apply this to channel comparison, you are asking: of all the customers acquired through LinkedIn in Q3, how many converted from trial to paid, how long did it take, what was their average contract value, and how many are still customers today?
This approach is particularly powerful for B2B SaaS companies with longer sales cycles. A 90-day or 180-day cohort window gives you enough time to see the full conversion arc from initial lead to closed deal, which a monthly snapshot will always truncate prematurely.
Cohort analysis also reveals churn patterns by channel, which is a critical input for lifetime value calculations. If customers acquired through a particular channel churn at meaningfully higher rates, the cost-per-acquisition advantage of that channel may disappear entirely when you factor in retention. This is why marketing attribution tools built for B2B SaaS increasingly emphasize long-term revenue metrics alongside initial conversion data.
Implementation Steps
1. Define your cohort grouping logic. For channel comparison purposes, group by first-touch channel, primary channel (the one that appeared most frequently in the journey), or the channel credited in your chosen attribution model.
2. Set a cohort window that reflects your typical sales cycle. If your average time from lead to close is 60 days, use a 90-day window to capture the full conversion curve with some buffer.
3. Track cohort conversion rates, average deal size, time to convert, and retention at 90, 180, and 365 days for each channel cohort.
4. Build a simple comparison table that shows these metrics side by side across channels. Look for channels where short-term conversion rates look similar but long-term retention diverges significantly.
Pro Tips
Do not confuse cohort size with cohort quality. A smaller cohort from a high-intent channel can outperform a large cohort from a broad awareness channel on every revenue metric that matters. Resist the temptation to dismiss channels with lower volume before you have seen the full cohort performance picture. This is where pipeline and revenue attribution tools that retain historical data become essential.
6. Run Controlled Budget Experiments to Validate Channel Hypotheses
The Challenge It Solves
Attribution data is correlational. It tells you which channels were present in the journeys of customers who converted, but it cannot tell you whether those channels caused the conversion. This distinction matters enormously when you are making budget allocation decisions. A channel might consistently appear in high-converting journeys simply because your best prospects happen to use that channel for other reasons, not because the channel itself is driving their decision.
The Strategy Explained
Controlled budget experiments, often called incrementality tests or holdout tests, help you move from correlation to causation. The basic structure is straightforward: you take a defined audience segment, exclude a portion of them from a specific channel's targeting, and then compare conversion rates between the exposed group and the holdout group. If the exposed group converts at meaningfully higher rates, the channel is likely driving incremental conversions. If the rates are similar, the channel may be capturing conversions that would have happened anyway.
For B2B SaaS teams, holdout tests work particularly well for retargeting campaigns, email nurture sequences, and LinkedIn audience targeting. These are channels where the question of incrementality is most ambiguous because they target people who are already in your funnel.
The goal is not to run these tests constantly. It is to periodically validate the assumptions underlying your attribution model, especially before making significant marketing budget allocation shifts based on channel performance data.
Implementation Steps
1. Select a channel hypothesis to test. Start with a channel that your attribution data suggests is high-performing but where you have some uncertainty about whether it is genuinely driving conversions or just appearing at the right moment.
2. Define your test audience and split it into an exposed group and a holdout group. The holdout group should be large enough to produce statistically meaningful results given your typical conversion rates.
3. Run the test for a duration that covers at least one full average sales cycle. Shorter tests will not capture the conversion patterns that matter most in B2B SaaS.
4. Compare conversion rates, pipeline contribution, and deal quality between the two groups. Document your findings and use them to calibrate your attribution model and budget allocation.
Pro Tips
Keep your first experiments simple. Complex multi-variable tests are harder to interpret and easier to contaminate with confounding factors. A clean, single-variable holdout test on one channel with a well-defined audience will give you more actionable insight than an elaborate experiment design. Use the results to inform, not dictate, your budget decisions alongside your attribution data.
7. Centralize All Channel Data in a Single Attribution Dashboard
The Challenge It Solves
When your channel performance data lives in separate platforms, each reporting its own version of conversions and revenue, you end up with conflicting narratives that paralyze budget decisions. Google Ads claims credit for a conversion. LinkedIn claims the same conversion. Your email platform has a different number entirely. Your team spends more time reconciling data than acting on it, and trust in the numbers erodes across the organization.
The Strategy Explained
A unified attribution dashboard consolidates data from your ad platforms, CRM, website analytics, and conversion tracking into a single source of truth. Instead of logging into five different platforms and manually reconciling numbers, your entire marketing and growth team works from one consistent dataset with one consistent attribution model applied across all channels.
This matters for channel comparison in a very practical way. When all channels are measured using the same methodology, in the same interface, with the same attribution model applied consistently, the comparisons you make are genuinely apples-to-apples. You can see which channel drives the most first-touch pipeline, which drives the most closed-won revenue, and which has the best return on ad spend, all without switching tabs or questioning whether the numbers are comparable.
Centralization also accelerates decision-making. When insights are immediately visible and trusted by the whole team, budget reallocation decisions happen faster and with more confidence. You stop waiting for the monthly data reconciliation meeting and start acting on what the data is showing you in real time. The best marketing channel attribution software eliminates this reconciliation burden entirely by applying a unified model across every data source from day one.
Implementation Steps
1. Audit your current data sources and identify every platform that holds channel performance data relevant to your attribution analysis. Include ad platforms, your CRM, your website analytics tool, and any marketing automation platforms.
2. Evaluate attribution platforms that offer native integrations with your existing stack. The fewer manual data transfers required, the more reliable and timely your unified data will be.
3. Define the metrics and attribution model your unified dashboard will use as the organizational standard. Document this clearly so that all stakeholders understand what they are looking at and why the numbers may differ from platform-native reports.
4. Establish a regular review cadence where the team uses the unified dashboard as the primary source for channel performance discussions and budget decisions.
Pro Tips
Cometly is built specifically for this use case. It connects your ad platforms, CRM, and website into one attribution platform with over 70 native integrations, so you get a single, trusted view of which channels, campaigns, and touchpoints are genuinely driving revenue. The AI-driven recommendations layer on top of that unified data to surface optimization opportunities you might otherwise miss when reviewing reports manually.
Putting It All Together: Your Attribution Implementation Roadmap
Identifying which marketing channel converts best is not a one-time analysis. It is an ongoing discipline that requires the right measurement infrastructure, the right attribution models, and a genuine commitment to connecting marketing activity to revenue outcomes.
The seven strategies in this article build on each other in a logical sequence. You start by choosing an attribution model that reflects how your buyers actually behave. You reinforce that model with accurate server-side tracking so the data you are working with is complete. You map the full customer journey so no channel is unfairly penalized for playing an awareness role. You connect channel data to pipeline and revenue rather than stopping at lead counts. You use cohort analysis to understand long-term conversion patterns that monthly snapshots will always miss. You validate your assumptions through controlled experiments. And you bring it all together in a centralized dashboard that gives your entire team a single, trusted view of performance.
For B2B SaaS teams, the stakes are high. Misidentifying your best-converting channel can mean cutting the campaigns that are quietly driving your best customers while scaling the ones producing low-quality leads. Every strategy in this article is designed to reduce that risk and give you the clarity to make budget decisions you can defend with data.
The good news is that you do not need to implement all seven strategies simultaneously. Start with your attribution model and tracking foundation. Build from there. Each layer of measurement you add makes your channel comparisons more accurate and your decisions more confident.
Ready to see which channels are genuinely driving your revenue? Get your free demo of Cometly and start connecting every touchpoint to the outcomes that actually matter for your business.