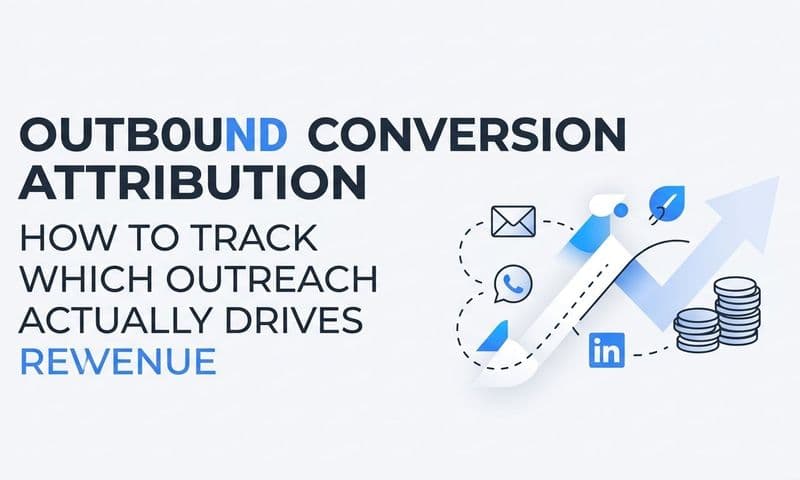
You're running paid ads, spending real budget, and leads are coming in. But when it comes time to answer "which ad actually drove that sale?", the data goes dark. This is one of the most common and costly problems in B2B SaaS marketing.
Without a clear line connecting your ad spend to closed revenue, you're making budget decisions based on incomplete information. You might be scaling campaigns that look good on the surface but contribute nothing to pipeline. Or worse, pausing campaigns that are quietly driving your best customers.
The gap between ad click and closed deal is where attribution breaks down for most teams. Pixels lose data after iOS changes and browser restrictions. CRM data sits in a silo, disconnected from your ad platforms. Sales cycles stretch across weeks or months, making it nearly impossible to connect a LinkedIn click in January to a deal closed in March.
The good news is that this is a solvable problem. With the right tracking infrastructure, you can connect every ad touchpoint to actual revenue, not just form fills or clicks.
This guide walks you through the exact steps to go from "I have no idea which ads are driving sales" to "I know exactly where every dollar is going and what it returns." Whether you're running campaigns on Meta, Google, LinkedIn, or TikTok, the same foundational approach applies.
You will audit your current setup, identify where tracking breaks, implement server-side data collection, connect your CRM and revenue data, and build a reporting layer that shows real attribution. By the end, you will have a working system that ties ad spend directly to pipeline and closed revenue.
Step 1: Audit Your Current Tracking Setup
Before you fix anything, you need to understand exactly where your current tracking breaks. Most teams assume their tracking is working because data is flowing somewhere. But flowing data and accurate data are two very different things.
Start by mapping every touchpoint in your funnel from end to end. This means documenting your ad platforms, landing pages, form submissions, CRM stages, and payment events. Write it out. A simple spreadsheet works fine. The goal is to see the full chain on paper so you can identify where the links are missing.
Next, check for missing UTM parameters. Pull a sample of recent leads from your CRM and look at the source field. How many have a clear, traceable origin? How many show up as "direct" or "unknown"? A high percentage of unattributed leads is a strong signal that UTMs are either missing from your ad URLs or not being passed through to your CRM correctly.
Then audit your pixel and event setup. Open your ad platform event managers and check which events are firing and how consistently. Look for events that fire on some visits but not others, or conversion counts that seem lower than expected compared to your CRM data. Inconsistent event firing is a common sign of a broken pixel implementation.
Compare your ad platform dashboards against your CRM data. If Meta reports 50 leads from a campaign but your CRM only shows 30 from that source, something is breaking in the middle. That gap represents real budget being spent on conversions you can not accurately measure.
Pay close attention to whether you are relying entirely on browser-based pixel tracking. This is the most common cause of data loss today. Ad blockers, Safari's Intelligent Tracking Prevention, and iOS privacy changes all reduce the accuracy of browser-side pixels. If your entire attribution system depends on a pixel firing in the browser, you are already working with incomplete data.
Finally, document which revenue-stage events are completely missing from your tracking. Most teams track form submissions but stop there. Events like demo attended, trial started, opportunity created, and deal closed are rarely connected back to the original ad source. These are the events that actually matter for measuring revenue attribution.
Success indicator: You have a written map of your funnel with clear gaps marked where tracking fails or data goes missing. This document becomes your roadmap for the steps that follow.
Step 2: Set Up Proper UTM Tagging Across Every Campaign
UTM parameters are the foundation of ad-to-sale tracking. Without them, you can not reliably connect a closed deal in your CRM to the campaign that started the journey. Getting this right is not complicated, but it requires consistency across your entire team.
Start by creating a standardized UTM naming convention that covers all five parameters: source, medium, campaign, content, and term. Define exactly how each field should be formatted. For example, decide whether you use "facebook" or "meta" as the source, whether campaign names include dates, and whether you use hyphens or underscores between words. These decisions matter because inconsistent naming breaks your ability to aggregate data cleanly in reporting.
Build a shared UTM builder template that everyone on your team uses. This can be a simple Google Sheet with dropdowns for approved values. The goal is to remove guesswork and prevent one person from tagging a campaign as "LinkedIn-Paid" while another uses "linkedin_ads." Both are technically UTMs, but they will show up as separate sources in your data. If you want a ready-made starting point, a marketing campaign tracking spreadsheet can give your team a consistent framework to work from.
Apply UTMs to every ad URL, not just at the campaign level. If you have five ad creatives in a single campaign, each one should have a unique UTM content parameter so you can trace which specific creative influenced a sale. This level of granularity is what separates teams that know their data from teams that are guessing.
The critical step that most teams miss is ensuring UTM parameters are passed through to your CRM on every lead record. It is not enough for UTMs to land in Google Analytics. When a form is submitted, the UTM values from the URL need to be captured as hidden fields and written directly to the lead record in your CRM. If this connection does not exist, you will always lose the source data the moment a lead enters your sales process.
Before launching any campaign at scale, test each URL manually. Click the link, submit a test form, and confirm that the UTM values appear correctly on the lead record in your CRM. This takes five minutes and prevents weeks of bad data. Understanding what UTM tracking is and how it helps your marketing is essential before building this system at scale.
Common pitfall: UTMs get stripped when users land on redirected URLs, or when CRM integrations do not capture the original source field. Check your redirect chain and confirm your CRM form integration is configured to capture UTM data.
Success indicator: Every lead in your CRM has a traceable source tied back to a specific ad, campaign, and channel. When you filter your CRM by source, you can see exactly which campaigns are generating leads.
Step 3: Implement Server-Side Conversion Tracking
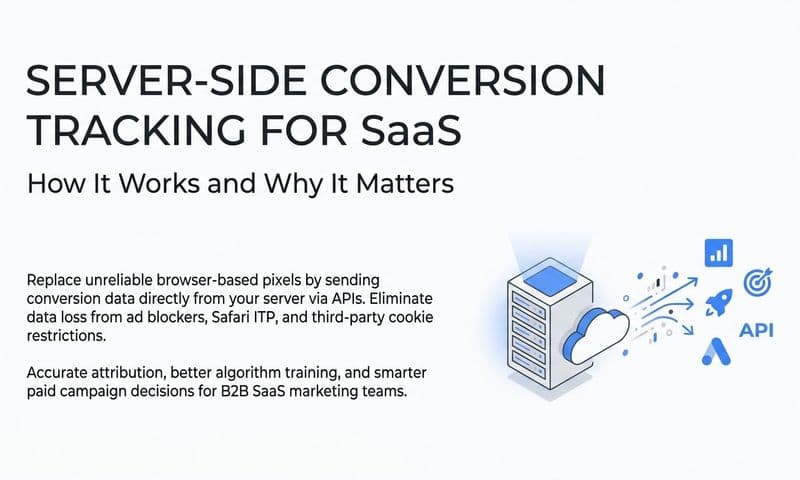
This is the step that most teams skip, and it is often the biggest reason their tracking is broken. Browser-based pixels alone are no longer sufficient for accurate conversion tracking. The landscape has changed significantly, and relying on a pixel in the browser means you are accepting a meaningful data loss by default.
Here is why. Ad blockers prevent pixels from firing entirely. Safari's Intelligent Tracking Prevention limits the lifespan of cookies used for attribution. iOS privacy changes have reduced the ability of pixels to match users back to their ad interactions. The result is that a browser-only tracking setup can miss a substantial portion of real conversions, leading to underreported results and poor optimization signals being sent back to your ad platforms.
Server-side tracking solves this by sending conversion data directly from your server to the ad platform, bypassing the browser entirely. When a user submits a form or completes a purchase, your server fires the conversion event directly to Meta or Google rather than waiting for a pixel to load in the user's browser. This approach is far more reliable and significantly less affected by browser restrictions.
For Meta, this means setting up the Conversion API (CAPI). For Google, it means implementing Enhanced Conversions. Both systems allow you to send server-side events for key actions like form submissions, trial starts, and demo bookings.
When you send server-side events, include first-party data such as hashed email addresses and phone numbers. This improves event match quality, which is the score Meta and Google use to determine how accurately they can match a conversion back to a specific user and their ad interaction. Higher match quality means better optimization and more accurate reporting.
One important technical detail: implement event deduplication. If you are running both a browser pixel and server-side events simultaneously, the same conversion can be counted twice. Both Meta and Google have deduplication mechanisms, but you need to configure them correctly by passing a consistent event ID that allows the platform to identify and discard duplicate events. Teams dealing with Facebook ads reporting discrepancies often trace the root cause back to missing deduplication logic.
Platforms like Cometly handle server-side tracking natively. Rather than building and maintaining a custom CAPI or Enhanced Conversions implementation, Cometly sends enriched conversion events back to Meta, Google, and other ad platforms automatically, including the first-party data needed to maximize match quality.
Success indicator: Your event match quality scores improve in Meta Events Manager, and your reported conversion volume aligns more closely with actual CRM data. You should also see improved optimization performance from your ad campaigns as the platforms receive cleaner, more complete signals.
Step 4: Connect Your CRM and Revenue Data to Ad Platforms
Tracking form submissions is a starting point, not a finish line. For B2B revenue attribution to actually work, you need to connect the downstream events that reflect real business outcomes: demo attended, trial converted, opportunity created, and deal closed.
Start by identifying the revenue-stage events that matter most for your business. Every B2B SaaS company has a slightly different funnel, but the principle is the same. You want to track the moments that indicate a lead is moving toward becoming a paying customer, not just the moment they raised their hand.
Map these CRM stages to conversion events that can be sent back to your ad platforms. This is typically done through offline conversion uploads or server-side events triggered by CRM stage changes. When a deal moves to "closed won" in your CRM, that event should fire back to the ad platform with the original ad click information attached, so the platform can credit the right campaign. Understanding how to track offline conversions is critical for making this connection work reliably.
Connecting your payment processor data closes the loop completely. If you use Stripe, connecting it to your attribution system means you can see actual revenue figures tied to the original ad source, not just lead counts or pipeline estimates. This is the difference between knowing which campaigns generate leads and knowing which campaigns generate revenue.
Cometly integrates Stripe revenue data directly with ad platform data, giving you a single view of which campaigns generate actual paying customers. Instead of manually reconciling your Stripe dashboard against your ad reports, the connection is automatic and real-time.
For longer B2B sales cycles, configure your conversion windows appropriately. Most ad platforms default to short attribution windows that do not reflect the reality of a 60 or 90-day sales cycle. If a prospect clicked a LinkedIn ad in January and closed in March, you need your attribution system to recognize and record that connection. Delayed conversion tracking and offline conversion uploads allow you to send deal-closed events back to the platform with the original click data, even months later.
Success indicator: You can pull a report showing ad spend by campaign alongside pipeline value and closed revenue without manual spreadsheet work. The data flows automatically from your ad platforms through your CRM and payment processor into a single view.
Step 5: Choose the Right Attribution Model for Your Sales Cycle
Once your tracking infrastructure is in place, the next question is how to assign credit across the multiple touchpoints in your customer journey. This is where attribution models come in, and choosing the wrong one can lead to budget decisions that are just as misleading as having no tracking at all.
Different models tell fundamentally different stories about your marketing performance. Last-click attribution gives all the credit to the final touchpoint before a conversion. This tends to overvalue retargeting campaigns and branded search, because those channels often appear at the end of a journey that started somewhere else entirely. If you are making budget decisions based purely on last-click data, you are likely underfunding the awareness and consideration channels that are actually starting your best deals.
First-touch attribution goes to the opposite extreme, crediting the very first interaction a prospect had with your brand. This is useful for understanding which channels are generating awareness, but it ignores everything that happened in between to move the prospect toward a decision.
Linear attribution distributes credit equally across every touchpoint in the journey. It is a more balanced view, but it treats a brand awareness impression the same as a high-intent demo request, which is not always an accurate reflection of how each touchpoint influenced the outcome.
For B2B SaaS companies with multi-touch sales cycles, data-driven or linear attribution models typically reflect reality more accurately than single-touch models. Data-driven attribution uses machine learning to assign fractional credit based on actual conversion patterns in your data, making it the most sophisticated option when you have sufficient conversion volume to support it.
The most important practice is to compare models side by side rather than committing to one view. The same campaign can look like a star performer under last-click and a marginal contributor under linear attribution. Understanding both perspectives helps you make more nuanced budget decisions.
Cometly allows you to compare multiple attribution models in one dashboard so you can see how your budget allocation decisions would change under each model before making any changes.
Success indicator: You can articulate which channels influence pipeline at different stages of the B2B customer journey and adjust spend accordingly, rather than defaulting to whichever channel claims the most last-click conversions.
Step 6: Build a Revenue Attribution Dashboard
All the tracking infrastructure you have built only delivers value if it is visible in a format your team can act on. A revenue attribution dashboard consolidates everything into a single view that connects ad spend to leads, pipeline, and closed revenue.
The dashboard should show performance by channel and campaign, not just by platform. You want to be able to look at a single screen and see how much you spent on LinkedIn last month, how many opportunities it generated, what that pipeline is worth, and how much of it has closed. That is the level of clarity that changes how marketing teams operate.
Include these key metrics in your reporting: cost per lead, cost per opportunity, cost per acquisition, and return on ad spend tied to actual revenue. Most teams track cost per lead but stop there. Cost per acquisition and revenue-based ROAS are the metrics that connect marketing activity to business outcomes and give you the data you need to justify budget increases or reallocations.
Set up automated reporting so your team reviews attribution data weekly rather than pulling manual reports before quarterly reviews. The teams that make the best decisions are the ones reviewing data consistently, not the ones who do a deep dive once a quarter when it is already too late to course-correct. Using paid ads analytics as a regular practice rather than a reactive one is what separates high-performing teams from the rest.
Use your dashboard to identify campaigns with strong lead volume but poor close rates. This pattern often signals a lead quality problem rather than a volume problem. A campaign generating 100 leads per month with a 1% close rate is less valuable than a campaign generating 20 leads with a 15% close rate. Without revenue attribution data, you would never see this distinction.
Cometly provides a real-time attribution dashboard that connects ad platforms, CRM data, and revenue in one place, built specifically for B2B SaaS teams. Sharing dashboard access with your sales team also creates alignment: they can see which marketing sources generate the highest-quality pipeline, which helps prioritize follow-up and improve handoff quality.
Success indicator: Your weekly marketing review starts with attribution data, and budget decisions are made based on revenue contribution rather than clicks, impressions, or platform-reported conversions.
Step 7: Use Attribution Insights to Optimize and Scale
Building the system is the foundation. Using it consistently is what drives compounding returns. Once you have clean attribution data flowing into a live dashboard, the real work of optimization begins.
Start by reviewing your attribution data to identify your highest-revenue campaigns. These are not necessarily your highest-volume or lowest-cost-per-lead campaigns. They are the campaigns whose leads actually convert to paying customers at a strong rate. Shift budget toward these campaigns with confidence, knowing the data backs the decision.
Feed enriched conversion data back to Meta and Google to improve their machine learning performance. When ad platforms receive accurate signals about which users became paying customers, their algorithms can find more people who match that profile. This is one of the highest-leverage actions you can take: better data in means better targeting out. Server-side events with first-party data are the mechanism that makes this possible.
Use AI-driven insights to surface which ad creatives, audiences, and channels consistently generate pipeline and revenue across your funnel. The goal is to move beyond manual analysis and let your attribution data surface patterns you might not spot on your own. Which creative angle drives the highest-quality leads? Which audience segment has the best close rate? These are the questions that AI ads optimization can help answer at scale.
Identify underperforming campaigns that consume budget without contributing to revenue. These are campaigns that may look acceptable on platform metrics but show up as low or zero contributors in your revenue attribution view. Pausing or restructuring these campaigns frees budget for channels and creatives that are actually working.
When testing new channels or audiences, use attribution data to evaluate their revenue contribution before scaling. A new channel might drive cheap clicks but produce leads that never close. Attribution data lets you make that determination quickly rather than waiting months to find out.
Cometly's AI ads manager surfaces recommendations based on actual revenue attribution, helping teams prioritize spend on what works rather than what looks good in a platform dashboard.
Success indicator: Your cost per acquisition decreases over time as you reallocate budget based on revenue attribution data. You are making fewer gut-feel decisions and more data-backed ones, and the results reflect that shift.
Putting It All Together
Fixing broken ad-to-sale tracking is not a one-time task. It is a foundational system that compounds in value over time. When you know exactly which ads drive revenue, every budget decision becomes sharper, every campaign test becomes more meaningful, and every dollar works harder.
Start with the audit in Step 1 to understand where your current tracking breaks. Then work through server-side tracking, CRM integration, and attribution modeling to build a complete picture. The teams that solve this problem stop guessing and start scaling with data.
Use this checklist to confirm your setup is complete:
UTM parameters: Applied consistently across all campaigns, with values passing through to your CRM on every lead record.
Server-side tracking: Live for key conversion events, with event deduplication configured to prevent double-counting.
CRM and revenue data: Connected and passing revenue-stage events back to your ad platforms, including closed-won deals and payment data.
Attribution model: Selected and applied to your reporting, with the ability to compare models side by side.
Live dashboard: Showing ad spend alongside pipeline and closed revenue, reviewed weekly by your marketing and sales teams.
Cometly is built to help B2B SaaS teams complete every step in this guide. It connects your ad platforms, CRM, website, and payment data into a single attribution system that shows exactly which ads drive sales. If you are ready to stop flying blind on ad spend, Cometly gives you the infrastructure to track, analyze, and scale with confidence.
Ready to elevate your marketing game with precision and confidence? Discover how Cometly's AI-driven recommendations can transform your ad strategy. Get your free demo today and start capturing every touchpoint to maximize your conversions.