

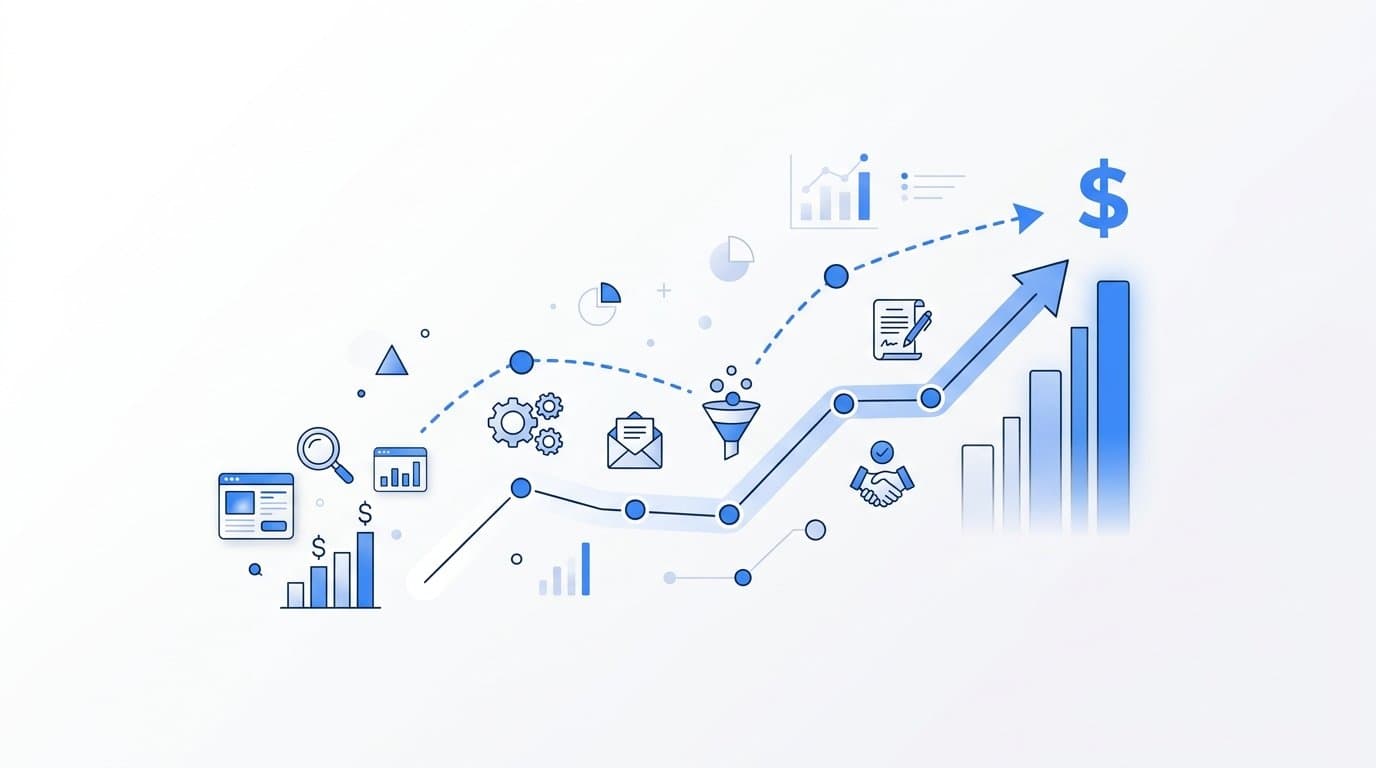
Most B2B SaaS marketing teams can tell you how many leads they generated last quarter. Far fewer can tell you which specific ads, channels, or touchpoints actually drove those leads to become paying customers. That gap is exactly what a well-built customer journey plan is designed to close.
A customer journey plan is not a theoretical exercise. It is a structured framework that maps every interaction a prospect has with your brand, from the first ad impression to the moment they sign a contract. When built correctly, it becomes the foundation for smarter budget decisions, more accurate attribution, and campaigns that actually scale.
The challenge is that most teams approach customer journey planning as a marketing strategy document rather than a data infrastructure decision. They map stages on a whiteboard, assign content to each phase, and move on. What they miss is the tracking layer that turns that map into actionable intelligence.
This guide walks you through a practical, step-by-step process for building a customer journey plan that does more than describe your buyer. It shows you how to instrument each stage with proper tracking, connect touchpoints to revenue outcomes, and use attribution data to continuously improve performance.
Whether you are running paid ads on Meta and Google, nurturing leads through email sequences, or managing a complex multi-touch sales cycle, this process applies. By the end, you will have a plan that not only maps the journey but measures it with enough precision to make confident decisions about where to invest your marketing budget.
Each step builds on the previous one, so follow the sequence closely. The payoff is a customer journey plan that functions as a live, data-driven asset rather than a static document collecting dust in a shared folder.
Step 1: Define Your Buyer Stages and Key Decision Points
Before you can track a customer journey, you need to agree on what that journey actually looks like. This sounds straightforward, but it is where many B2B SaaS teams immediately run into trouble. Marketing defines the funnel one way, sales defines the pipeline another way, and the two never quite line up in the data.
Start by identifying the distinct stages your buyers move through from first awareness to closed-won. For most B2B SaaS companies, this falls into five to seven stages. Going beyond seven tends to create unnecessary complexity without adding meaningful insight. A typical structure might look like this:
Awareness: The prospect encounters your brand for the first time, whether through a paid ad, organic search result, social post, or word-of-mouth mention.
Consideration: The prospect is actively evaluating solutions. They are reading comparison content, downloading resources, attending webinars, or signing up for a free trial.
Evaluation: The prospect is in direct conversation with your team. They have booked a demo, are in a sales sequence, or are conducting a structured product evaluation.
Decision: The prospect is ready to commit. They are reviewing contracts, negotiating terms, or finalizing their internal approval process.
Closed-Won: The deal is signed and revenue is recognized. This stage is critical because it is where your attribution data becomes truly meaningful.
The key principle here is to name each stage based on buyer behavior and intent signals, not internal sales terminology. A stage called "SQL" means something specific to your revenue operations team, but it tells you nothing about what the buyer is actually doing or thinking at that moment. When you define stages around buyer behavior, the entire team from marketing to sales can describe each stage in consistent language.
Once your stages are defined, map the critical decision points where prospects either advance or drop off. These are the moments that matter most for optimization. A prospect who downloads a pricing guide is signaling something different from one who books a demo directly. Capturing those behavioral signals at each transition is what transforms your journey map from a diagram into a measurement framework.
Finally, align your stage definitions with your CRM pipeline. If your CRM uses different language than your marketing platform, your attribution data will fragment at exactly the moment you need it to connect. This alignment is a prerequisite for everything that follows.
Success indicator: Every team member from marketing to sales can describe each stage in the same language, and those definitions match what lives in your CRM.
Step 2: Identify Every Touchpoint and Channel by Stage
Now that your stages are defined, the next task is to build a complete inventory of every channel and asset that touches a prospect at each stage. Think of this as the raw material for your tracking plan. You cannot measure what you have not first identified.
Work through each stage and list every touchpoint a prospect might encounter. Be exhaustive here. Missing a touchpoint at this stage means missing a tracking opportunity later.
Paid touchpoints typically include search ads, social ads on Meta and LinkedIn, display retargeting, YouTube pre-roll, and sponsored content. These require UTM parameters and pixel or API-based tracking to attribute properly.
Organic touchpoints include blog content, SEO landing pages, organic social posts, and YouTube videos. These are often undertracked because they do not have the same built-in attribution infrastructure as paid channels.
Direct and referral touchpoints include direct website visits, referral traffic from partner sites, review platforms like G2 or Capterra, and word-of-mouth introductions. These can be some of your highest-intent touchpoints and are frequently invisible in standard attribution setups.
Sales and outreach touchpoints include cold outbound emails, LinkedIn connection requests, follow-up sequences, and discovery calls. These are offline from a digital tracking perspective but still influence the journey and need to be logged in your CRM.
Nurture touchpoints include email drip sequences, webinar invitations, case study sends, and personalized follow-up content. These are mid-funnel interactions that often determine whether a prospect advances to evaluation or goes cold.
As you build this inventory, separate paid touchpoints from organic and direct ones. They require fundamentally different tracking approaches, and conflating them leads to attribution errors.
Critically, note where your data currently goes dark. If you have no visibility into what happens between a prospect clicking a LinkedIn ad and showing up in your CRM as an MQL three weeks later, that gap is your highest-priority tracking target. These blind spots are where attribution breaks down and where budget decisions go wrong.
Assign each touchpoint to at least one journey stage. Some touchpoints, like retargeting ads, may span multiple stages. That is fine. The goal is to ensure nothing is unassigned.
Success indicator: You have a complete channel inventory with every touchpoint mapped to at least one journey stage and the tracking gaps clearly identified.
Step 3: Instrument Your Tracking Layer for Every Stage
This is the step where your customer journey plan becomes a real measurement system. Everything before this was preparation. Now you are building the infrastructure that turns your journey map into data.
The first priority is setting up server-side conversion tracking. Browser-based pixel tracking has significant limitations in 2026. Ad blockers, privacy browsers, and cookie restrictions mean that a meaningful portion of conversion events never reach your ad platforms when you rely solely on client-side pixels. Server-side tracking, including Meta's Conversion API and Google's Enhanced Conversions, sends event data directly from your server to the ad platform, bypassing browser-level interference. This improves data completeness and gives your attribution model more accurate inputs to work with.
Next, configure conversion events for each critical stage transition in your journey. Do not track only the final conversion. Track every meaningful transition: form submission, MQL qualification, SQL handoff, demo booked, trial started, and closed-won. Each of these micro-conversions is a data point that tells you where your funnel is working and where it is breaking.
A common pitfall here is instrumenting only the bottom-of-funnel event and assuming that is sufficient. If you can only see closed deals but not the steps that led there, you cannot diagnose why your pipeline is thin or why certain channels generate leads that never convert.
Implement first-party data capture at each touchpoint. This means collecting identifiers like email addresses or user IDs at the earliest possible stage so you can stitch the journey together across sessions and devices. When a prospect clicks an ad, visits your blog, signs up for a webinar, and then books a demo two weeks later, first-party identifiers allow you to connect those interactions into a single journey rather than treating them as separate anonymous sessions.
Use UTM parameters consistently across all paid channels. Every ad, every campaign, and every piece of paid content should carry UTM source, medium, campaign, content, and term parameters. Without this consistency, campaign-level attribution data becomes unreliable the moment it enters your analytics platform.
Connect your CRM to your ad platforms to pass offline conversions back for optimization. When a prospect closes as a customer six weeks after clicking a LinkedIn ad, that conversion signal needs to find its way back to LinkedIn's algorithm. Without this feedback loop, your ad platforms are optimizing toward top-of-funnel events rather than the outcomes that actually matter to your business.
Success indicator: You can see event data firing for each stage transition in your analytics dashboard within 24 hours of completing your tracking setup, and those events are flowing into your ad platforms for optimization.
Step 4: Choose the Right Attribution Model for Your Sales Cycle
With your tracking layer in place, you now have the data to make attribution model selection meaningful. This step is about deciding how to distribute credit across the touchpoints in your customer journey plan, and understanding what each model tells you and what it hides.
Attribution model selection matters because different models tell fundamentally different stories about which channels deserve credit. The model you choose directly influences where you allocate budget, which campaigns you scale, and which channels you deprioritize. Choosing the wrong model for your sales cycle can lead to systematically misallocating spend.
First-touch attribution gives all credit to the first interaction a prospect had with your brand. This is useful for understanding which channels generate initial awareness and top-of-funnel volume. If you are trying to understand what is driving net-new pipeline, first-touch gives you a clear signal. Its weakness is that it ignores everything that happened after that first interaction.
Last-click attribution gives all credit to the final touchpoint before conversion. This is useful for identifying which channels close deals. The problem is that it systematically undervalues the channels that built awareness and nurtured the prospect through the consideration and evaluation stages.
Linear attribution distributes credit evenly across all touchpoints in the journey. This works reasonably well for longer B2B sales cycles with many interactions because it acknowledges that multiple channels contributed. It is not precise, but it is more balanced than single-touch models.
Time-decay attribution gives more credit to touchpoints that occurred closer to the conversion event. This reflects the intuition that recent interactions had more influence on the final decision, which is often true in shorter sales cycles.
Data-driven attribution uses actual conversion patterns in your data to assign credit algorithmically. This is the most accurate model when you have sufficient data volume, because it reflects what actually happened rather than applying a theoretical formula. The limitation is that it requires a meaningful volume of conversion events to produce reliable outputs.
For most B2B SaaS companies with sales cycles longer than 30 days, a multi-touch model will give a more complete picture than any single-touch model. The exact model you choose matters less than your willingness to compare models side by side. Running first-touch and last-click simultaneously and looking at where they disagree tells you a great deal about which channels are doing the heavy lifting at different stages of your funnel.
Success indicator: You can articulate why you chose your primary attribution model, what it is optimized to reveal, and what blind spots it may introduce.
Step 5: Connect Ad Spend Data to Pipeline and Revenue
This is the step that separates mature marketing organizations from teams that are still optimizing for vanity metrics. Connecting your ad spend directly to pipeline and revenue transforms your customer journey plan from a measurement framework into a budget decision engine.
Start by linking your ad platform data to your CRM pipeline stages. The goal is to see cost per MQL, cost per SQL, and cost per closed deal broken down by channel, campaign, and ad set. When you can see that a particular Google Search campaign is generating SQLs at a significantly lower cost than a broad awareness campaign on Meta, you have the information you need to reallocate budget with confidence.
Next, integrate your billing system with your attribution platform. If your company uses Stripe or a similar billing tool, connecting that data to your attribution layer allows you to see which specific campaigns and channels are generating actual revenue, not just pipeline. Pipeline is a leading indicator. Revenue is the outcome that matters. When you can trace a closed deal back to the specific ad that initiated the journey, you have true revenue attribution.
Build a revenue attribution view that shows pipeline value generated by campaign and channel, not just click volume or lead count. A campaign that generates 200 leads but closes none of them is performing worse than a campaign that generates 20 leads and closes five. Lead volume is a misleading metric when used in isolation.
Calculate your true customer acquisition cost by channel. Divide total ad spend attributed to a channel by the number of customers closed from that channel. This gives you a channel-level CAC that you can compare against your average contract value to determine which channels are actually profitable.
A common pitfall at this stage is continuing to optimize campaigns for lead volume when the real goal is pipeline quality. High lead volume from a low-quality channel wastes budget and creates downstream problems for your sales team, who spend time on prospects that were never going to convert.
Platforms like Cometly are built specifically to support this connection, linking ad spend data from Meta, Google, and other channels directly to CRM pipeline stages and billing data so you can see the full revenue picture in a single view.
Success indicator: You can pull a single report showing ad spend, pipeline generated, and closed revenue by channel without manually stitching together data from multiple platforms.
Step 6: Analyze Journey Drop-Off Points and Optimize Accordingly
You now have a fully instrumented customer journey plan with attribution data flowing from ad impressions through to closed revenue. The final operational step is to use that data to find where the journey breaks and systematically fix it.
Start by calculating conversion rates between each journey stage. What percentage of prospects who enter the awareness stage make it to consideration? What percentage of consideration-stage prospects book a demo? What percentage of demos convert to closed-won? These stage-to-stage conversion rates reveal the structural shape of your funnel and immediately surface where the biggest losses are occurring.
Identify the stage with the largest drop-off rate. That is your highest-priority optimization target. Spreading optimization effort evenly across all stages is inefficient. Concentrate on the biggest leak first, improve it, then move to the next.
Segment your drop-off analysis by channel and campaign. A high drop-off rate between consideration and evaluation might look like a content problem on the surface, but when you segment by channel, you might discover that prospects from one specific campaign are converting at twice the rate of prospects from another. That tells you the issue is traffic quality from a particular source, not your mid-funnel content.
Use AI-powered analysis to surface which ad creatives and campaigns are driving prospects that actually convert through the full funnel. The creative that generates the most clicks is rarely the creative that generates the most revenue. AI analysis can identify patterns across large datasets that would be extremely difficult to detect through manual review.
Test targeted interventions at your identified drop-off points. If prospects are dropping off between consideration and evaluation, test a retargeting sequence specifically designed for that stage. If they are stalling between evaluation and decision, test a nurture email that addresses common objections or provides a comparison asset. Design your interventions for the specific behavioral context of that stage, not as generic re-engagement campaigns.
Feed enriched conversion data back to Meta and Google. When you send high-quality, stage-specific conversion signals back to ad platform algorithms, those platforms can optimize their targeting toward users who are more likely to progress through your full funnel, not just click an ad. This feedback loop is one of the highest-leverage actions available to B2B SaaS marketing teams running paid campaigns.
Success indicator: You can identify at least one specific stage where a targeted intervention improved the stage-to-stage conversion rate, and you have a documented process for repeating that analysis on a regular cadence.
Putting Your Customer Journey Plan Into Practice
A customer journey plan that lives only in a slide deck has limited value. The version that drives real marketing decisions is the one backed by clean tracking data, accurate attribution, and a direct line from ad spend to closed revenue.
Treat this six-step process as a repeatable system, not a one-time project. Your journey plan becomes more valuable over time as data accumulates and patterns become clearer. The attribution insights you have after three months of clean data are far more actionable than what you see in week one.
Use this checklist to confirm your plan is fully operational:
Stages defined: Buyer stages documented with consistent language across marketing and sales, aligned with CRM pipeline.
Touchpoints mapped: Every channel and asset inventoried and assigned to at least one journey stage, with data gaps identified.
Tracking instrumented: Server-side conversion tracking active for each stage transition, UTM parameters consistent across all paid channels, and CRM connected to ad platforms for offline conversion import.
Attribution model selected: Primary model chosen with documented rationale and at least one secondary model running for comparison.
Revenue connected: Ad spend linked to pipeline stages and billing data, with a single-view report showing channel-level CAC and closed revenue.
Drop-off analysis completed: Stage-to-stage conversion rates calculated, highest drop-off point identified, and at least one optimization test underway.
Cometly is built to support every layer of this system. It captures touchpoints from first ad click to closed-won deal, connects your ad platforms to your CRM and billing data, and uses AI to surface which campaigns are actually driving revenue. If you are ready to move from guessing to knowing, get your free demo today and start building the tracking and attribution layer your customer journey plan requires.



