
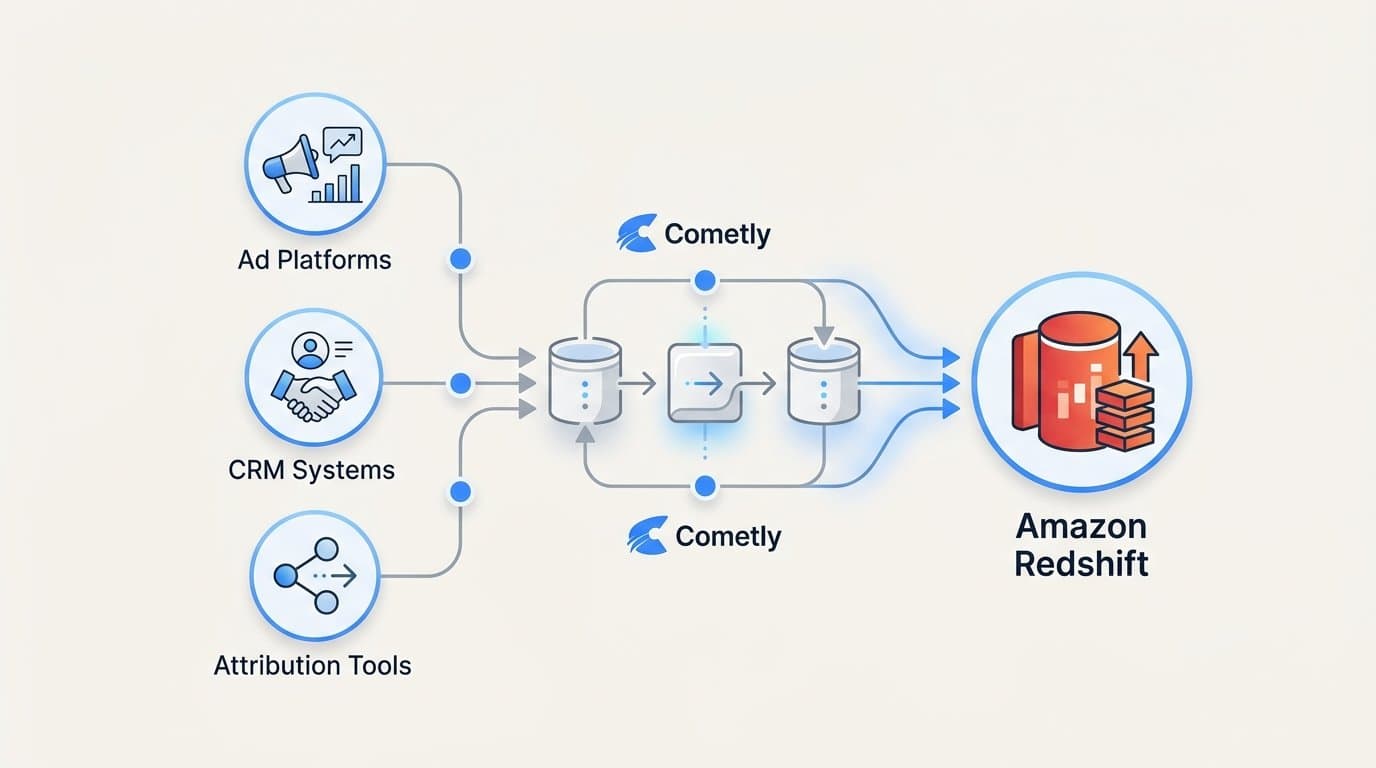
You sync conversion data to Redshift by connecting your conversion sources, whether ad platforms, CRM systems, or attribution tools, to Redshift using a data pipeline tool, ETL service, or native integration. The short answer is straightforward. The execution requires a bit more thought.
For B2B SaaS marketing teams, Cometly is a strong starting point because it centralizes multi-touch attribution data across your ad platforms and CRM, then lets you export enriched conversion events downstream to your data warehouse for deeper analysis. Instead of loading raw, disconnected ad platform exports into Redshift and trying to stitch them together yourself, you get attribution-ready data that already connects ad spend to pipeline and revenue.
This guide walks through the full process: from identifying your conversion sources to querying clean, attribution-ready data inside Redshift. Whether you are syncing Facebook ad conversions, Google Ads events, CRM pipeline data, or server-side tracking events, the steps below apply.
Here is why this matters for B2B SaaS teams specifically. Amazon Redshift is a columnar data warehouse optimized for analytical queries across large datasets. That makes it ideal for attribution analysis, where you need to join ad event data with CRM pipeline records, session-level touchpoints, and Stripe revenue. Once your conversion data lives in Redshift, you can run attribution queries at scale, connect to BI tools like Looker or Tableau, and build a full-funnel view from first ad click to closed-won deal.
The common failure mode is loading raw, pixel-based ad platform exports into Redshift without CRM data or revenue context. You end up with a table full of ad clicks and no way to connect them to the deals that actually closed. This guide is designed to help you avoid that outcome.
You will end up with a reliable, queryable dataset in Redshift that connects ad spend to actual revenue, without gaps from browser-based tracking limitations or missing pipeline context.
Step 1: Identify Your Conversion Data Sources
Before you configure a single connector, you need a clear map of every system generating conversion events. This sounds obvious, but most teams underestimate how many sources they actually have.
Start by listing every platform that records a conversion in your business. That typically includes ad platforms like Meta, Google Ads, and LinkedIn; your CRM such as HubSpot or Salesforce; your website for events like form submissions, trial signups, and demo bookings; any server-side tracking pipelines you have set up; and payment processors like Stripe if you track self-serve revenue.
Next, define what a conversion actually means in your context. For some B2B SaaS teams, a conversion is a marketing qualified lead. For others, it is a trial start, a demo booked, or a closed-won deal. You may have multiple conversion types, and each one may live in a different system. Clarifying this upfront determines which tables you need in Redshift and how you will join them later.
First-party server events: These are the most reliable because they are not affected by browser privacy restrictions or ad blockers. If you have a Conversion API integration with Meta or Google Enhanced Conversions set up, these events should be prioritized in your pipeline.
Pixel-based tracking: Browser pixels are increasingly unreliable due to Safari's Intelligent Tracking Prevention and widespread ad blocker usage. If pixel data is your only source, expect gaps. Plan to supplement with server-side events.
Platform-reported conversions: The numbers you see inside Meta Ads Manager or Google Ads are modeled and often include attribution overlap. These should be used for reference, not as the authoritative source in your Redshift schema.
CRM records: This is the source most teams forget to include, and it is the most important one for B2B attribution. Your CRM holds pipeline stage data, deal values, and closed-won records. Without it, your Redshift tables will show ad clicks but not the revenue outcomes that those clicks eventually produced.
Also note which sources have structured schemas versus raw event logs. Redshift performs best with consistent column structures. If a source outputs loosely structured JSON event logs, you will need a transformation step before loading. Identifying this early saves significant debugging time later.
Step 2: Choose Your Data Pipeline Method
Once you know your sources, you need to decide how data will move from those sources into Redshift. There are three main approaches, and the right one depends on your team's technical resources and what you want to do with the data.
Option A: Use an attribution platform like Cometly. Cometly already unifies ad platform data, CRM events, and server-side conversions into a single enriched dataset. The attribution logic and deduplication are handled before data reaches Redshift, which means the data you load is already clean, joined, and ready for analysis. For marketing teams without dedicated data engineers, this reduces complexity significantly. You are not pulling raw API data from five different sources and trying to reconcile them yourself. You are loading attribution-ready records that connect ad spend to pipeline and revenue out of the box.
 How do I sync conversion data to redshift?
Option B: Use a dedicated ETL or ELT tool. Tools like Fivetran, Airbyte, and Stitch offer pre-built connectors to hundreds of sources, including Google Ads, Meta Marketing API, HubSpot, Salesforce, and Stripe. You authenticate each connector, point it at Redshift, and the tool handles the data movement. This approach gives you raw source data, which means you will need a transformation layer, typically dbt, to apply attribution logic, join tables, and handle deduplication. This is the right choice for teams that already have a data stack and want full control over their transformation layer.
Option C: Build a custom pipeline. AWS Glue, Lambda, and Kinesis Firehose are powerful options if your team has engineering resources and needs highly custom transformations or real-time event streaming. This approach offers maximum flexibility but also the highest maintenance burden. Most marketing analytics use cases do not require it.
The decision factor that matters most: if your goal is marketing attribution analysis, meaning you want to understand which channels and campaigns drive revenue, start with an attribution layer first. Raw ad platform exports from Google Ads or Meta lack CRM context and revenue data. Loading them directly into Redshift gives you ad performance metrics, not attribution. Cometly solves this by enriching conversion events with multi-touch attribution data before they reach your warehouse, so your Redshift queries can answer revenue questions from day one.
If your team already has a mature data stack and wants raw event logs for maximum flexibility, Option B with Fivetran or Airbyte is a solid choice, paired with dbt for transformations.
Step 3: Set Up Your Redshift Destination and Schema
Your schema design determines how useful your data will be once it is in Redshift. Getting this right before data arrives is far easier than restructuring tables after thousands of records have loaded.
Start by creating a dedicated Redshift cluster or serverless workspace for marketing analytics if one does not already exist. Keeping marketing data isolated from product or operational data makes access control and query performance easier to manage.
Define two schemas: a staging schema and an analytics schema. The staging schema is where raw data lands first. The analytics schema is where your cleaned, transformed, and joined tables live. This separation makes debugging straightforward. If a sync breaks or a mapping is wrong, you can inspect the staging tables, fix the transformation, and reprocess without touching your analytics tables.
For your core analytics schema, you need at minimum four tables:
1. Conversion events table: This is the central fact table. Recommended columns include event_id, event_type, event_timestamp, user_id or email, session_id, channel, campaign_id, ad_id, conversion_value, and attribution_model. Every conversion event from every source should map to a row here.
2. Touchpoints table: Records every ad interaction in the customer journey, not just conversions. You will join this to the conversions table to calculate multi-touch attribution.
3. Campaign metadata table: Stores campaign names, ad group names, ad creative IDs, and associated spend. This gives you the context to calculate cost per conversion and ROAS.
4. Revenue outcomes table: CRM deal records and Stripe payment events. This is what connects ad activity to actual closed revenue.
On distribution and sort keys: use distribution keys on high-cardinality columns like user_id or campaign_id to optimize join performance. Set sort keys on event_timestamp because most attribution queries filter by date range. These settings have a significant impact on query speed when your tables grow to millions of rows.
A common pitfall is loading all data into a single flat table. It seems simpler upfront, but it makes multi-touch attribution calculations difficult and causes slow queries as data volume grows. The normalized structure described above is worth the extra setup time.
Step 4: Configure the Connection and Map Your Fields
With your schema defined, you can now configure the actual data connection. The steps vary slightly depending on which pipeline method you chose.
If you are using Cometly, navigate to the integrations or data export section within the platform, select Redshift as your destination, and provide your Redshift host, port, database name, target schema, and credentials. Cometly will map its enriched conversion event fields to your Redshift schema. Because the data is already structured and attribution-enriched, the mapping step is straightforward compared to working with raw API outputs.
If you are using Fivetran or Airbyte, create a new connector for each source. For Meta Ads, authenticate via the Meta Marketing API. For Google Ads, use OAuth. For HubSpot or Salesforce, use API keys or OAuth depending on the connector. Then set Redshift as the destination for each connector with the same credential inputs. Each connector will create its own set of tables in your staging schema, which you will then transform using dbt or custom SQL.
Field mapping is where most teams lose time. Source systems use inconsistent naming conventions. Meta calls the conversion type action_type. HubSpot calls a deal stage hs_deal_stage_probability. Your Redshift schema needs consistent column names across all sources. Map each source field to your target schema column explicitly, and document the mapping. For example, map Meta's action_type to your event_type column, and map campaign_name to a campaign lookup table where you join on campaign_id.
Set your sync frequency based on how you use the data. For near-real-time marketing decisions during active campaign flights, hourly syncs are appropriate. For daily reporting and attribution analysis, a nightly batch is sufficient and reduces compute costs.
Enable deduplication logic at this stage. This is critical. When pulling conversion data from multiple sources, the same conversion event can appear in your pixel data, your server-side event stream, and your CRM simultaneously. Redshift does not enforce unique constraints by default, so you need to handle deduplication either through your pipeline tool's built-in dedup logic or by adding a unique constraint on event_id and using INSERT INTO ... ON CONFLICT DO NOTHING patterns in your load queries.
Finally, verify that all timestamps are normalized to UTC before loading. Attribution windows are date-range dependent, and timezone discrepancies will cause subtle but significant errors in your attribution calculations.
Step 5: Validate Data Accuracy Before Building Reports
Do not build dashboards on unvalidated data. This step protects you from making budget decisions based on incorrect numbers.
Start with a row count comparison. For the same date range, compare the number of conversion records in your source system against the number of rows in your Redshift conversions table. If the counts do not match, something was dropped or duplicated during the sync. Investigate before proceeding.
Cross-check conversion totals against three reference points: what your ad platforms report natively in their dashboards, what your CRM shows for the same period, and what your attribution platform reports if you are using one. You should not expect perfect alignment across all three because each system counts conversions differently. What you are looking for is reasonable consistency and the ability to explain any gaps.
Check for null values in critical columns. Run a query against your conversions table that counts nulls in campaign_id, event_type, and conversion_value. Nulls in these columns indicate mapping gaps that will break downstream attribution queries. A conversion with no campaign_id cannot be attributed to a channel. Fix the mapping at the source before loading more data.
Test a simple attribution query: count conversions grouped by channel and compare the output against your attribution platform's dashboard. If you are using Cometly as your attribution layer, compare the enriched conversion events in Redshift against Cometly's own reporting interface to confirm the export is complete and the numbers align.
The success indicator is straightforward: conversion counts in Redshift are within a small, explainable margin of your source systems, timestamp distributions look correct across the date range, and no critical columns have unexpected nulls. When those three conditions are true, your data is ready for analysis.
Step 6: Build Attribution Queries and Connect to BI Tools
With clean, validated data in Redshift, you can now build the attribution analysis that the entire pipeline was designed to enable.
Start with a simple last-touch attribution query. Join your conversions table to your touchpoints table on user_id or session_id, filter to the last touchpoint before each conversion event, group by channel, and sum conversion_value. This gives you a baseline revenue-by-channel view that you can validate against your ad platform dashboards.
For multi-touch attribution, Redshift's window functions are your primary tool. Use ROW_NUMBER() or RANK() partitioned by user_id and ordered by event_timestamp to identify touchpoint position within a conversion path. Then assign fractional credit across touchpoints using a linear model (equal credit to each touch) or a position-based model (more credit to first and last touch). Define your attribution window, typically 7, 14, or 30 days depending on your sales cycle length, as a filter on the time between touchpoint and conversion.
B2B SaaS companies with longer sales cycles often need 30-day or longer attribution windows to correctly credit early-funnel touchpoints like a LinkedIn ad that drove the first brand awareness visit three weeks before a demo booking. Redshift handles these window calculations efficiently when your sort keys and distribution keys are set correctly.
Once your core attribution queries are working, connect Redshift to a BI tool. Redshift connects natively to Tableau, Looker, Metabase, AWS QuickSight, and Power BI. For most marketing teams, Metabase or Looker provide the right balance of flexibility and ease of use for non-technical stakeholders. Marketing leaders can explore attribution data in a dashboard without writing SQL.
Create materialized views or scheduled query refreshes to keep your attribution dashboards current. A materialized view that refreshes nightly means your team always has up-to-date attribution data without manually re-running queries.
The long-term value of this setup is significant. With conversion data in Redshift, you can blend ad spend data with CRM pipeline stages and Stripe revenue records to build a full-funnel view from first ad click to closed-won deal. You can answer questions like which campaigns generate the highest pipeline value, which channels have the shortest time to close, and where in the funnel specific ad creatives lose influence. That level of analysis is not possible inside any single ad platform dashboard.
Putting It All Together
Syncing conversion data to Redshift gives marketing teams a durable, queryable record of every conversion event connected to the campaigns and channels that drove it. The process works best when you start with a clean attribution layer that enriches and deduplicates data before it reaches your warehouse, rather than loading raw ad platform exports that lack CRM and revenue context.
Before you go live, run through this checklist:
1. Conversion sources identified and documented, including ad platforms, CRM, server-side events, and payment data.
2. Pipeline method chosen and configured, whether that is Cometly, Fivetran, Airbyte, or a custom build.
3. Redshift schema defined with correct distribution keys, sort keys, and a staging schema separate from your analytics schema.
4. Field mappings validated and deduplication logic enabled at the pipeline level.
5. Row counts verified against source systems for the same date range.
6. At least one attribution query tested end to end and compared against a reference dashboard.
Once your pipeline is running, you can extend it by adding Stripe revenue data, CRM stage updates, and server-side event streams to build the most complete attribution dataset your team has ever had.
If you want to skip the manual pipeline work and get attribution-ready conversion data flowing faster, explore Cometly's platform to see how it connects your ad platforms, CRM, and website into a single source of truth. Get your free demo today and start capturing every touchpoint to maximize your conversions.