

Most B2B SaaS companies invest heavily in paid ads, content, and outbound sales without ever stopping to map out what their customer actually experiences from first touch to closed deal. That gap between assumption and reality is where pipeline leaks, budget gets wasted, and conversion rates stall.
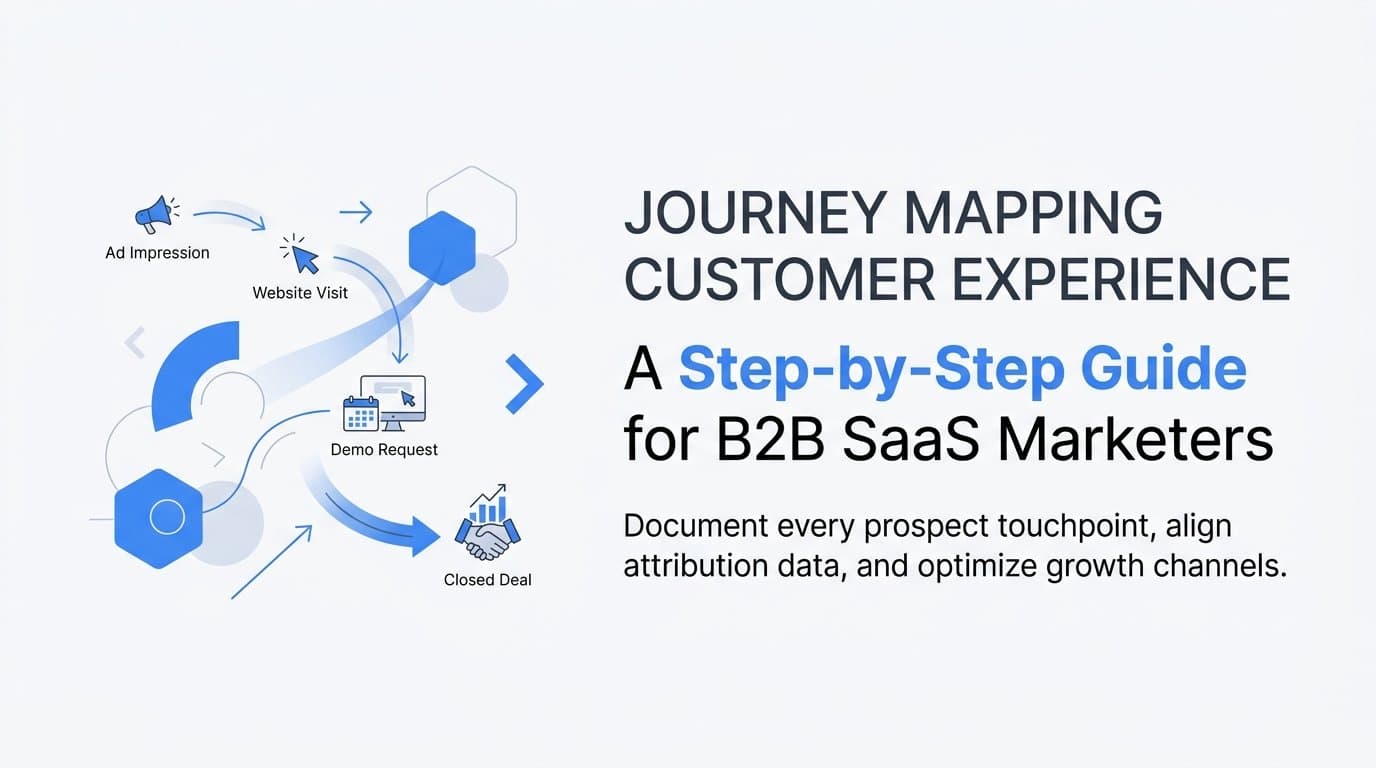
Journey mapping customer experience is the process of documenting every interaction a prospect has with your brand, from the first ad impression to the moment they become a paying customer. For B2B SaaS marketers, this is not just a UX exercise. It is a revenue intelligence tool.
When you understand the real path your customers take, you can align your marketing channels, messaging, and attribution data to reflect what is actually happening. You stop optimizing for vanity metrics and start optimizing for the touchpoints that drive pipeline and revenue.
This guide walks you through a practical, data-driven approach to building a customer journey map that your marketing and growth teams can act on. You will learn how to define your buyer personas, identify every touchpoint across your funnel, collect and analyze behavioral data, and use attribution insights to validate your map with real conversion evidence.
By the end, you will have a structured journey map that connects your ad spend to revenue outcomes, helps you identify where prospects drop off, and gives your team a single source of truth for making smarter campaign decisions. Let's get into it.
Step 1: Define Your Ideal Customer Profile and Buyer Personas
Before you can map a journey, you need to know who is taking it. This sounds obvious, but most B2B SaaS teams skip this step or rely on personas built from gut instinct rather than real data. The result is a journey map that reflects what the team thinks customers experience rather than what they actually do.
Start by identifying the specific roles and company profiles that represent your best customers. In B2B SaaS, this typically means looking at job titles like marketing director, growth lead, or revenue operations manager at mid-market software companies. But do not assume. Pull this data directly from your CRM.
Look at your closed-won deals over the past twelve to eighteen months and identify patterns across these dimensions:
Company size and industry: Which verticals and employee counts appear most frequently in your best accounts? Are there patterns in the types of software companies that convert fastest or at the highest contract values?
Job title and seniority: Who is the primary champion in the buying process? Who signs the contract? These are often different people, and both matter for your journey map.
Sales cycle length: How long does it typically take from first touch to closed deal? This will shape how many touchpoints you need to account for and how complex your nurture sequences need to be.
Awareness triggers: What event or problem typically causes a prospect to start searching for a solution like yours? This might be a new budget cycle, a failed campaign, a leadership change, or a shift in their reporting requirements.
Aim to create two to three distinct personas based on this data. For each persona, document their primary goals, their pain points around marketing measurement, and the specific questions they ask before committing to a purchase. Sales call recordings and post-sale customer interviews are excellent sources for this qualitative layer.
Common pitfall: Building personas from assumptions rather than data. Even experienced marketers can fall into the trap of describing an idealized buyer rather than the actual buyers who have converted. Ground every persona in real CRM data and direct customer input.
Success indicator: You have two to three documented personas with specific job titles, company characteristics, primary challenges, and awareness triggers, all backed by real customer data rather than internal assumptions.
Step 2: Identify Every Touchpoint Across the Buying Journey
Now that you know who your buyers are, you need to document every moment where they can interact with your brand. This is where most journey mapping exercises get incomplete. Teams focus on the touchpoints they own and control, and miss the ones that happen outside their direct line of sight.
Start by listing all the channels and interaction types where a prospect can encounter your brand. This includes paid ads on Google and Meta, organic search results, email sequences, sales outreach, demo requests, product trials, and onboarding flows. But it also includes touchpoints you may not be actively managing.
Organize every touchpoint into four journey stages:
1. Awareness: The prospect's first exposure to your brand. This could be a paid search ad, a LinkedIn post, a mention in an industry newsletter, or a referral from a colleague.
2. Consideration: The prospect is actively evaluating your solution against alternatives. They are reading your blog, watching product demos, checking your G2 or Capterra reviews, and comparing pricing pages.
3. Decision: The prospect is moving toward a purchase. They have had a sales conversation, received a proposal, and are working through internal approval or procurement processes.
4. Retention: Post-sale engagement. Onboarding, customer success check-ins, product usage, and expansion conversations all belong here.
For each touchpoint, document three things: the channel it occurs on, the type of content or interaction involved, and the intended next action you want the prospect to take after that interaction.
Do not overlook indirect touchpoints. Word-of-mouth referrals, LinkedIn organic content from your team, and third-party review sites are all part of the consideration-stage journey for many B2B buyers. These touchpoints often carry significant influence even though they are harder to track directly.
Common pitfall: Undercounting touchpoints in the consideration stage. B2B buyers rarely move from awareness to demo request in a single interaction. They typically consume multiple pieces of content across several channels over days or weeks before taking that next step. Document this middle-of-funnel activity carefully, even if your current tracking does not capture all of it yet.
Success indicator: You have a complete list of touchpoints organized by journey stage, with each touchpoint mapped to a specific channel and an intended prospect action.
Step 3: Collect Behavioral and Attribution Data for Each Touchpoint
A journey map without data is just a theory. This step is where you attach real evidence to the touchpoints you identified in Step 2, and it is where the revenue intelligence value of journey mapping becomes concrete.
Start by pulling conversion and engagement data from your ad platforms, website analytics, and CRM. You are looking for quantitative signals about how prospects actually move through your funnel, not how you assume they move.
Here is what to collect for each touchpoint:
Engagement volume: How many prospects are interacting with this touchpoint? This gives you a sense of reach and exposure at each stage.
Conversion rate to the next stage: Of the prospects who engage with this touchpoint, what percentage advance to the next stage? This is your primary signal for identifying friction.
Contribution to pipeline and revenue: Is this touchpoint appearing in the journeys of prospects who eventually become paying customers? This is where multi-touch attribution data becomes essential.
Single-touch attribution models, particularly last-click, will distort your journey map. They assign all credit to the final touchpoint before conversion, which makes awareness and consideration channels look less valuable than they actually are. For journey mapping purposes, multi-touch attribution gives you a far more accurate picture of which channels are contributing at each stage of the funnel.
Look specifically at your closed-won data and ask: which combination of touchpoints appears most frequently in the journeys of customers who converted quickly and at high contract values? These patterns are your highest-value insights. They tell you which channel sequences to prioritize and replicate.
Also identify the touchpoints with the highest drop-off rates by comparing the volume of prospects entering each stage against the volume advancing to the next. A large gap between these numbers signals a friction point worth investigating.
One area that many B2B SaaS marketing teams overlook is the gap between demo request and closed deal. This is often where the most valuable journey data lives, yet attribution tracking frequently stops the moment a lead is handed to sales. Closing this gap requires connecting your marketing attribution data to your CRM so you can see the full journey from first ad click to closed-won revenue.
Common pitfall: Relying on last-click attribution to inform your journey map. This approach systematically undervalues the awareness and consideration channels that built intent before the final conversion event, leading to budget decisions that cut the very channels driving your pipeline.
Success indicator: You have quantitative data attached to each touchpoint showing engagement volume, conversion rate to the next stage, and contribution to pipeline or revenue.
Step 4: Visualize the Journey Map and Identify Friction Points
You now have the raw material for your journey map: defined personas, documented touchpoints, and real attribution data. This step is about organizing that material into a format your entire marketing and growth team can read and act on.
Build your visual map using a simple grid structure. Place your buyer personas along one axis and the four journey stages across the top. Each cell in the grid represents a specific touchpoint for a specific persona at a specific stage. Within each cell, document three things: what the prospect is doing at that moment, what they are thinking or feeling, and what your data shows about performance at that stage.
This format keeps the map grounded in both human context and quantitative evidence, which is what makes it useful for decision-making rather than just documentation.
Once the grid is populated, your next task is to highlight friction points. These are the cells where the data shows significant drop-off between stages, longer-than-expected delays in progression, or low engagement relative to the volume of prospects entering that touchpoint. Mark these clearly so they stand out visually.
Use color coding to distinguish performance levels across the map. A simple three-color system works well: green for high-performing touchpoints, yellow for touchpoints that need attention, and red for clear friction points requiring immediate action. This lets any team member scan the map and immediately understand where to focus.
Add qualitative context to your quantitative findings. If your data shows a high drop-off rate between the consideration stage and demo request, annotate that cell with insights from sales call recordings or customer interviews. What objections do prospects raise at this stage? What questions are they asking that your content is not answering? This qualitative layer explains the why behind the numbers.
Common pitfall: Building a journey map that looks thorough but lacks data validation. A visually complete map that is based on assumptions rather than behavioral and attribution data will lead your team to optimize the wrong things. Every friction point you identify should be supported by actual data, not guesswork.
Success indicator: You have a visual journey map that any member of your marketing or growth team can read and immediately understand where prospects are succeeding and where they are getting stuck, with data supporting every friction point identified.
Step 5: Align Your Marketing Channels and Messaging to the Journey
A journey map is only as valuable as the decisions it drives. This step is where you translate the insights from your map into specific changes to your channel strategy, ad creative, messaging, and attribution setup.
Start with the friction points you identified in Step 4. For each one, define a specific action that addresses the drop-off. This might mean creating a new retargeting campaign for prospects who visited your pricing page but did not convert, rewriting a landing page to better address the questions your consideration-stage personas are asking, or restructuring your email nurture sequence to deliver the right content at the right moment.
Next, audit your current ad campaigns against the journey stages they are meant to serve. Ask these questions:
Awareness campaigns: Are they reaching the right personas based on your ICP data? Are the targeting parameters aligned with the company sizes, industries, and job titles that appear in your closed-won deals?
Consideration campaigns: Are they delivering content that matches the specific questions and concerns your personas have at this stage? Consideration-stage messaging should help prospects evaluate your solution, not just introduce your brand.
Decision campaigns: Are they building trust and addressing ROI concerns? At this stage, prospects know what you do. They need confidence that you can deliver results for their specific situation.
This is also the right moment to revisit your attribution model. If your journey map shows that prospects typically engage with six or more touchpoints across several weeks before converting, a last-click model is giving you a distorted view of what is actually driving revenue. A linear or time-decay attribution model may better reflect the reality of your buyer's journey and lead to more accurate budget allocation decisions.
Platforms like Cometly's AI ads manager can help you identify which campaigns and channels are genuinely contributing to pipeline at each stage, so you can scale what is working and reallocate budget away from what is not. When your attribution data reflects the full journey rather than just the final click, your optimization decisions become far more reliable.
Common pitfall: Focusing all optimization effort on bottom-of-funnel touchpoints because they are closest to revenue. Often the highest leverage is in the awareness and consideration stages, where improving the quality and relevance of your content can dramatically increase the number of high-fit prospects entering your funnel.
Success indicator: Each friction point in your journey map has a corresponding action item with a clear owner, a timeline for implementation, and a measurable success metric you will use to evaluate whether the change worked.
Step 6: Validate the Map with Real Conversion Data and Iterate
The journey map you have built is a hypothesis based on the best data available to you right now. This final step is about testing that hypothesis, measuring results, and building a process for keeping the map accurate over time.
After implementing the changes you defined in Step 5, track conversion rates at each stage over a defined measurement period. Compare these rates to your pre-implementation baseline and look for movement at the specific friction points you addressed. If the changes you made are working, you should see improvement in the conversion rates at those stages.
Cohort analysis is particularly useful here. Compare the journeys of prospects who converted after your changes to those who converted before. Look for differences in the touchpoints they engaged with, the time they spent in each stage, and the channel combinations that appeared most frequently in their paths to conversion. These differences tell you whether your journey map changes are having the intended effect.
Revisit and update your journey map on a regular cadence. At minimum, a quarterly review is appropriate for most B2B SaaS companies. Customer behavior shifts, competitive dynamics change, and your own channel mix evolves. A journey map that was accurate six months ago may not reflect the current reality of how your buyers are finding and evaluating you.
Bring your sales team into the validation process. Share the updated map with them and ask whether the stages and friction points you have identified match what they are hearing in conversations with prospects. Sales teams often have qualitative insights that do not show up in your attribution data, and their feedback can help you refine the map in ways that pure analytics cannot.
Finally, close the loop by feeding validated conversion event data back into your ad platforms. This is one of the most impactful things you can do with a well-built journey map. When your ad platforms receive enriched, accurate conversion signals through server-side tracking and Conversion API integrations, their machine learning can better identify and reach prospects who match the high-value journey patterns you have documented. Cometly's server-side conversion tracking is built specifically for this purpose, ensuring that the conversion data flowing back to Meta, Google, and other platforms reflects the real downstream outcomes of your campaigns, not just surface-level click events.
Common pitfall: Treating the journey map as a one-time deliverable. The teams that get the most value from journey mapping are the ones who treat it as a living document with a scheduled review process, not a project that gets completed and filed away.
Success indicator: Your journey map has been updated at least once based on real post-implementation data, and your team has a scheduled review cadence to keep it current as your marketing strategy and customer behavior evolve.
Putting It All Together
Building a journey map for your customer experience is one of the highest-leverage activities a B2B SaaS marketing team can undertake. It turns scattered channel data into a coherent story about how your buyers actually move from problem-aware to paying customer.
The six steps in this guide give you a repeatable framework. Start with real persona data from your CRM. Document every touchpoint across all four journey stages. Attach attribution evidence to each stage so your map is grounded in behavioral reality. Visualize friction points clearly so your team knows where to focus. Align your campaigns and messaging to the journey you have actually mapped. Then iterate based on what the conversion data shows after you make changes.
The teams that get the most value from journey mapping are the ones who connect it directly to their attribution and conversion tracking infrastructure. When you can see which specific touchpoints and channel combinations are driving pipeline and revenue, your journey map stops being a diagram and starts being a decision-making tool.
Cometly helps B2B SaaS marketers do exactly this by connecting ad platform data, CRM events, and website behavior into a single view of the customer journey. From first ad click to closed-won revenue, every touchpoint is tracked and attributed so your journey map is always grounded in real data rather than assumptions.
If you are ready to build a journey map backed by accurate attribution data, Get your free demo today and start capturing every touchpoint to maximize your conversions.



