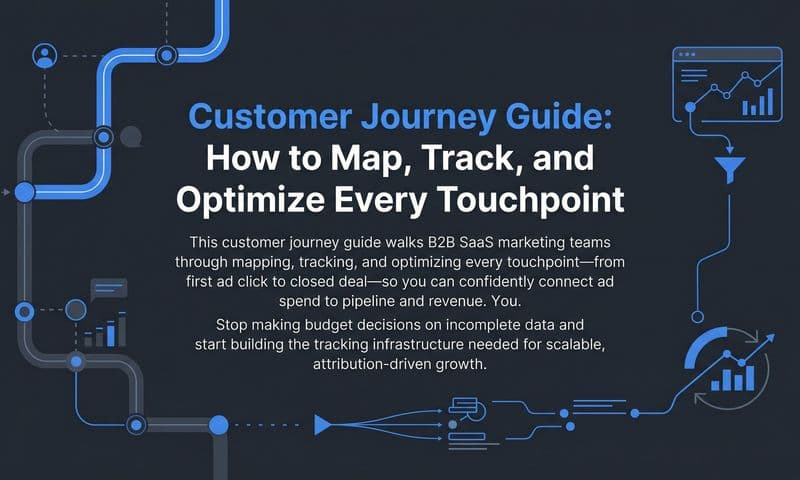
Most B2B SaaS marketing teams are working with incomplete data. They can see which ads generated clicks. They can see which deals closed in the CRM. But the space in between, the touchpoints, channel interactions, and conversion events that connect those two moments, is often invisible. That gap is where budget gets wasted and growth stalls.
Tracking the entire customer journey means connecting every interaction a prospect has with your brand, from the first ad impression to the moment they become a paying customer, into a single, coherent data trail. When you can see that trail clearly, you stop guessing about which channels drive pipeline and start making decisions backed by real revenue data.
B2B SaaS buying journeys are complex by nature. They involve multiple decision-makers, extended evaluation periods, and many touchpoints across different channels before a deal closes. A prospect might click a LinkedIn ad, read three blog posts, attend a webinar, and then convert through organic search six weeks later. Last-click attribution would give all the credit to organic search. The reality is far more nuanced.
This guide walks B2B SaaS marketing teams through a practical, step-by-step process to set up full customer journey tracking. You will learn how to define your key touchpoints, implement the right tracking infrastructure, connect your ad platforms and CRM, choose the attribution model that fits your business, and use the data to make smarter budget decisions.
Whether you are starting from scratch or trying to fix a broken attribution setup, these steps will give you a clear path forward. By the end, you will have a tracking system that captures every meaningful interaction, attributes revenue to the right sources, and feeds your ad platforms with the enriched conversion data they need to optimize more effectively.
Step 1: Map Every Touchpoint Across Your Funnel
Before you touch a single tracking tool, you need a written map of your customer journey. This is your blueprint. Every tracking decision you make later will be built on top of it, so getting this right at the start saves significant time and prevents costly gaps.
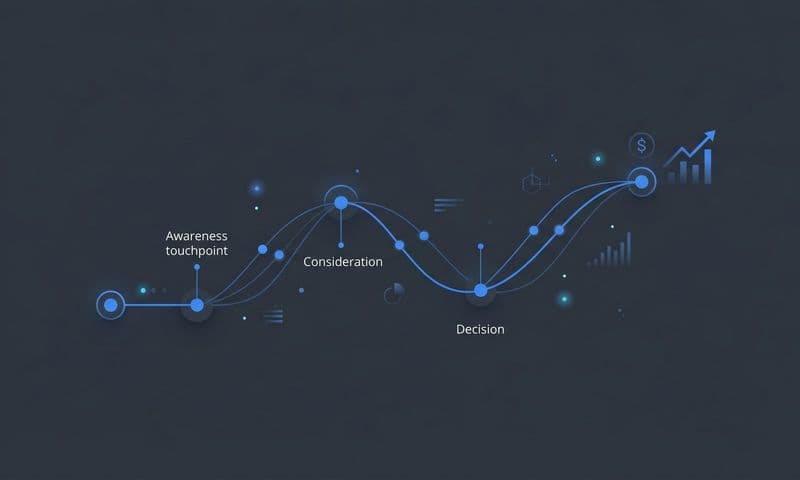
Start by defining the stages of your specific customer journey. For most B2B SaaS companies, this breaks down into four broad phases: awareness, consideration, evaluation, and conversion. Within each phase, list every channel and interaction type where prospects engage with your brand.
Awareness touchpoints typically include paid social ads, paid search, organic search, content marketing, and display or retargeting campaigns. These are the moments when a prospect first encounters your brand or a problem you solve.
Consideration touchpoints include blog visits, case study downloads, email nurture sequences, webinar registrations, and direct traffic from prospects who are actively researching solutions. This is where your content and positioning do their work.
Evaluation touchpoints are where intent signals get stronger. Demo requests, free trial signups, pricing page visits, and comparison page views all indicate a prospect is getting close to a decision. These are high-value events worth tracking precisely.
Conversion touchpoints include the closed-won event in your CRM, the first payment in your billing system, and any onboarding milestones that confirm a prospect has become a customer.
A common pitfall at this stage is skipping offline or CRM-based touchpoints. Sales calls, follow-up emails from your SDR team, and pipeline stage progressions are all part of the journey. If you ignore them now, you will have attribution gaps that are difficult to fix later.
Once you have listed every touchpoint, organize them by funnel stage and note the specific conversion event that signals progression from one stage to the next. For example, a form submission signals the move from consideration to evaluation. A closed-won deal signals the end of the conversion stage. Understanding what customer journey touchpoints are and how they connect is essential before configuring any tracking tool.
Your success indicator for this step: you have a written document that lists every touchpoint from first ad click to closed revenue, organized by funnel stage. This document becomes the foundation for every configuration decision in the steps that follow.
Step 2: Set Up First-Party Data Collection and Pixel Tracking
With your touchpoint map in hand, it is time to implement the tracking infrastructure that will capture data at each of those points. This step covers two parallel tracks: pixel-based tracking on your website and first-party data collection at the moment of conversion.
Start by installing tracking pixels for each ad platform you run. If you are running Meta ads, install the Meta Pixel on your website and all key landing pages. If you are running Google Ads, install the Google Ads conversion tag. Make sure these tags are present on every page that represents a meaningful touchpoint, not just your homepage. Understanding what a tracking pixel is and how it works will help you configure these tags correctly from the start.
Next, set up UTM parameter tracking across all your paid campaigns. Every ad link should carry UTM parameters that identify the source, medium, campaign, and ad creative. When a prospect clicks an ad and lands on your site, those parameters should be captured and stored against their session. If you are new to this, a thorough guide on UTM tracking and how it helps your marketing is worth reviewing before implementation.
The critical step that many teams miss is connecting UTM data to form submissions. When a prospect fills out a demo request form or signs up for a trial, your form should capture the UTM parameters from their session and pass them into your CRM as part of the lead record. This is what preserves source attribution through a long B2B sales cycle. Without it, you lose the connection between the ad that drove the lead and the deal that eventually closes.
Server-side tracking deserves serious attention here. Browser-based pixels are increasingly limited by ad blockers, iOS privacy changes, and browser restrictions that prevent cookies from being set or read. A significant portion of conversion events can go untracked if you rely solely on browser-side pixels. Server-side tracking sends conversion data directly from your server to the ad platform, bypassing these restrictions entirely.
After implementation, verify that your pixels are firing correctly on all key pages. Use the Meta Pixel Helper browser extension and Google Tag Assistant to confirm that events are being received. Check your ad platform event dashboards to make sure conversion events are showing up with accurate data attached.
A common pitfall at this stage is assuming that because a pixel is installed, it is working correctly. Pixels can fire without sending meaningful data if event parameters are misconfigured. Verify not just that the pixel fires, but that it fires with the right event name, the right parameters, and on the right pages.
Your success indicator: your ad platforms are receiving conversion events with accurate source data attached to each event, and your CRM records include UTM attribution for leads generated through paid campaigns.
Step 3: Connect Your CRM and Ad Platforms Into One Data Layer
Pixel tracking captures what happens on your website. Your CRM captures what happens in your sales pipeline. The gap between those two systems is where most B2B attribution breaks down. This step is about closing that gap by creating a unified data layer that connects ad platform data, website behavior, CRM pipeline stages, and revenue data into one coherent system.
Start by integrating your CRM with your attribution platform. The goal is to ensure that every lead record carries its original source attribution, including UTM parameters and ad identifiers, through the entire pipeline. When a lead progresses from MQL to SQL to opportunity to closed-won, that source data should travel with it at every stage. Reviewing how customer attribution tracking works end-to-end will help you configure these integrations correctly.
Map your CRM stages to funnel events. This means defining exactly which CRM stage changes represent meaningful marketing events. An MQL creation, an opportunity opened, and a closed-won deal are all events that should be trackable and attributable to a marketing source. Configure your CRM to log these stage changes in a way that your attribution platform can read and report on.
Connect your ad platforms through native integrations or a Conversion API setup so that offline conversions and CRM events are sent back to the platforms. When a lead created from a Meta ad converts to a closed-won deal three months later, that event should be sent back to Meta as an offline conversion. Learning how to track offline conversions accurately is a critical part of this configuration. This tells the platform that the lead it generated actually turned into revenue, which improves its ability to find similar high-value prospects.
Revenue data integration is the final and often overlooked piece. Connect your billing system, whether that is Stripe or another payment processor, so that actual deal value is tied to the marketing source that generated the lead. This moves your reporting from lead volume and cost per lead to actual revenue attribution, the metric that matters most to your business.
A common pitfall at this stage is treating your CRM and ad platforms as separate systems. When they operate in silos, you can report on clicks and leads in your ad platform and on pipeline in your CRM, but you cannot connect the two. ROI calculation becomes impossible, and budget decisions default to gut instinct rather than data.
Your success indicator: a lead created from a paid ad carries its source attribution all the way through to closed-won revenue in your reporting. You can pull a report that shows which campaigns generated which deals and what revenue value those deals represent.
Step 4: Implement Conversion API for Accurate Signal Passing
You have pixels installed and first-party data flowing into your CRM. Now it is time to strengthen the signal quality being sent back to your ad platforms. This is where Conversion API implementation becomes essential for any B2B SaaS team running paid campaigns at scale.
Meta Conversion API and Google Enhanced Conversions are server-side solutions that send conversion events directly from your server to the ad platform, rather than relying on a browser-based pixel to do so. The practical benefit is significant: events that would have been missed due to ad blockers, browser restrictions, or iOS privacy settings are now captured and reported accurately. Understanding why server-side tracking is more accurate than browser-based methods gives important context for why this step matters.
To implement Meta Conversion API, you will need to configure your server or attribution platform to send events to the Meta Events API endpoint. Each event should include the event name, a timestamp, the URL where the action occurred, and customer data parameters such as hashed email addresses or phone numbers when available. These customer data parameters are used to match the event back to a Meta user, which is what drives match quality scores.
For Google Enhanced Conversions, the setup involves passing hashed first-party customer data alongside your standard conversion tags. Google uses this data to match conversions back to Google accounts, improving measurement accuracy for campaigns where browser-based tracking has gaps.
Event deduplication is a required configuration step when running both browser-side pixels and server-side events simultaneously. Without deduplication, the same conversion event can be counted twice: once by the pixel and once by the Conversion API. This inflates your reported conversion numbers and distorts the optimization signals your ad platform uses to make bidding and targeting decisions. Configure a unique event ID for each conversion event and pass it through both the pixel and the API so the platform knows to count them as a single event.
Enriching your server-side events with customer data improves match rates substantially. When you send a hashed email address alongside a conversion event, the platform can match that event to a known user with much higher confidence than it can from a browser cookie alone. Higher match rates mean more of your conversions are attributed correctly and the platform's machine learning has better data to work with. Following best practices for tracking conversions accurately ensures your event data is clean and reliable from the start.
A common pitfall is sending duplicate events without deduplication logic in place. This is one of the most common Conversion API configuration errors and one of the most damaging because it makes your conversion data unreliable.
Your success indicator: your Conversion API event match quality scores are high and your ad platforms are receiving more conversion events than pixel alone was capturing. You should see an increase in reported conversions after implementation, which reflects previously untracked events now being captured.
Step 5: Choose and Configure Your Attribution Model
With your tracking infrastructure in place and data flowing through your system, you now need to decide how credit for conversions gets distributed across the touchpoints in each customer journey. That is what attribution modeling does, and the model you choose has a direct impact on which channels appear valuable and which appear to underperform.
The five most common attribution models each take a different approach to distributing credit:
First-touch attribution gives 100% of the credit to the first interaction a prospect had with your brand. It is useful for understanding which channels create initial awareness but ignores everything that happened afterward.
Last-click attribution gives 100% of the credit to the final touchpoint before conversion. It is the default in many platforms and is easy to set up, but it systematically undervalues top-of-funnel channels that started the journey.
Linear attribution distributes credit equally across all touchpoints in the journey. It acknowledges that multiple interactions contributed without making assumptions about which ones mattered most.
Time-decay attribution gives more credit to touchpoints that occurred closer to the conversion event. This model reflects the intuition that recent interactions had more influence on the final decision.
Data-driven attribution uses machine learning to assign credit based on the actual patterns in your conversion data. It requires sufficient conversion volume to work well, but it is generally considered the most accurate model for businesses with enough data to support it.
For B2B SaaS companies with long sales cycles, multi-touch attribution models give a more accurate picture of which channels contribute across the full journey. A prospect who first clicked a LinkedIn ad, then engaged with organic content multiple times, and finally converted through a retargeting campaign represents a journey where credit belongs to multiple channels. Last-click would give it all to retargeting. Exploring the best software for tracking marketing attribution can help you find a platform that supports the model that fits your business.
During your initial setup, run multiple attribution models in parallel. This lets you compare how credit is distributed under different assumptions and identify channels that are undervalued in your current reporting. Top-of-funnel channels like paid social and content often look weak under last-click but show strong influence under linear or time-decay models.
A common pitfall is defaulting to last-click attribution because it is the easiest to configure. Teams that do this often cut top-of-funnel budget because it appears not to drive conversions, when in reality it is driving the initial touchpoints that eventually lead to closed deals.
Your success indicator: you can see how each channel contributes to pipeline and revenue under your chosen model and can explain the logic behind that model to your team and stakeholders.
Step 6: Build Your Customer Journey Dashboard and Analyze the Data
All the tracking infrastructure you have built over the previous five steps now needs a reporting layer that makes the data actionable. A well-designed customer journey dashboard turns raw attribution data into insights your team can actually use to make decisions.
Your dashboard should answer one central question at a glance: which marketing activities are driving closed revenue? Everything else flows from that. Build your reporting around the metrics that connect marketing activity to business outcomes, not just top-of-funnel engagement metrics.
Key metrics to track in your dashboard include cost per lead by source, lead-to-opportunity conversion rate by channel, pipeline velocity by source, and revenue attributed per campaign. Each of these metrics tells a different part of the story. Cost per lead tells you efficiency. Lead-to-opportunity rate tells you quality. Pipeline velocity tells you speed. Revenue attribution tells you impact. Understanding what customer journey analytics encompasses will help you build a dashboard that captures the right signals at each stage.
Use journey analytics to identify where prospects drop off and which touchpoints have the highest influence on conversion. If prospects generated from paid search consistently convert to opportunities at a higher rate than those from paid social, that is a signal worth acting on. If a particular campaign drives many leads but shows slow pipeline velocity, it may be generating low-quality traffic despite strong click-through rates.
Segment your journey data by channel, campaign, and audience to surface patterns that inform budget allocation. A campaign that performs well for enterprise prospects may underperform for SMB, and vice versa. Segmentation reveals these patterns so you can allocate budget with precision rather than spreading it evenly across campaigns. The right customer journey analytics tools make this segmentation and comparison far easier to execute at scale.
Set up a regular reporting cadence. Attribution data only creates value when your team reviews it consistently and acts on it. A weekly or biweekly review of your attribution dashboard keeps the data front and center in campaign planning and budget conversations.
A common pitfall is building a dashboard and never acting on it. The data is only as valuable as the decisions it informs. If your team is not referencing attribution data when making budget changes, the system is not delivering its intended value.
Your success indicator: you can answer the question of which ad campaigns drove the most closed revenue in the last 30 days without relying on gut instinct or manual CRM queries. The answer is visible in your dashboard within seconds.
Step 7: Use Attribution Insights to Optimize Ad Spend and Scale
The final step is where your tracking investment starts paying off directly. Attribution data is only useful if it changes how you allocate budget and structure campaigns. This step is about building a continuous feedback loop between your attribution insights and your campaign decisions.
Start by shifting budget toward channels and campaigns that show the strongest pipeline and revenue attribution, not just the lowest cost per click. A channel with a higher cost per lead but a strong lead-to-revenue conversion rate will often deliver better ROI than a cheaper channel that generates leads that never close. Your attribution data makes this comparison possible. Understanding your B2B SaaS customer acquisition cost by channel is essential context for making these budget shift decisions confidently.
Use AI-driven recommendations to identify high-performing ads and campaigns across channels. Rather than manually reviewing every campaign, AI can surface the patterns in your attribution data that indicate which campaigns warrant increased investment and which should be paused or restructured. This is where platforms with built-in AI analysis, like Cometly, create a significant efficiency advantage for marketing teams managing multiple channels simultaneously.
Feed enriched conversion data back to your ad platforms continuously. As your CRM generates new closed-won events and your billing system records new revenue, those signals should flow back to Meta and Google as offline conversions. This continuous feedback improves the ad platforms' machine learning models over time, helping them optimize toward higher-value prospects rather than surface-level engagement signals.
Identify and pause campaigns that generate leads but show poor downstream conversion rates in your CRM. A campaign that looks strong on cost per lead but shows low opportunity creation or slow pipeline velocity is likely attracting the wrong audience. Attribution data makes these patterns visible before you have wasted significant budget. Applying a structured approach to how you track marketing campaigns ensures these optimization decisions are grounded in reliable data rather than incomplete reporting.
A common pitfall is optimizing for top-of-funnel metrics like clicks and impressions while ignoring downstream revenue attribution. This leads to campaigns that look efficient in the ad platform but fail to generate actual pipeline. Always trace the full journey before making budget decisions.
Your success indicator: your cost per acquired customer is decreasing over time and you can directly connect specific budget changes to pipeline and revenue outcomes. The feedback loop is working when your campaigns get smarter with each optimization cycle.
Putting It All Together
Tracking the entire customer journey is not a one-time setup task. It is an ongoing system that gets more accurate and more valuable as you refine it over time. The seven steps in this guide give you a structured path from defining your touchpoints to using attribution data to drive real budget decisions.
Start with your touchpoint map, get your tracking infrastructure right, connect your data sources, and then build the reporting layer on top of a solid foundation. Teams that get this right stop arguing about which channels deserve credit and start having conversations about how to scale what is working.
The practical order matters: define touchpoints first, implement pixel and first-party tracking, connect CRM data, layer on server-side event passing, configure attribution models, and finally build reporting on top of the complete data layer. Attempting to build reporting before the data layer is complete is one of the most common sources of inaccurate attribution in B2B SaaS marketing.
Cometly is built specifically for B2B SaaS companies that want this level of clarity. It connects your ad platforms, CRM, and billing data into a single attribution platform so you can see exactly which ads and campaigns drive leads, pipeline, and closed revenue. From server-side conversion tracking to AI-powered campaign recommendations, Cometly gives your team the data infrastructure to make every marketing dollar accountable.
If you are ready to track the entire customer journey and turn that data into growth, Get your free demo today and start building a reliable attribution system from the ground up.