Print on demand businesses run on tight margins and high ad spend. You are paying for traffic across Facebook, Google, TikTok, and Pinterest, and without proper tracking, you have no idea which campaigns are actually driving purchases versus which ones are burning budget.
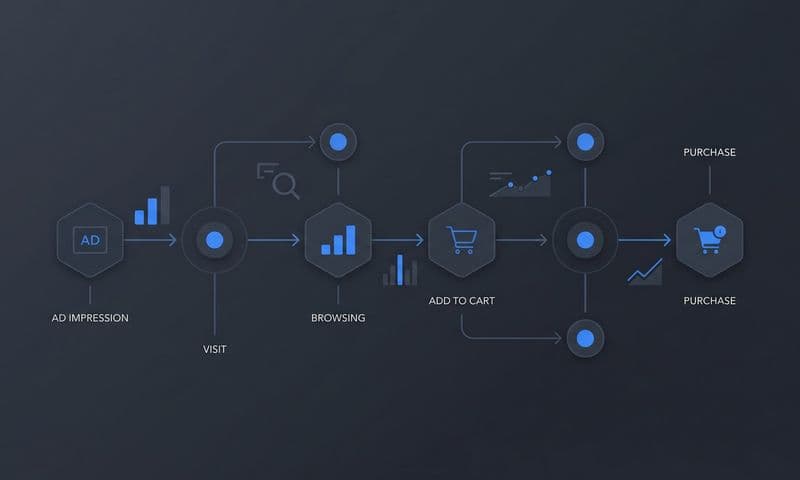
The challenge is real. A customer might discover your custom t-shirt design through a TikTok ad, browse your store twice over three days, click a retargeting ad on Instagram, and finally convert through a Google Shopping result. If your tracking only sees the last click, you will cut the TikTok budget that started the whole journey.
This guide walks you through exactly how to set up tracking for a print on demand business so you can connect every ad click to every sale. You will learn how to install pixel-based tracking, configure server-side events, set up attribution models that reflect your actual customer journey, and build a reporting dashboard that shows real ROI.
Whether you are selling custom apparel, mugs, or wall art through Shopify and a print on demand fulfillment partner like Printful or Printify, the same tracking principles apply. The steps are ordered from foundational setup to advanced attribution, so follow them in sequence for the best results.
By the end of this guide, you will have a complete tracking infrastructure that tells you which ads, audiences, and channels are generating revenue, and which ones are not worth the spend.
Step 1: Define Your Conversion Events Before Touching Any Tracking Tool
Before you install a single pixel or write a line of code, you need a clear map of what you are actually tracking. Skipping this step is one of the most common reasons print on demand store owners end up with messy, unreliable data.
For a print on demand business, the core conversion events that matter are: page view, view content (product page), add to cart, initiate checkout, purchase, and post-purchase upsell. Each of these represents a distinct moment in your store funnel, and each one tells a different story about customer intent.
Not all events carry the same data requirements. Your purchase event must pass revenue data: order value, currency, and order ID. These fields are non-negotiable if you want to calculate ROAS accurately. Other events like add to cart and initiate checkout serve a different purpose. They feed ad platform algorithms with behavioral signals so that campaigns can optimize before enough purchase volume accumulates to train the algorithm on purchases alone.
This is a critical point that many store owners miss. If you only track purchases and your store is newer or lower volume, platforms like Meta and Google will struggle to find buyers because they have no intermediate signal to learn from. Tracking add-to-cart and checkout events gives the algorithm a richer picture of who is engaging with intent.
Here is how to build your event map before touching any tools:
Event Name: Write down each event you plan to track, using the standard naming convention for the platforms you run ads on (Meta's standard events, Google's ecommerce events).
Trigger Location: Note exactly where in your store each event fires. The purchase event fires on the order confirmation page. Add to cart fires when a customer clicks the add to cart button. Be specific.
Data Fields: List the parameters each event should pass. Purchase events need value, currency, order ID, and ideally content IDs. Add to cart events should pass the product ID and value.
Micro vs. Macro: Categorize each event as either a macro conversion (purchase, checkout completion) or a micro conversion signal (page view, add to cart). This distinction helps you configure optimization goals correctly in each ad platform.
The success indicator for this step is simple: you have a written event map on paper or in a shared doc before any code is touched. This document becomes your tracking specification and your reference point when auditing later.
Step 2: Install Browser-Side Pixels on Your Storefront
With your event map in hand, the next step is getting pixel-based tracking live on your store. For most print on demand businesses running on Shopify, this means installing the Meta Pixel and Google Ads conversion tag.
The cleanest way to manage this is through Google Tag Manager. Rather than hardcoding pixel snippets directly into your Shopify theme files, GTM gives you a single container that loads all your tags. When you need to update a pixel or add a new platform, you do it in GTM without touching theme code. This matters because print on demand stores often go through seasonal redesigns or theme updates that can accidentally wipe out hardcoded tracking scripts.
To install GTM on Shopify, add the GTM container snippet to your theme's header and body sections. Then build your tags inside GTM for Meta and Google, using Shopify's data layer to pull dynamic values like product ID, order value, and currency automatically.
When configuring each event tag, make sure you are passing dynamic parameters rather than static placeholders. Every event should include:
Content IDs: The product variant IDs associated with the event, pulled dynamically from the data layer.
Value and Currency: The order total and currency code, critical for revenue-based optimization and ROAS reporting.
Order ID: A unique identifier for each transaction, which you will use for deduplication when you add server-side tracking in the next step.
One important note for print on demand stores specifically: fulfillment integrations with Printful, Printify, or similar partners can occasionally create complications on the order confirmation page. Some configurations redirect customers through a fulfillment partner's flow before returning to your Shopify thank you page. Test this carefully. Place a test order and confirm that your purchase event fires on the final confirmation page with the correct parameters before assuming your setup is working.
To verify everything is firing correctly, use the Meta Pixel Helper browser extension and Google Tag Assistant. Both tools show you in real time which events are firing, what parameters are being passed, and whether there are any errors. Do not move to the next step until both tools show clean, parameterized events firing on the correct pages.
The success indicator here is that Meta Events Manager and Google Ads show test events arriving with the correct parameters, including value, currency, and order ID, across all key funnel stages.
Step 3: Set Up Server-Side Tracking With the Conversions API
Browser-side pixels are a necessary foundation, but they are no longer sufficient on their own. iOS privacy updates, ad blockers, and increasingly strict browser cookie restrictions mean that a meaningful portion of conversions that happen in your store never get reported back to Meta or Google through the browser pixel alone.
This is not a minor gap. For stores with a high proportion of iOS traffic or audiences in privacy-conscious markets, browser pixel signal loss can be substantial. The result is underreported conversions, degraded algorithm performance, and ad spend decisions based on incomplete data.
Server-side tracking solves this by sending conversion events directly from your server to the ad platform, completely bypassing the browser. The Meta Conversions API (CAPI) is the primary implementation for Meta advertising. Google's equivalent is Enhanced Conversions.
Here is how to approach the setup:
Meta Conversions API: Shopify has a native CAPI integration available through the Meta channel app. This sends purchase events from Shopify's server directly to Meta in parallel with your browser pixel. The key requirement is that both the browser pixel event and the CAPI event use the same event ID. This shared ID is what allows Meta to deduplicate the two signals and count the conversion only once rather than twice. Without this, your reported conversions will be inflated and your optimization data will be corrupted.
Google Enhanced Conversions: For Google Ads, Enhanced Conversions works by passing hashed customer data (email address, phone number) alongside your conversion events. Google uses this data to match conversions to logged-in Google accounts, improving match rates and recovering conversions that would otherwise be missed due to cookie loss. You can configure this through Google Tag Manager by passing the customer's email from your Shopify checkout into the conversion tag.
Third-Party Attribution Platforms: If you want a more unified approach that handles server-side event sending across multiple platforms from a single integration, tools like Cometly handle server-to-server event delivery natively. This means you configure your events once and the platform manages the server-side transmission to Meta, Google, and other ad channels, along with deduplication logic, without you having to manage separate CAPI integrations for each platform.
After setup, verify your work in Meta Events Manager. Look for the event match quality score on your purchase event. A higher score means Meta is successfully matching more of your conversion events to real user profiles, which directly improves your campaign targeting and optimization. You should also confirm that the deduplication is working correctly: the event count in Events Manager should reflect real purchase volume, not double the number.
The success indicator is a healthy event match quality score in Meta Events Manager, with both browser and server events showing up and deduplication confirmed as active.
Step 4: Configure UTM Parameters and Source Tracking Across All Ad Channels
Pixels and server-side events tell ad platforms what happened. UTM parameters tell your analytics tools and attribution platform where the customer came from. Both layers are essential, and neither replaces the other.
For tracking across a print on demand business with multiple ad channels, you need a consistent UTM naming convention applied to every campaign, ad set, and ad across Meta, Google, TikTok, and Pinterest. Without consistency, your reporting becomes fragmented and you cannot reliably compare performance across channels.
A clean UTM structure for print on demand advertising looks like this:
utm_source: The platform (facebook, google, tiktok, pinterest)
utm_medium: The ad type (cpc, paid-social, display)
utm_campaign: The campaign name, using a consistent format like [product-line]_[objective]_[date]
utm_content: The ad creative identifier, so you can trace revenue back to specific ad variations
utm_term: The ad set or audience name, useful for comparing audience performance within a campaign
For Google Ads, enable auto-tagging alongside your UTMs. Auto-tagging captures the GCLID (Google Click Identifier), which passes additional click-level data into Google Analytics and Google Ads that UTMs alone cannot capture, including keyword, match type, and ad position.
One of the most common tracking failures in print on demand stores is UTM data getting lost mid-session. A customer clicks your ad, lands on a collection page, navigates to a product page, and by the time they reach checkout, the original UTM parameters are gone. Your analytics platform records the purchase as direct traffic, and the ad that drove it gets no credit.
To prevent this, store UTM parameters in a first-party cookie when a visitor lands on your site. Most analytics platforms and attribution tools do this automatically, but if you are building a custom setup, make sure the cookie persists through the full session and survives the Shopify checkout redirect.
The success indicator for this step is that every session in your analytics platform shows an identifiable traffic source and campaign name. If you are seeing a high percentage of sessions attributed to direct or unknown, UTM data is being lost somewhere in the funnel and needs to be investigated before your attribution data can be trusted.
Step 5: Choose and Apply the Right Attribution Model for Your Business
With your tracking infrastructure in place, the next question is how to assign credit for conversions across the multiple touchpoints in a typical print on demand purchase journey.
Attribution models are the rules that determine which touchpoints get credit for a sale. The most common models are:
Last-Click Attribution: Gives 100% of the credit to the final touchpoint before conversion. Simple, but misleading for multi-touch journeys. It systematically over-credits retargeting ads and branded search while ignoring the awareness-driving ads that started the journey.
First-Touch Attribution: Gives 100% of the credit to the first interaction. Better for understanding what drives discovery, but it ignores the role of retargeting and mid-funnel content in closing the sale.
Linear Attribution: Distributes credit equally across all touchpoints in the journey. More balanced than single-touch models and a good starting point for most print on demand businesses.
Time-Decay Attribution: Gives more credit to touchpoints closer to the conversion, with diminishing credit for earlier interactions. Useful if you believe closing-intent signals deserve more weight than early discovery.
Data-Driven Attribution: Uses algorithmic modeling to assign credit based on the actual contribution of each touchpoint to conversions. Requires sufficient conversion volume to be reliable, but produces the most accurate picture when data is available.
For a print on demand business, the typical customer journey looks like this: discovery via a social ad on Meta or TikTok, organic search or direct visit during consideration, and conversion via a retargeting ad or branded search. Under last-click attribution, the retargeting ad or branded search gets all the credit. The top-of-funnel social ad that started everything gets nothing.
This matters because if you are making budget decisions based on last-click data, you will systematically underfund the channels driving awareness and overfund retargeting. Over time, your retargeting pool shrinks because you stopped feeding it new prospects, and performance declines.
Starting with a linear or time-decay model gives you a more honest view of channel contribution. From there, comparing models side by side reveals important insights: a channel that looks underperforming under last-click attribution may show strong first-touch influence, meaning it is driving discovery that other channels close.
Platforms like Cometly let you compare attribution models in a single dashboard, applying different models to the same underlying data so you can see how revenue attribution shifts depending on the model. This kind of side-by-side comparison is what separates data-driven budget decisions from guesswork.
The success indicator is that you can identify at least one channel where last-click attribution and first-touch attribution tell materially different stories about performance, which confirms your multi-touch tracking is working and your attribution model choice actually matters.
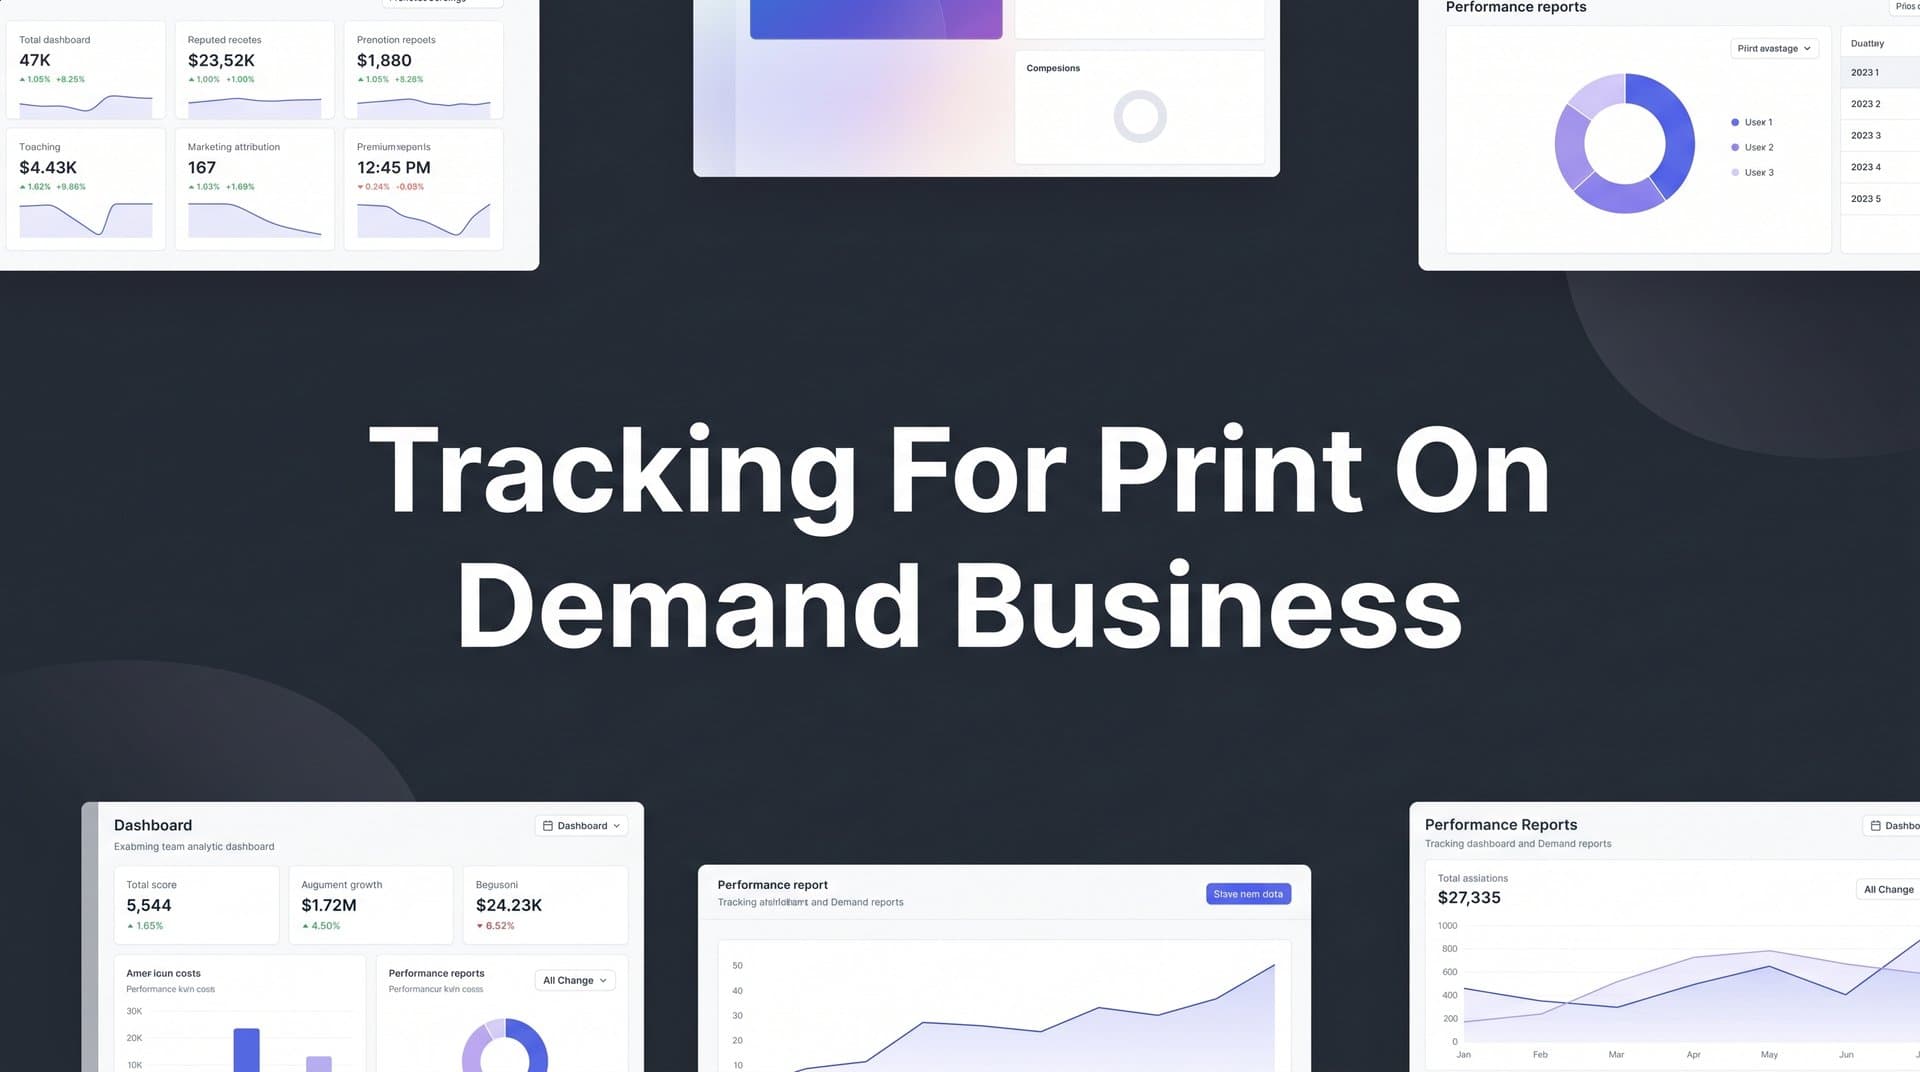
Step 6: Build a Reporting Dashboard That Connects Ad Spend to Revenue
All the tracking infrastructure you have built in the previous steps only creates value if you can see the data in one place and act on it. Switching between Meta Ads Manager, Google Ads, TikTok Ads Manager, and Shopify to piece together a performance picture is slow, error-prone, and almost guaranteed to produce misleading conclusions.
The goal of this step is a single reporting dashboard that shows ad spend and revenue together, broken down by channel and campaign, with ROAS calculated from your actual attributed revenue rather than each platform's self-reported numbers.
Here are the key metrics your print on demand reporting dashboard should track:
Cost Per Purchase: Total ad spend divided by the number of attributed purchases. This is your primary efficiency metric at the campaign level.
Revenue by Channel: How much revenue each ad platform is driving, attributed using your chosen model. This is the number that tells you where to allocate budget.
Revenue by Campaign: Which specific campaigns are generating sales, so you can scale winners and pause underperformers.
Blended ROAS: Total revenue divided by total ad spend across all channels. This is your north star metric because it accounts for the full picture, not just what each platform claims.
Top-Performing Creatives by Revenue: Which ad creatives are actually driving purchases, not just clicks or impressions. High click-through rate does not always correlate with high purchase rate, especially for visual products like custom apparel.
A critical pitfall to avoid here is relying solely on platform-reported ROAS from Meta, Google, or TikTok. Each platform uses its own attribution model and attribution window, and they all take credit for conversions that other platforms also claim. The sum of platform-reported ROAS figures almost always exceeds your actual business performance. This is attribution overlap, and it is why blended ROAS from a neutral third-party attribution tool typically tells a very different story than the individual platform dashboards.
Cometly connects your ad platforms and Shopify store into a unified attribution dashboard that shows which campaigns are driving actual revenue, not just what each platform wants you to believe. You get a single view of ad spend, attributed revenue, and ROAS by channel and campaign, with AI-driven recommendations on where to scale and where to cut.
The success indicator for this step is that you have one place to open every morning where you can see total spend, total attributed revenue, and ROAS broken down by channel and campaign, without logging into multiple platforms to assemble the picture manually.
Putting It All Together: Your Print on Demand Tracking Checklist
You now have a complete tracking infrastructure for your print on demand business. Here is a quick-reference checklist to confirm everything is in place:
1. Written event map with event names, trigger locations, and required data fields for all funnel stages
2. Browser-side pixels installed via Google Tag Manager with dynamic parameters passing correctly on all key events
3. Meta Conversions API and Google Enhanced Conversions configured with deduplication active using shared event IDs
4. Consistent UTM naming convention applied to all campaigns across Meta, Google, TikTok, and Pinterest, with UTM data persisting through checkout
5. Attribution model selected and applied, with the ability to compare models side by side to understand channel contribution across the full funnel
6. Unified reporting dashboard showing ad spend, attributed revenue, and ROAS by channel and campaign in a single view
Tracking is not a one-time setup. It is an ongoing process that requires regular attention. Pixels break when themes update. UTM parameters get misconfigured when new campaigns launch. CAPI integrations can drift out of sync after platform updates. Plan to audit your full tracking setup at least once a month. Check that events are firing correctly, UTM data is being captured, and your attribution data matches expected order volume from Shopify.
If you want to shortcut the complexity of managing all of this across multiple platforms, Cometly unifies every layer: capturing every touchpoint from ad click to purchase, connecting ad spend to revenue, and providing AI-driven recommendations on where to scale your print on demand campaigns.
Ready to see exactly which ads are driving revenue in your print on demand store? Get your free demo today and start capturing every touchpoint to maximize your conversions.