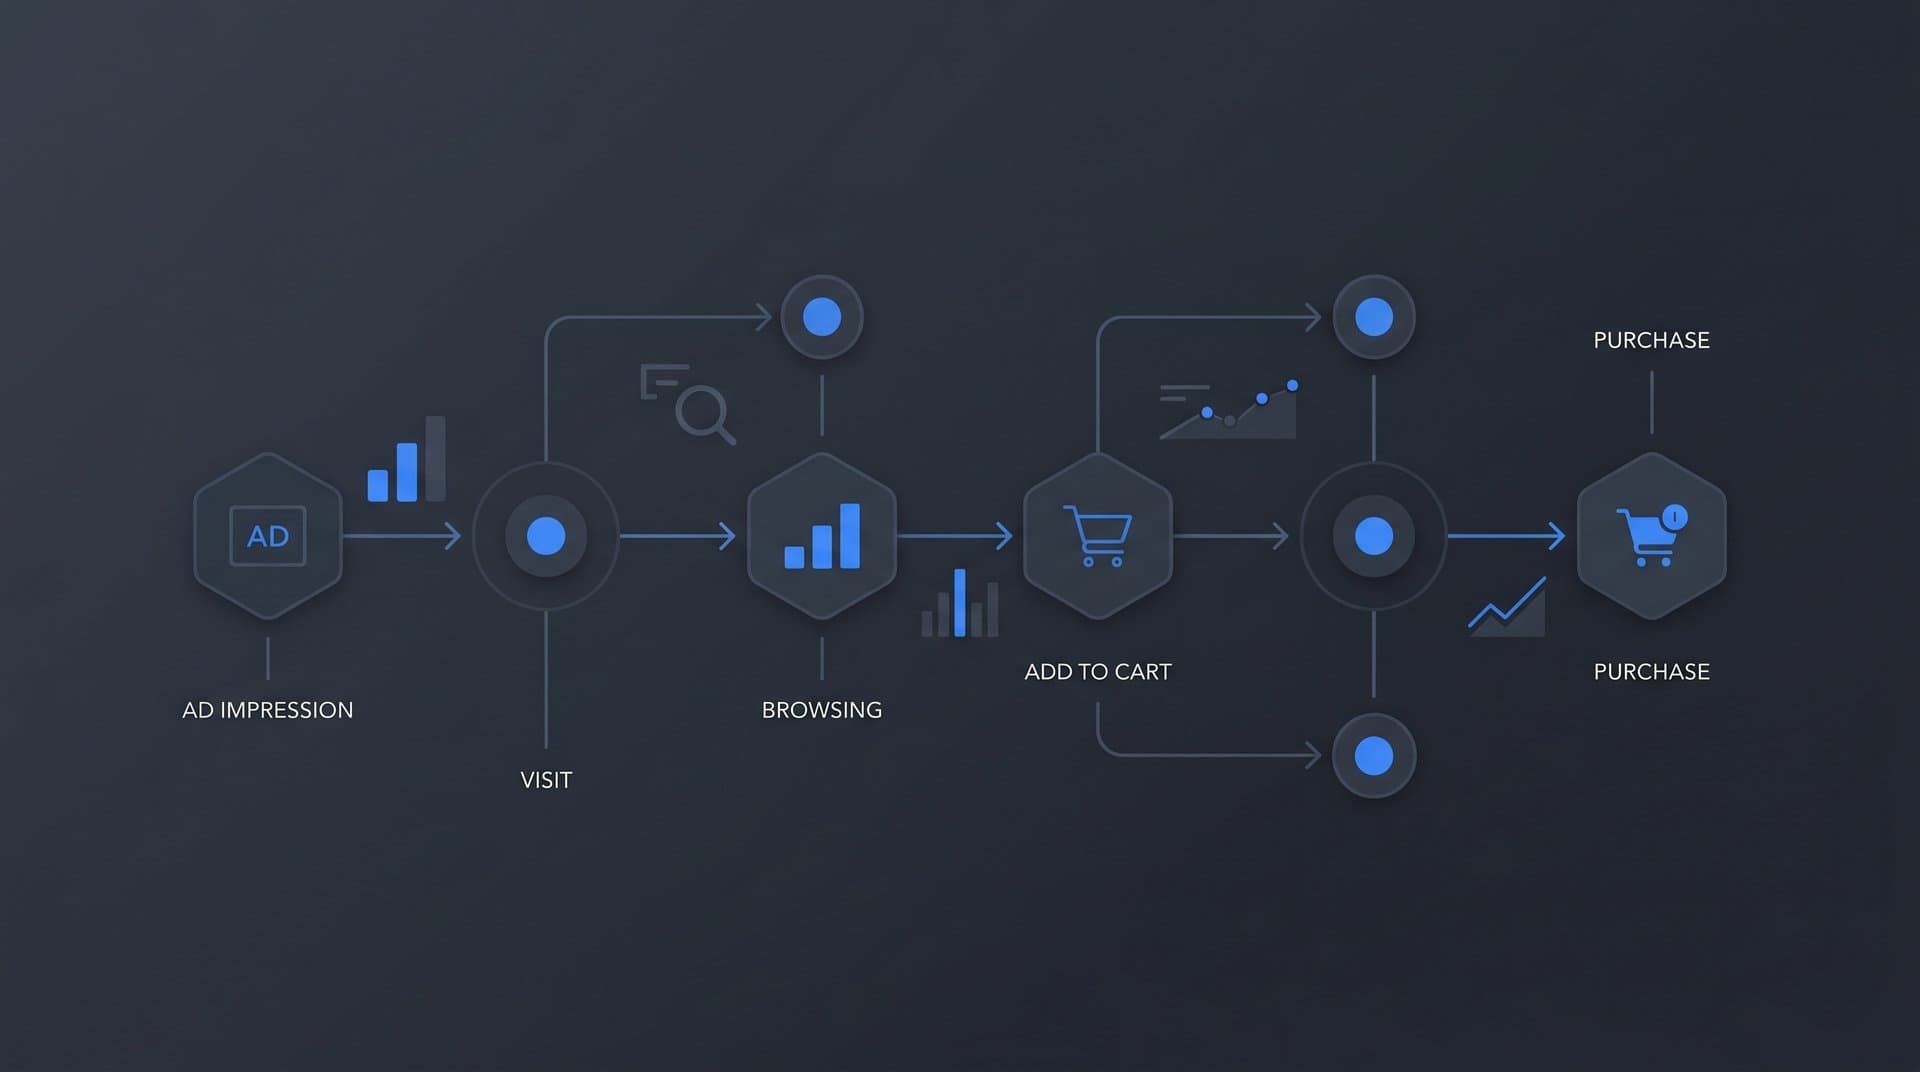
Most ecommerce marketers are optimizing in the dark. They know their conversion rate. They know their cost per click. But they have no clear picture of how a customer actually moves from first ad impression to completed purchase. That gap is where budget gets wasted and growth stalls.
Customer journey mapping changes that. It gives your team a structured, visual representation of every touchpoint a buyer encounters before they convert. For ecommerce businesses running paid ads across multiple channels, this is not a nice-to-have exercise. It is the foundation of accurate attribution, smarter budget allocation, and campaigns that actually scale.
This guide walks you through the exact process of building a customer journey map for your ecommerce store. You will learn how to define your buyer stages, identify your highest-impact touchpoints, connect journey data to real revenue outcomes, and use that intelligence to improve your ad performance.
Whether you are running a direct-to-consumer brand or a product-led SaaS with an ecommerce component, these steps apply. By the end, you will have a working framework that connects your marketing activity to measurable results and gives you the clarity to make confident, data-driven decisions.
Step 1: Define Your Buyer Personas and Core Journey Stages
Before you map a single touchpoint, you need to know who you are mapping for. Start with one or two primary buyer personas rather than trying to capture every possible customer type at once. A persona that is too broad produces a journey map that is too generic to act on.
For each persona, document their core goals, the pain points that drive them to search for a solution, and the specific triggers that push them from passive interest to active buying intent. Think about what they are trying to accomplish and what objections they need to overcome before they purchase.
Once your persona is defined, structure your journey around five core stages: Awareness, Consideration, Decision, Purchase, and Post-Purchase. These stages reflect how buyers actually move through a funnel, from first encountering your brand to becoming a repeat customer. If your team uses different language internally, rename the stages to match. The goal is alignment, not adherence to a template.
Awareness: The buyer recognizes a need or problem and begins encountering potential solutions, including your brand.
Consideration: The buyer is actively comparing options and evaluating whether your product fits their needs.
Decision: The buyer has narrowed their choices and is looking for the final confirmation they need to purchase.
Purchase: The transaction happens. This stage includes checkout behavior, payment friction, and post-click landing experience.
Post-Purchase: The buyer receives their order, forms their opinion of the brand, and decides whether to return or refer others.
A common mistake at this stage is building a journey map that reflects what you want the buyer to do rather than what they actually do. The persona definition is your anchor. Keep coming back to it as you build out the rest of the map.
Success indicator: You have a written persona profile and a named stage structure documented before moving to touchpoint research. If you cannot describe your primary buyer in a few clear sentences, the rest of the map will lack focus.
Step 2: Audit Every Touchpoint Across Your Channels
Now that you have your persona and stage structure, it is time to take inventory of every place a buyer might encounter your brand. This is a more thorough exercise than most teams expect, and that is exactly the point.
Start by listing every channel where your brand has a presence: paid social, paid search, organic search, email, SMS, retargeting, influencer content, affiliate partnerships, and direct traffic. For each channel, go one level deeper and identify the specific touchpoints within it.
A Meta ad campaign, for example, is not a single touchpoint. It contains multiple distinct interactions: the initial impression in the feed, the click through to a landing page, any retargeting ads served after the first visit, and any engagement with video content along the way. Each of these is a separate touchpoint with its own role in the buyer journey.
Use your ad platform data, CRM records, and analytics tools to verify which touchpoints actually exist in your current setup. There is an important distinction between touchpoints you have built and touchpoints you assume exist. Many ecommerce teams discover during this audit that campaigns they thought were running have gaps, or that retargeting sequences they believed were active were never properly configured.
Flag tracking gaps immediately. Any touchpoint that exists in your channel mix but is not being tracked is a blind spot in your attribution. These gaps cause spend to be misattributed, often pushing credit toward the last measurable click while the actual influence of earlier touchpoints goes unrecorded.
Organize your touchpoint list by channel and by journey stage as you go. A simple spreadsheet works well at this point. Columns for channel, touchpoint name, journey stage, and tracking status give you the structure you need before moving into the mapping phase.
Pay particular attention to mid-funnel touchpoints. Email sequences, comparison content, and retargeting ads that run during the Consideration stage are frequently undertracked and undervalued. They rarely get last-click credit, but they often do significant work in moving buyers toward a decision.
Success indicator: A complete list of touchpoints organized by channel and journey stage, with a clear note on whether each one is currently tracked. If you find more than a handful of untracked touchpoints, that becomes a priority to address before you can trust your journey data.
Step 3: Map Touchpoints to Journey Stages Using Real Data
With your touchpoint inventory in hand, the next step is to assign each touchpoint to its corresponding journey stage. This is where the map starts to take shape, and where the quality of your attribution data becomes critical.
The assignment should be driven by data, not assumptions. A TikTok top-of-funnel video ad belongs in Awareness because buyers encountering it typically have no prior relationship with your brand. A Google branded search ad belongs in Decision because buyers typing your brand name into a search engine already know who you are and are actively evaluating whether to buy. These are logical placements, but your attribution data should confirm them.
Pull conversion path reports from your attribution platform. Look at the sequences of touchpoints that appear before completed purchases. You will likely find that some channels appear consistently early in the path, others appear in the middle, and others appear just before conversion. Let this data guide your stage assignments rather than relying on conventional wisdom about where a channel belongs.
One pattern worth watching for: touchpoints that appear across multiple stages. Email is a common example. Early in the journey, a welcome sequence or educational newsletter might play a Consideration role. Later, a promotional email with a time-sensitive offer might serve a Decision function. When a channel plays multiple roles, map it at each stage where it appears rather than forcing it into a single category.
Identify your highest-frequency conversion paths. These are the sequences of touchpoints that most commonly appear before a purchase. If a large portion of your buyers follow a pattern of paid social impression, organic search visit, email click, and then purchase, that path deserves more attention and more protection in your budget allocation than paths that appear infrequently.
Common pitfall: Mapping based on what you want the journey to look like rather than what the data shows. It is tempting to place your highest-spend channels in prominent journey positions to justify the investment. Resist that impulse. The map is only useful if it reflects reality.
Success indicator: A visual diagram or structured table showing each touchpoint mapped to its journey stage, with supporting data from your attribution platform confirming the placement. This becomes your working journey map.
Step 4: Identify Drop-Off Points and Attribution Gaps
A journey map that only shows where buyers go is incomplete. You also need to understand where they stop. Identifying drop-off points is one of the most actionable parts of this entire process.
For each stage transition in your map, calculate how many buyers move forward versus how many exit. Awareness to Consideration, Consideration to Decision, Decision to Purchase. Each of these transitions has a conversion rate, and the gaps between them reveal where your funnel leaks most severely.
High drop-off between Awareness and Consideration often points to a targeting or messaging problem. You are reaching people who are not genuinely interested, or your initial touchpoints are not communicating value clearly enough to earn a second interaction. High drop-off between Decision and Purchase frequently signals friction in the checkout experience, pricing concerns, or a lack of trust signals at the moment of conversion.
Once you have documented your stage-to-stage drop-off rates, cross-reference them with your attribution data. Look for touchpoints that receive zero or minimal credit under your current attribution model. These are often mid-funnel channels that influence the buyer's decision but never receive the last click. Under last-click attribution, they appear worthless. In reality, they may be doing significant work to move buyers through the Consideration stage.
Server-side tracking gaps deserve particular attention here. Browser-based pixel tracking has become less reliable due to ad blockers, iOS privacy changes, and browser-level restrictions. If your Conversion API is not properly configured, entire purchase events may be going unrecorded. This creates attribution errors that distort your entire journey map, making some channels appear more effective than they are and others appear less effective.
Prioritize fixing tracking gaps before optimizing ad spend. This is a hard rule. You cannot make good decisions about where to invest if your data is missing significant events. A journey map built on incomplete tracking data will lead you to wrong conclusions.
Success indicator: A documented list of drop-off rates by stage transition and a clear inventory of any tracking gaps, including unresolved pixel issues or missing Conversion API events, that need to be addressed before your next optimization cycle.
Step 5: Choose the Right Attribution Model for Your Journey
Your journey map now shows you where buyers go and where they drop off. The next question is how you assign credit to the touchpoints that contributed to a conversion. That is the job of your attribution model, and the model you choose will significantly shape how you interpret your data.
Last-click attribution is the default for many ecommerce platforms, and it is also the most misleading for complex buyer journeys. It gives all conversion credit to the final touchpoint before purchase, which means every channel that built awareness, drove consideration, and nurtured intent receives zero credit. Over time, this pushes budget toward bottom-of-funnel channels while starving the top-of-funnel activity that actually generates demand.
For ecommerce journeys with multiple touchpoints across multiple channels, multi-touch attribution models provide a more accurate picture. The main options each serve a different analytical purpose.
Linear attribution distributes credit evenly across all touchpoints in the conversion path. It is simple and avoids the distortion of last-click, but it treats every touchpoint as equally important regardless of when or how it influenced the buyer.
Time-decay attribution weights touchpoints more heavily as they get closer to the conversion event. This is a reasonable model for short buying cycles where recent interactions are genuinely more influential.
Data-driven attribution uses algorithmic weighting based on actual conversion patterns in your data. It assigns credit based on which touchpoints most frequently appear in paths that convert versus paths that do not. For ecommerce operations with high transaction volume and complex multi-channel journeys, this model tends to produce the most actionable insights.
Match your attribution model to the complexity of your buyer journey. If most buyers convert after two or three touchpoints within a short window, a simpler model may be sufficient. If your average conversion path spans seven or more touchpoints across several weeks, data-driven attribution is worth the setup investment.
Running multiple models in parallel is a useful practice. Comparing last-click results against a multi-touch model reveals which channels are being systematically undervalued in your current reporting. Those discrepancies often point directly to where your budget reallocation opportunities exist.
Success indicator: A selected attribution model applied consistently across your journey map, with a documented rationale for why it fits your buyer path complexity and average conversion window.
Step 6: Connect Journey Insights to Ad Performance and Budget Decisions
A journey map that sits in a slide deck and never changes how money is spent has no real value. The purpose of this entire exercise is to make better decisions about where to invest and how to structure your campaigns. This step is where the map earns its keep.
Start by comparing your current budget allocation against the touchpoint frequency data in your journey map. Are you investing heavily in channels that appear early in high-converting paths? Or is most of your budget concentrated at the bottom of the funnel, where buyers are already close to converting and the incremental lift from additional spend is lower?
Many ecommerce teams discover that channels consistently appearing in the early stages of their highest-converting paths are receiving disproportionately little budget. Paid social awareness campaigns, content-driven organic traffic, and upper-funnel video ads often fall into this category. They are silently driving pipeline, but because they rarely receive last-click credit, they look like underperformers in standard reporting.
Use your journey data to build audience segments that reflect real buyer behavior. Buyers who have completed two or three early-stage touchpoints are fundamentally different from cold audiences. They have already demonstrated intent signals. Retargeting them with messaging that matches their stage in the journey is far more effective than serving them the same top-of-funnel creative they have already seen.
Feed enriched conversion data back to your ad platforms. When your Conversion API sends accurate, first-party event data to Meta and Google, the platform algorithms can optimize toward buyers who match your highest-converting journey patterns. This is one of the most direct ways your journey map translates into improved ad performance. Better data inputs produce better algorithmic targeting outputs.
Platforms like Cometly are built specifically for this kind of work. By connecting your ad platforms, CRM, and website into a single attribution view, Cometly gives you real-time visibility into which touchpoints are driving revenue and which channels are contributing to your highest-value conversion paths. That clarity makes budget decisions faster and more defensible.
Success indicator: At least one concrete budget or campaign structure change made directly as a result of your journey map analysis. If the map has not yet changed a single decision, it has not yet done its job.
Step 7: Review, Iterate, and Keep Your Map Current
The final step is also an ongoing one. A customer journey map is not a one-time deliverable. It is a living document that needs to evolve as your campaigns change, new channels are introduced, and buyer behavior shifts.
Set a recurring review cadence before you do anything else. For high-volume ecommerce operations, monthly reviews give you enough data to spot meaningful changes in touchpoint frequency and stage conversion rates. For lower-volume businesses, quarterly reviews are a reasonable minimum. The key is consistency. An irregular review process leads to a map that quietly becomes outdated without anyone noticing.
During each review, track three core metrics: touchpoint frequency by stage, stage-to-stage conversion rates, and attribution credit distribution across channels. Significant changes in any of these often signal a shift in buyer behavior, the impact of a new campaign, or a tracking issue that has introduced noise into your data.
When you identify a meaningful change, update the map and adjust your campaign strategy accordingly. If a new channel is appearing more frequently in early-stage paths, it may warrant increased investment. If a previously reliable mid-funnel touchpoint has dropped in frequency, investigate whether the channel is underperforming or whether a tracking gap has made it invisible in your data.
Use version control for your journey map. Keeping dated versions allows you to compare how the buyer journey has evolved over time and to understand which changes in your marketing activity produced which shifts in buyer behavior. It also keeps your team aligned on a shared, current understanding of how your funnel actually works.
The goal is not a perfect map. The goal is a map that is accurate enough to guide decisions and updated frequently enough to remain relevant. That standard is achievable with a consistent review process and the right attribution data to support it.
Success indicator: A documented review schedule on your team calendar and a version-controlled journey map that reflects your most recent attribution data and campaign structure.
Putting It All Together
Building a customer journey map for your ecommerce operation is one of the highest-leverage activities your marketing team can undertake. It replaces guesswork with a structured understanding of how buyers move from first impression to purchase. More importantly, it gives you the foundation to make attribution accurate, ad spend intentional, and growth repeatable.
Start with a single persona and one primary journey. Get the data right. Fix your tracking gaps. Then use that clarity to make smarter budget decisions and feed better signals back to your ad platforms.
Cometly is built to support exactly this kind of work. By connecting your ad platforms, CRM, and website into a single attribution view, Cometly gives you the real-time journey data you need to build accurate maps, identify high-performing touchpoints, and scale campaigns with confidence. The journey map is your strategy. The data is what makes it real.
Here is your quick-start checklist to get moving:
1. Define your primary buyer persona and name your journey stages.
2. Audit and list all active touchpoints organized by channel.
3. Map touchpoints to stages using real attribution data, not assumptions.
4. Identify drop-off points between stages and document any tracking gaps.
5. Select an attribution model that fits your journey complexity and conversion window.
6. Adjust budget and campaign structure based on what the journey data reveals.
7. Schedule regular map reviews and maintain a version-controlled document.
Ready to build your journey map on a foundation of accurate, real-time attribution data? Get your free demo and see how Cometly connects every touchpoint to revenue so you can scale with confidence.