Every marketing team faces the same frustrating question: where should we actually put our budget? You are running ads on Meta, Google, LinkedIn, and TikTok simultaneously, but your attribution data is scattered, incomplete, or contradictory. One platform claims credit for a conversion that another platform also claimed. Your last-click data tells one story, but your revenue tells another.
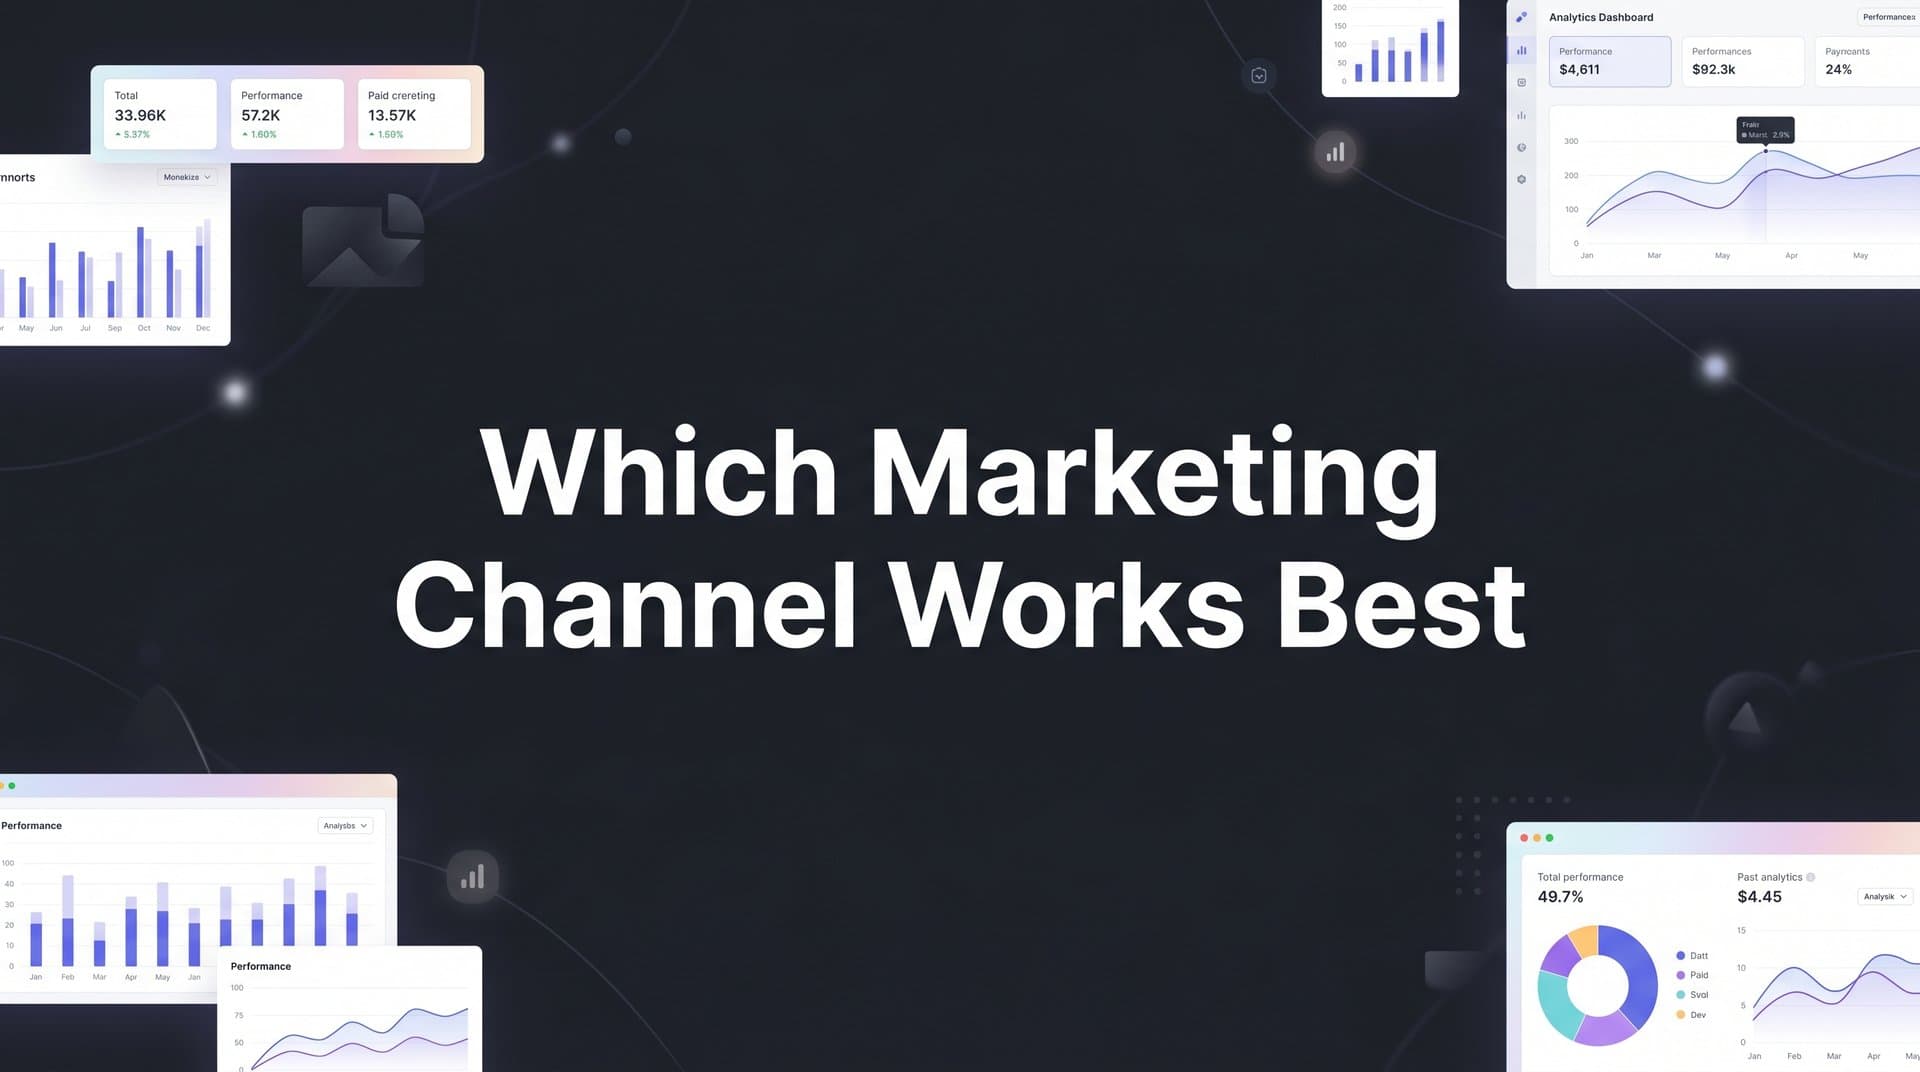
The truth is that no single marketing channel universally outperforms the rest. The channel that works best depends entirely on your audience, your offer, your funnel stage, and how accurately you are measuring performance. The marketers who consistently scale their campaigns are not the ones who guessed right about which channel to use. They are the ones who built systems to measure channel performance with precision and act on what the data actually shows.
This guide gives you seven actionable strategies to stop guessing and start knowing which channels drive real results for your business. From setting up proper attribution frameworks to using AI-powered analysis to surface winning patterns, each strategy builds toward a clearer, more confident view of your marketing mix. Whether you are a growth marketer at a SaaS company or an agency managing multi-platform campaigns, these approaches will help you allocate budget with confidence and scale what actually works.
1. Build a Multi-Touch Attribution Framework Before Comparing Channels
The Challenge It Solves
Most channel comparisons are built on last-click attribution by default. The problem is that last-click gives all the credit to the final touchpoint before a conversion, completely ignoring every channel that influenced the buyer along the way. You end up over-investing in bottom-funnel channels and starving the awareness and consideration channels that actually started the journey.
If your attribution model is distorted, every channel decision you make downstream will be distorted too. This is the foundational problem that has to be solved before anything else.
The Strategy Explained
Multi-touch attribution distributes conversion credit across all the touchpoints in a customer journey rather than crediting only the last click. Models like linear, time-decay, position-based, and data-driven attribution each offer a different lens on how channels contribute. The right model for your business depends on your sales cycle length, the number of touchpoints in a typical journey, and how much historical data you have available.
The critical step is not just choosing a model. It is implementing consistent tracking infrastructure so that every channel feeds into the same attribution system. When channels report into siloed dashboards, you are comparing apples to oranges. A unified multi-touch attribution setup gives you a single, coherent view of how channels interact and contribute across the full journey.
Implementation Steps
1. Audit your current attribution setup and identify where last-click is being used as the default model across your ad platforms and analytics tools.
2. Choose an attribution model that reflects your typical customer journey length and complexity. Longer B2B sales cycles often benefit from time-decay or data-driven models.
3. Implement consistent UTM parameters and tracking across every channel so all touchpoint data flows into one centralized attribution platform.
4. Compare channel performance under multiple attribution models side by side to understand how credit shifts and which channels are being undervalued.
Pro Tips
Do not anchor too rigidly to a single attribution model. Use model comparison as a diagnostic tool. When a channel looks very different under last-click versus data-driven attribution, that gap is telling you something important about its actual role in your funnel. Cometly's attribution dashboard makes it easy to toggle between models and see the impact in real time. If you want to explore how different platforms handle this, reviewing attribution modeling for marketing can help you choose the right approach.
2. Map Each Channel to a Specific Stage of Your Customer Journey
The Challenge It Solves
One of the most common mistakes in channel evaluation is applying the same performance benchmark to every channel regardless of its role. Holding a display awareness campaign to the same cost-per-acquisition target as a branded search campaign is like judging a quarterback by how many tackles they make. The metric does not match the function.
When you evaluate channels without accounting for funnel stage, you will consistently undervalue upper-funnel channels and over-credit lower-funnel ones.
The Strategy Explained
Different channels naturally serve different purposes at different stages of the buyer journey. Paid search typically captures demand that already exists. When someone searches for a specific solution, they are often close to a decision. Paid social and display, on the other hand, are better suited for generating awareness and nurturing consideration among audiences who do not yet know they need your product.
The key is to assign stage-appropriate KPIs to each channel before you evaluate it. An awareness channel should be measured on reach, engagement, and assisted conversions. A conversion channel should be measured on cost per acquisition and return on ad spend. Mixing these benchmarks produces misleading channel comparisons and bad budget decisions. Understanding marketing channel effectiveness at each stage is essential before drawing any conclusions about where to invest.
Implementation Steps
1. Map your current active channels to awareness, consideration, and conversion stages based on where they typically reach your audience in the buying process.
2. Define distinct KPIs for each funnel stage. Awareness: reach, engagement rate, view-through assists. Consideration: click-through rate, time on site, return visit rate. Conversion: cost per acquisition, revenue per click, ROAS.
3. Set up reporting that segments channel performance by funnel stage so you are never comparing an awareness channel directly against a conversion channel on the same metric.
4. Revisit these mappings quarterly. Channels can shift roles as your audience matures and your funnel evolves.
Pro Tips
Pay close attention to assisted conversion data. A channel that rarely appears as the last click before conversion may be appearing consistently as an early touchpoint. That channel is doing real work even if it looks invisible in last-click reports. Multi-touch attribution surfaces these contributions clearly.
3. Use Server-Side Tracking to Eliminate Data Gaps Across Platforms
The Challenge It Solves
Browser-based tracking has become significantly less reliable over the past several years. Apple's App Tracking Transparency framework, introduced in 2021, gave iOS users the ability to opt out of cross-app tracking, which reduced the signal available to platforms like Meta. Ad blockers and the ongoing deprecation of third-party cookies have compounded the problem. The result is that a meaningful portion of your conversions are simply not being captured by client-side tracking methods.
When conversions go unmeasured, channels that drive those conversions appear to underperform. You make budget decisions based on an incomplete picture.
The Strategy Explained
Server-side tracking routes conversion events through your own server before sending them to ad platforms, rather than relying on a browser pixel that can be blocked or degraded. Meta's Conversions API (CAPI) and Google's enhanced conversions are both server-side implementations that platforms themselves recommend for more reliable event matching.
When you implement server-side tracking, you recover conversion data that client-side pixels miss. This changes the reported performance of your channels, often significantly. Channels that appeared to have high cost-per-acquisition may look considerably more efficient once their full conversion volume is captured.
Implementation Steps
1. Audit your current tracking setup to identify what percentage of your conversions are being captured via browser pixels versus server-side methods. Most analytics platforms can show you event match quality scores.
2. Implement server-side tracking for your highest-priority conversion events, starting with purchases and qualified lead form submissions.
3. Set up Meta CAPI and Google enhanced conversions to feed server-side event data directly back to each platform's algorithm.
4. Compare conversion volume before and after implementation to quantify the data gap you were previously missing.
Pro Tips
Server-side tracking is not just about recovering lost data. It also improves the quality of data you send back to ad platforms, which feeds their machine learning algorithms better signals for targeting and optimization. Better data in means better optimization out. Cometly's server-side tracking infrastructure handles this automatically, ensuring your conversion events are captured and synced accurately across platforms. For a broader view of how tracking fits into your overall stack, exploring the best performance marketing tracking software options can help you benchmark your current setup.
4. Run Controlled Budget Experiments to Test Channel Efficiency
The Challenge It Solves
Correlation is not causation, and this distinction matters enormously in channel evaluation. Just because conversions increase when you increase spend on a particular channel does not mean that channel caused those conversions. Multiple channels are running simultaneously, and without controlled conditions, you cannot isolate which one is actually responsible for the lift.
Relying on correlation-based analysis leads to over-crediting whichever channel happens to be running at the same time as a conversion spike, which can send budget in entirely the wrong direction.
The Strategy Explained
Incrementality testing, sometimes called geo-lift testing or holdout testing, is the method performance marketers use to isolate true channel contribution. The principle is straightforward: you create a test group that is exposed to a channel and a control group that is not, then measure the difference in conversion rates between the two groups. The difference represents the incremental lift that channel actually produced.
Controlled budget experiments follow a similar logic. You pause or significantly reduce spend on one channel while holding all other variables constant, then observe the impact on overall conversions. If conversions drop proportionally, that channel is contributing real value. If they hold steady, you may be paying for conversions that would have happened anyway through other channels or organic means. Reviewing how to evaluate marketing channels with a structured methodology can sharpen your experimental design before you begin.
Implementation Steps
1. Select one channel to test at a time. Testing multiple channels simultaneously makes it impossible to isolate individual contributions.
2. Define your test duration based on your typical conversion cycle. Short sales cycles may need two to three weeks. Longer B2B cycles may require six to eight weeks to see meaningful results.
3. Establish a clear baseline for the KPI you are measuring before the test begins, whether that is lead volume, cost per acquisition, or revenue.
4. Run the experiment with consistent spend across all other channels. Any changes to non-test channels during the experiment period will contaminate your results.
5. Analyze the delta between test and control groups to calculate incremental contribution, then use that data to inform budget allocation decisions.
Pro Tips
Start with your highest-spend channels where the budget implications of the test results will be most significant. A small reallocation based on solid incrementality data often produces more impact than a large reallocation based on guesswork. Document your test methodology and results so you can build a repeatable testing cadence over time. Applying marketing budget allocation best practices alongside your test findings will help you translate results into confident spend decisions.
5. Analyze Revenue Attribution, Not Just Lead or Click Volume
The Challenge It Solves
Top-of-funnel metrics are easy to optimize for and easy to misread. A channel that generates high click volume or high lead volume can look like a strong performer until you connect those leads to downstream revenue data and discover that most of them never converted to paying customers. In B2B and SaaS marketing especially, the gap between lead volume and closed revenue can be enormous and channel-specific.
If you are making budget decisions based on cost per lead rather than cost per acquired customer, you may be scaling channels that generate noise and cutting channels that generate revenue.
The Strategy Explained
Revenue attribution connects your ad spend data to your CRM and closes the loop between marketing activity and actual business outcomes. Instead of measuring which channel drove the most clicks or form fills, you measure which channel drove the most closed deals and the highest revenue per customer acquired.
This requires integrating your ad platforms with your CRM so that lead source data follows a prospect through the entire sales cycle. When a deal closes, the revenue gets attributed back to the originating channel and touchpoints. This gives you a true cost-per-revenue metric for each channel rather than a cost-per-lead metric that may be disconnected from business value. Understanding cross-channel attribution and marketing ROI is key to making this connection accurately.
Implementation Steps
1. Integrate your CRM with your attribution platform so lead source data is captured at the point of first contact and carried through the full sales cycle.
2. Set up closed-won revenue as a conversion event in your attribution system, not just form submissions or demo requests.
3. Build a channel performance report that shows cost per lead alongside cost per closed customer and revenue per channel so you can see both the volume and quality dimensions of each channel's contribution.
4. Segment by lead source and compare close rates across channels. A channel with a lower close rate may need to be evaluated differently even if its lead volume looks strong.
Pro Tips
Pay attention to average deal size by channel, not just close rate. A channel that closes fewer deals but at a higher average contract value may be your most valuable source even if it looks modest on a volume basis. Cometly's analytics dashboard connects ad spend to revenue events so you can evaluate channels on the metrics that actually matter to your business.
6. Use AI-Powered Analysis to Surface Patterns Humans Miss
The Challenge It Solves
Cross-channel marketing data is complex. You are dealing with multiple platforms, multiple campaigns, multiple audience segments, and multiple attribution models simultaneously. Manual analysis can surface obvious trends, but it struggles to identify the subtle patterns that live in the intersections between channels, audiences, and creative variables. By the time a human analyst identifies a pattern manually, the optimization opportunity may have already passed.
The volume and velocity of cross-channel data has simply outpaced what manual analysis can reliably handle at scale.
The Strategy Explained
AI-powered attribution tools process large volumes of cross-channel data continuously and surface patterns that would take hours or days to find through manual analysis. Rather than waiting for a weekly reporting cycle to identify a high-performing channel combination or a declining ad set, AI analysis delivers those insights in real time so you can act on them immediately. Exploring the best AI tools for digital marketing can give you a broader sense of how these capabilities are evolving across the industry.
Cometly's AI Ads Manager analyzes performance data across all your connected ad channels and surfaces actionable recommendations based on what is actually working. Instead of manually combing through campaign data to find which channels and creatives are driving the best results, the AI surfaces those patterns for you and tells you where to scale and where to pull back. This shifts your team's time from data gathering to decision making.
Implementation Steps
1. Connect all your active ad platforms to a single attribution system so the AI has a complete, cross-channel data set to analyze rather than siloed platform-level data.
2. Define the outcomes you want the AI to optimize toward. Revenue and cost per acquisition are typically more meaningful targets than click volume or impressions.
3. Review AI-generated recommendations on a regular cadence, at minimum weekly, and implement the highest-confidence suggestions first.
4. Use Cometly's AI Chat feature to ask natural language questions about your data, such as which channel is driving the highest-value customers this month, and get instant answers without building a manual report.
Pro Tips
AI recommendations are most powerful when your underlying data is clean and complete. The quality of the insights you get out is directly proportional to the quality and completeness of the data going in. This is why server-side tracking and consistent UTM structure are prerequisites for getting the most from AI-powered analysis.
7. Build a Unified Marketing Dashboard to Monitor Channel Mix Over Time
The Challenge It Solves
Channel performance is not static. What works today may not work six months from now. Audience saturation, competitive pressure, platform algorithm changes, and seasonality all affect how efficiently each channel converts. If you are only evaluating channel performance at quarterly planning cycles, you are making budget decisions based on data that may already be outdated.
Without a centralized view of cross-channel performance, you are also prone to making decisions in silos, optimizing one channel without understanding how changes there affect the others.
The Strategy Explained
A unified marketing dashboard aggregates performance data from every channel into a single view, giving your team a consistent source of truth for budget decisions. Rather than pulling reports from Meta Ads Manager, Google Ads, LinkedIn Campaign Manager, and your CRM separately and trying to reconcile them manually, a centralized dashboard presents all of that data together with consistent attribution logic applied across the board.
This enables ongoing monitoring rather than point-in-time decisions. You can see when a channel's efficiency starts to decline before it becomes a budget problem, identify emerging opportunities in channels that are gaining momentum, and make confident reallocation decisions based on current data rather than historical assumptions. Cometly's analytics dashboard is designed specifically for this kind of cross-channel visibility, connecting your ad platforms, CRM, and website data in one place.
Implementation Steps
1. Identify all the data sources that need to be represented in your dashboard: ad platforms, CRM, website analytics, and any offline conversion sources.
2. Connect those sources to a centralized attribution platform that applies consistent attribution logic across all channels rather than relying on each platform's native reporting.
3. Build a standard set of channel performance metrics that your team reviews on a consistent cadence: weekly for tactical decisions, monthly for budget allocation reviews, and quarterly for strategic channel mix evaluation.
4. Set up alerts for significant performance changes so you are notified when a channel's cost per acquisition spikes or when a new channel is outperforming expectations, rather than discovering it in a weekly report.
Pro Tips
Resist the urge to build a dashboard that shows everything. A dashboard overloaded with metrics becomes as hard to act on as no dashboard at all. Focus on the five to seven metrics that most directly connect to your business outcomes and make those the centerpiece of your monitoring routine. Add depth only when a specific question demands it.
Putting It All Together
Determining which marketing channel works best is not a one-time decision. It is an ongoing process of measurement, testing, and refinement. The seven strategies in this guide give you a repeatable system to evaluate channel performance with accuracy rather than assumption.
Start with your attribution foundation. If your tracking is broken or incomplete, every channel comparison you make is built on flawed data. Fix that first. Then map your channels to funnel stages, run controlled experiments, and connect your ad spend to actual revenue outcomes rather than surface-level metrics.
As your data improves, AI-powered tools can help you move faster, surfacing patterns across campaigns and channels that would take hours to find manually. A unified dashboard ties it all together, giving your team a single source of truth for budget decisions that you can trust and act on in real time.
Cometly is built to help marketing teams execute exactly this kind of framework. From server-side tracking and multi-touch attribution to AI-powered recommendations and conversion sync, it connects every touchpoint to revenue so you always know what is actually working.
If you are ready to stop guessing and start scaling with confidence, Get your free demo today and start capturing every touchpoint to maximize your conversions.