
If ad reporting takes too long at your company, you are not alone. Marketing teams at B2B SaaS companies routinely spend hours every week pulling data from multiple ad platforms, reconciling numbers in spreadsheets, and building reports that are outdated by the time they reach stakeholders. That manual process creates a dangerous gap between when campaigns run and when decisions get made.
In fast-moving paid media environments, slow reporting means slow optimization, which means wasted budget. The good news is that the reporting bottleneck is almost always fixable. The root causes tend to fall into predictable categories: fragmented data sources, manual data pulls, no standardized reporting structure, and a lack of attribution clarity that forces teams to second-guess every number they see.
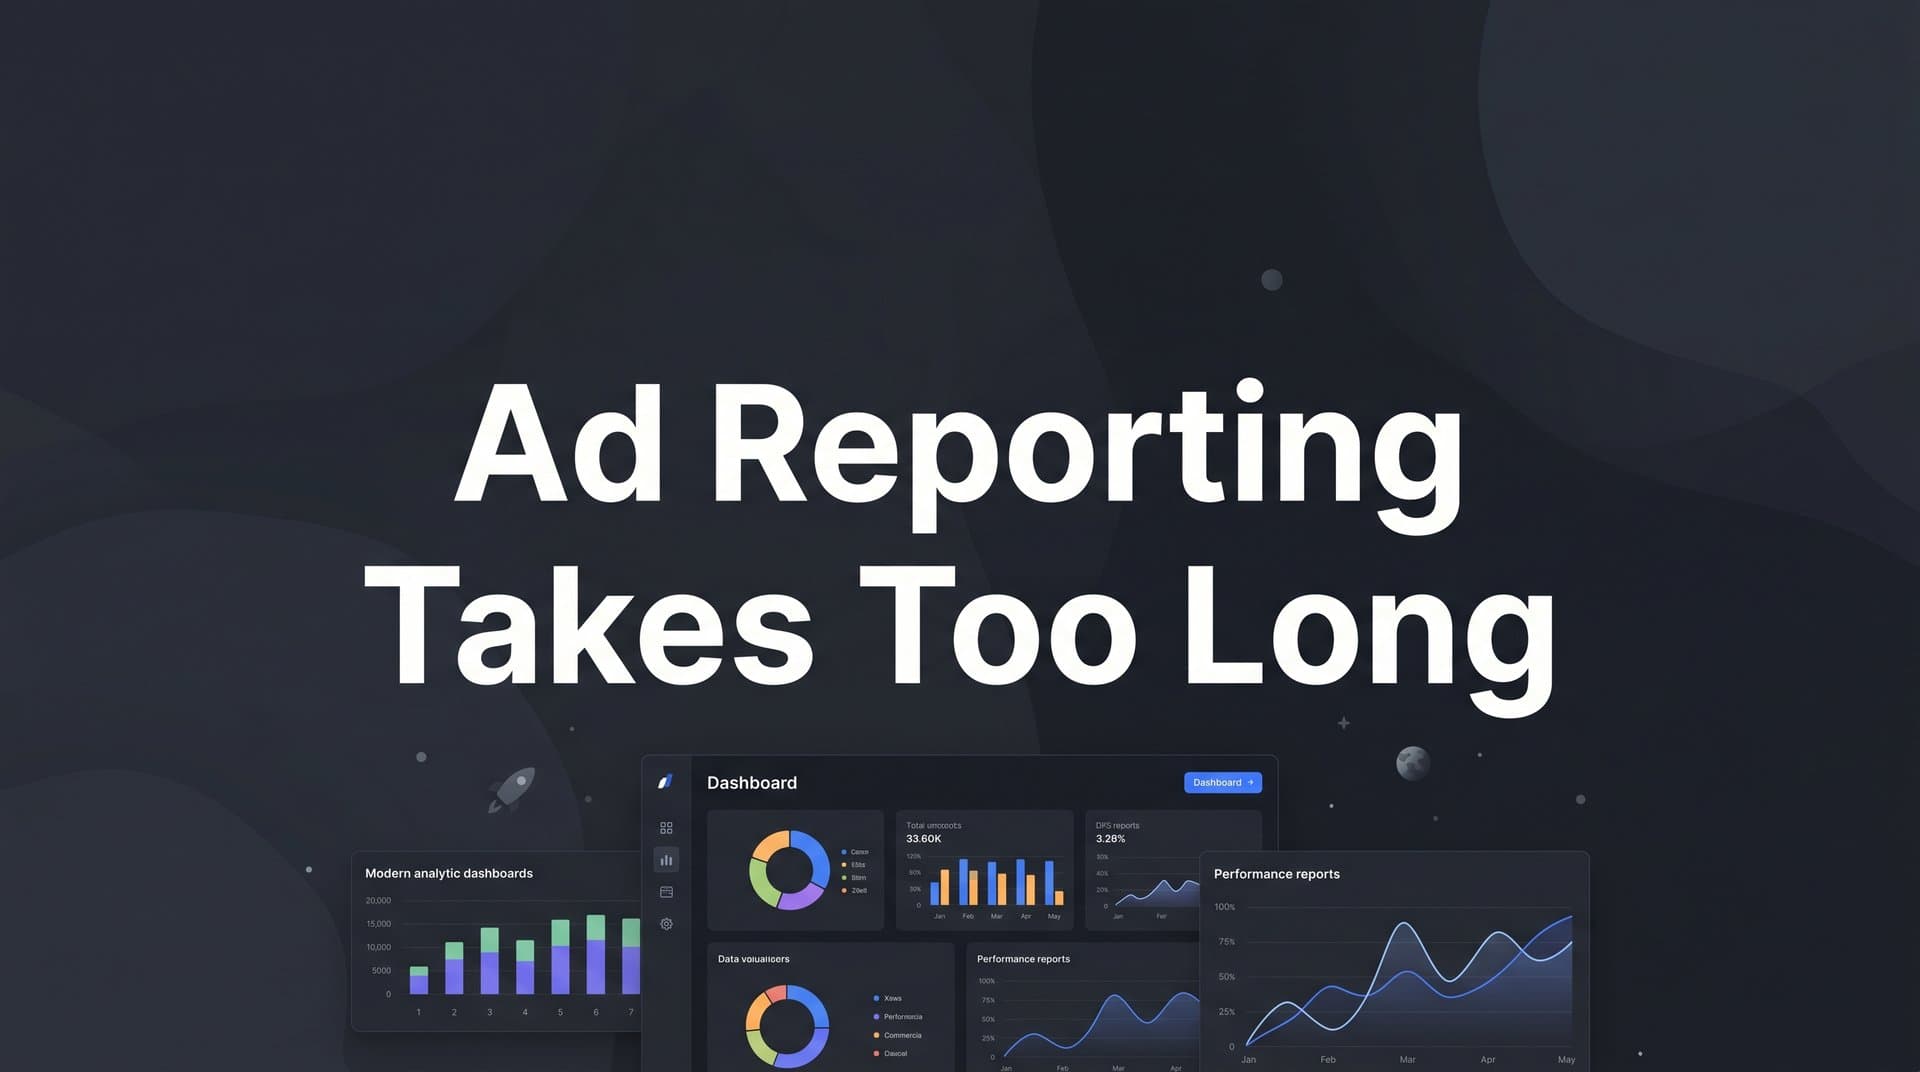
This article outlines seven practical strategies to cut reporting time dramatically, without sacrificing accuracy or insight. Each strategy targets a specific part of the reporting workflow, from how you collect data to how you present it to leadership. Whether you manage a small in-house team or a multi-channel agency operation, these approaches will help you move from reactive reporting to proactive decision-making.
The goal is not just faster reports. It is better data, clearer attribution, and the confidence to act on what you see.
1. Centralize All Ad Data Into a Single Source of Truth
The Challenge It Solves
When your team runs campaigns across Meta, Google, LinkedIn, and other channels simultaneously, every reporting cycle starts with the same painful ritual: logging into each platform, exporting data, and attempting to merge it all into something coherent. This fragmented workflow is the single biggest time drain in most B2B SaaS marketing operations. The data lives in silos, and the act of bridging those silos manually consumes hours that should go toward analysis.
The Strategy Explained
Centralizing your ad data means connecting every channel into one unified dashboard through a dedicated ad tracking management platform. Instead of logging into five platforms and exporting five separate reports, your team sees all campaign data in one place, updated in real time. This single source of truth eliminates the assembly phase of reporting almost entirely.
The shift is significant. When your data is already organized and accessible, reporting becomes a matter of interpretation rather than collection. Your team stops being data janitors and starts being analysts.
Implementation Steps
1. Audit every active ad channel your team currently uses and identify which ones require manual data exports during reporting cycles.
2. Select a marketing attribution platform that offers native integrations with your specific ad channels, CRM, and website tracking. Look for platforms with 50 or more native integrations to ensure coverage.
3. Connect all channels to the centralized platform and validate that data is flowing correctly by cross-referencing a known campaign's numbers against the native platform.
4. Retire the manual export process for any channel that is now feeding data automatically into your unified dashboard.
Pro Tips
Do not try to centralize everything at once. Start with your two or three highest-spend channels, confirm the data integrity, and then expand. Rushing the setup often creates new data quality problems that slow reporting down even further. Accuracy matters more than speed during the migration phase. A dedicated marketing reporting platform can make this transition significantly smoother by providing pre-built integrations and validation tools.
2. Replace Manual Spreadsheets With Automated Data Pipelines
The Challenge It Solves
Spreadsheet-based reporting is one of the most widely recognized bottlenecks in marketing operations. The process typically involves copying data from multiple sources, cleaning formatting inconsistencies, applying formulas, and then hoping no one accidentally overwrites a cell. Every step introduces the possibility of human error, and every error introduces the possibility of a revision cycle that delays the final report.
The Strategy Explained
Automated data pipelines replace the copy-paste workflow with a system that pulls, organizes, and refreshes data on a schedule without human intervention. When your marketing attribution software handles data collection automatically, your team's role shifts from assembling information to interpreting it.
This is not just a time-saving measure. It is a quality improvement. Automated pipelines apply consistent logic to every data pull, which means your numbers are more reliable and your team spends less time defending them in review meetings.
Implementation Steps
1. Map out every manual step in your current reporting workflow, from the first data export to the final report delivery, and estimate the time each step takes.
2. Identify which steps involve data collection versus data analysis. Automation should target collection; your team should own analysis.
3. Implement a platform that automatically syncs ad performance data, conversion events, and CRM updates on a defined schedule, ideally in real time or near-real time.
4. Set up automated alerts for data anomalies, such as sudden drops in conversion tracking, so issues surface immediately rather than during the next reporting cycle.
Pro Tips
Build a simple data quality checklist that runs at the start of each reporting period. Even with automation, a quick validation step confirms that all integrations are firing correctly and prevents a reporting cycle built on incomplete data. Five minutes of validation saves hours of correction. Teams that invest in performance marketing reporting software with built-in anomaly detection find this validation step takes even less time.
3. Standardize Your Attribution Model Before You Report
The Challenge It Solves
One of the most common reasons reporting takes too long has nothing to do with data collection. It is the back-and-forth that happens after the report is shared. When different stakeholders interpret the same campaign results differently because they are using different attribution windows or models, the report triggers a debate rather than a decision. That debate cycle can add days to what should be a straightforward review.
The Strategy Explained
Standardizing your attribution model means agreeing, as a team, on a consistent framework for how credit is assigned to touchpoints before any report is built. Whether you use first-touch, last-touch, linear, or a more sophisticated multi-touch model, the key is consistency. Everyone reads from the same playbook, which eliminates the reconciliation conversations that slow down sign-off.
For B2B SaaS companies with longer sales cycles, multi-touch attribution typically provides the most accurate picture of how campaigns contribute to pipeline. But the best model is the one your entire team agrees to use consistently.
Implementation Steps
1. Document the attribution model or models your team currently uses across different platforms and identify where inconsistencies exist.
2. Align with key stakeholders, including sales, finance, and leadership, on a single primary attribution model that will be used for all reported metrics.
3. Configure your attribution platform to apply that model consistently across all channels and conversion events.
4. Include a brief attribution model reference in every report so stakeholders always know how numbers are being calculated, reducing interpretive confusion.
Pro Tips
Consider maintaining a secondary attribution view for internal analysis purposes. Showing stakeholders a primary model while your team also reviews a multi-touch attribution view gives you the consistency of standardized reporting without losing the analytical depth that helps you optimize campaigns. You can explore customer journey tracking to understand how different models reflect the full path to conversion.
4. Build Reusable Report Templates Tied to Business Outcomes
The Challenge It Solves
Starting every reporting cycle from a blank dashboard or empty spreadsheet is a hidden time sink. Teams rebuild the same structure repeatedly, make slightly different formatting choices each time, and end up with reports that look different enough to confuse stakeholders who are trying to track trends over time. The lack of a standardized template also means every report requires a fresh round of decisions about which metrics to include.
The Strategy Explained
Reusable report templates solve this by establishing a consistent structure that maps ad metrics directly to the business outcomes your stakeholders care about: pipeline generated, cost per opportunity, revenue influenced, and return on ad spend. When the template already exists, reporting becomes a process of populating and interpreting rather than designing from scratch.
The most effective templates are organized around questions, not just metrics. Instead of listing impressions, clicks, and conversions in a table, the template answers: which campaigns drove the most qualified pipeline this period, and at what cost? A well-structured PPC reporting template can serve as a strong starting point for building this kind of outcome-focused structure.
Implementation Steps
1. Interview your primary report stakeholders and ask them to identify the three to five questions they most want answered in every reporting cycle.
2. Design a template structure that leads with those answers, using headline metrics at the top and supporting detail below for stakeholders who want to dig deeper.
3. Build the template inside your attribution platform or reporting tool so it populates automatically when data refreshes, requiring no manual reformatting.
4. Review and update the template quarterly to ensure it continues to reflect current business priorities and campaign structures.
Pro Tips
Create separate templates for different audiences. A leadership summary template should be concise and outcome-focused. A channel performance template for your media team can include more granular campaign and ad-level data. Matching the template to the audience eliminates the filtering work that typically happens during report preparation. Reviewing a management reporting template designed for executive audiences can help you structure the leadership version effectively.
5. Use Server-Side Tracking to Eliminate Data Gaps
The Challenge It Solves
Browser-based pixel tracking has become increasingly unreliable as ad blockers, browser privacy restrictions, and cookie limitations have expanded. When conversion data is incomplete, reporting teams spend significant time trying to reconcile discrepancies between platform-reported conversions and actual CRM activity. That reconciliation work is one of the most frustrating and time-consuming parts of the reporting cycle because the gaps are often unexplainable without better infrastructure.
The Strategy Explained
Server-side tracking and Conversion API integrations send conversion signals directly from your server to ad platforms, bypassing the browser entirely. This approach is more reliable, more accurate, and significantly less affected by the privacy and tracking limitations that degrade pixel data. Cleaner conversion data means fewer discrepancies to explain and less time spent on manual correction during reporting. Evaluating the leading server-side tracking tools available today can help you identify the right implementation approach for your stack.
For B2B SaaS companies tracking high-value conversion events like demo requests, trial signups, and qualified lead submissions, the accuracy improvement from server-side lead tracking can meaningfully change how campaigns appear to perform, and how confidently teams can act on that data.
Implementation Steps
1. Audit your current tracking setup to identify which conversion events rely exclusively on browser-based pixels and which are at risk of underreporting.
2. Implement server-side event tracking for your highest-priority conversion events, starting with the ones that matter most to pipeline attribution.
3. Configure Conversion API connections for Meta and Google to ensure those platforms receive enriched, accurate conversion signals for optimization purposes.
4. Compare server-side reported conversions against CRM data for a defined period to validate accuracy and identify any remaining gaps.
Pro Tips
Run browser-based and server-side tracking in parallel during the transition period. This lets you measure the gap between the two methods and understand how much conversion data was previously being lost. That gap is often larger than teams expect, and documenting it helps make the case for the infrastructure investment.
6. Connect Ad Spend Directly to Revenue to Cut Stakeholder Back-and-Forth
The Challenge It Solves
One of the most common reasons reporting approval takes longer than it should is that the report answers the wrong question. Stakeholders in B2B SaaS companies do not primarily want to know how many clicks a campaign generated. They want to know how much pipeline and revenue those clicks produced. When reports stop at ad metrics without connecting to business outcomes, stakeholders ask follow-up questions that require additional data pulls, and the reporting cycle extends by days.
The Strategy Explained
Connecting ad spend directly to revenue attribution means integrating your ad platform data with your CRM pipeline and closed-won revenue data. When these systems are connected, a single report can show not just cost per click but cost per opportunity, cost per closed deal, and return on ad spend calculated against actual revenue. That completeness eliminates the back-and-forth that delays sign-off.
Platforms like Cometly are built specifically for this use case, connecting ad data with CRM pipeline and Stripe revenue so B2B SaaS teams can see the full picture from first ad click to closed deal in a single view. This is what revenue attribution for SaaS growth teams looks like in practice.
Implementation Steps
1. Identify the revenue data source your company uses as the system of record, whether that is Salesforce, HubSpot, Stripe, or another CRM or billing platform.
2. Connect that revenue data source to your marketing attribution platform so deal stage and closed revenue data flows alongside ad performance metrics.
3. Configure your reports to include pipeline-level metrics such as cost per opportunity and revenue influenced by channel, alongside standard ad metrics.
4. Present these metrics in your stakeholder report as the lead section so the business impact question is answered before anyone has to ask it.
Pro Tips
Pay attention to pipeline velocity when evaluating channel performance. A channel that generates a high volume of opportunities but takes twice as long to close may be less valuable than one that generates fewer but faster-moving deals. Revenue-connected reporting surfaces these dynamics in ways that ad-metric-only reports never can.
7. Use AI-Driven Insights to Surface What Matters Without Manual Analysis
The Challenge It Solves
Even after centralizing data and automating collection, many teams still spend significant time manually reviewing campaign performance across channels to identify what is working and what needs attention. When you are managing dozens of campaigns across multiple platforms, that review process can take hours. By the time the analysis is complete, the window for timely optimization has often passed.
The Strategy Explained
AI-driven analysis tools can scan campaign performance data across all channels simultaneously and surface the insights that most warrant attention, whether that means flagging an underperforming ad set, identifying a channel that is generating outsized pipeline contribution, or recommending budget shifts based on performance trends. This capability compresses what used to be hours of manual review into a prioritized list of actions. Exploring the best AI tools for digital marketing can help you identify which solutions are best suited to your team's workflow.
Cometly's AI ads manager is built for exactly this workflow. It analyzes ad performance across every channel, identifies high-performing and underperforming campaigns, and delivers clear recommendations so your team can act with confidence rather than spending time digging through raw data. The result is not just faster reporting but faster optimization.
Implementation Steps
1. Ensure your centralized data platform has sufficient historical data, ideally at least 30 days of campaign performance, to generate meaningful AI-driven insights.
2. Configure your AI analysis tool to monitor the metrics that matter most to your business, such as cost per opportunity, pipeline influenced, and return on ad spend.
3. Review AI-generated recommendations at the start of each reporting cycle and use them as the foundation for your analysis section rather than starting from raw data.
4. Feed enriched conversion data back to ad platforms like Meta and Google so their own AI optimization algorithms benefit from your more complete conversion signals.
Pro Tips
Treat AI recommendations as a starting point for analysis, not a replacement for human judgment. The most effective teams use AI to identify what to look at and then apply their own strategic context to decide what to do about it. This combination of machine speed and human judgment produces better decisions than either approach alone.
Putting It All Together
Ad reporting that takes too long is not a minor inconvenience. It is a strategic liability that delays optimization decisions, erodes stakeholder confidence, and burns team capacity that should go toward growth.
The seven strategies in this article address the problem at every layer of the reporting workflow. Start by centralizing your data and eliminating the manual pulls that consume the most time. Then lock in a consistent attribution model so your numbers stop generating more questions than answers. From there, build reusable templates, close the data gaps with server-side tracking, and connect your ad spend to actual revenue so every report tells a complete story. Finally, let AI surface the insights that matter most so your team spends time acting on data rather than digging through it.
If you are deciding where to start, prioritize the strategies that address your biggest current bottleneck. If data collection is the problem, start with centralization and automation. If stakeholder confusion is the problem, start with attribution standardization and revenue-connected reporting. Each strategy delivers value on its own, and the impact compounds as you implement more of them together.
Cometly is built specifically for B2B SaaS marketing teams who need accurate, real-time attribution data without the reporting overhead. It connects your ad platforms, CRM, and website into one unified view so you can see what is driving pipeline and revenue, share those insights quickly, and make faster decisions with confidence. If ad reporting is eating your team's time, the fix starts with better infrastructure, not more hours.
Ready to elevate your marketing game with precision and confidence? Discover how Cometly's AI-driven recommendations can transform your ad strategy. Get your free demo today and start capturing every touchpoint to maximize your conversions.


